 Fourplex
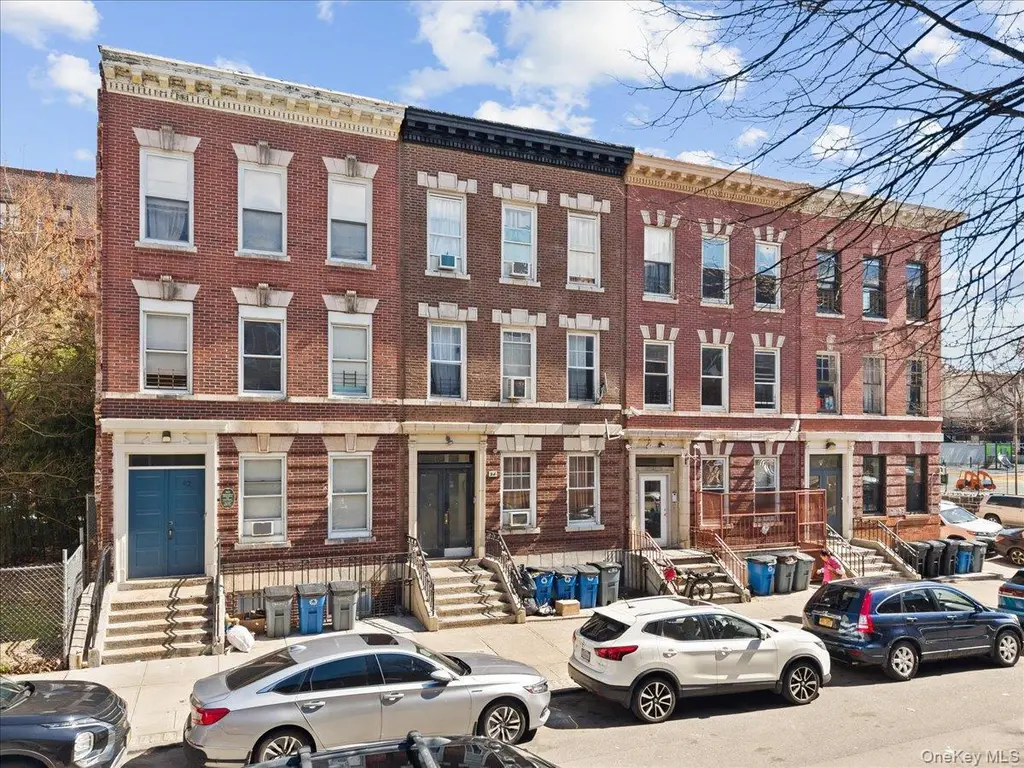
94 Elliott Ave · Yonkers, NY
Flood risk 8/10 · Major
- FEMA flood zone
- X (unshaded)
- Chance of flooding over 30 yrs
- 0.78%
- Est. flood insurance / yr
- $473 – $860
Fire risk 1/10 · Minimal
- Est. fire insurance / yr
- $691 – $1,283
Heat risk 6/10 · Moderate
- Hot days now (above 99°F)
- 7 days/yr
- Hot days in 30 yrs
- 15 days/yr
Wind risk 6/10 · Moderate
- Chance of severe wind over 30 yrs
- 27.0%
Air-quality risk 3/10 · Minor
- Unhealthy air days now
- 3 days/yr
- Unhealthy air days in 30 yrs
- 4 days/yr
Risk factors via First Street. Map © Google.
Why this score? — see what drove the B- grade
The composite is a weighted blend of 9 inputs, each scored 0–100. Each bar is that input's sub-score; the figure is the points it added to the 100-point composite (weight × sub-score).
- Cash flow +24.9/30.0
- ARV discount +15.0/15.0
- DSCR +8.1/10.0
- 1% rule +5.2/10.0
- Rent growth +4.8/5.0
- Schools +4.1/10.0
- Livability +3.4/5.0
- Condition / age +2.5/5.0
- Appreciation +0.0/10.0
$1,230,000
🖨 Deal sheet (PDF) 📄 Offer letter ✓ Due diligence
Multi-family units
County records classify this as Multi-Family (5+ Unit). Listing-text estimate: 4 units. estimate disagrees with records
5+ unit building — per-unit beds/baths from public records are typically unavailable; the breakdown below (if shown) is an estimate from the listing text.
Listing remarks MLS
Prime investment opportunity in Yonkers featuring a well-maintained four-family property with strong income potential and long-term upside. The building consists of four residential units, all currently occupied on a month-to-month basis, offering flexibility for future rent increases or repositioning. Tenants are responsible for all utilities except heat, with annual heating costs approximately $12,000, helping investors plan operating expenses accordingly. Units offer desirable interior features including hardwood flooring, granite countertops, dishwashers, windowed bathrooms, dedicated dining areas, basement laundry access, and shared backyard space. Conveniently located near major roadways and public transportation, the property provides easy access to New York City and surrounding areas. It is situated close to shopping centers, restaurants, schools, and everyday essentials, as well as nearby recreational options such as Tibbetts Brook Park. This location offers a strong rental market with consistent demand, making it an excellent opportunity for investors seeking a stable, income-producing asset with future upside potential.
Key facts
- Four family property
- Hardwood flooring
- Residential units
Tags
Neighborhood map
What this means for you Summary
Snapshot
- This is a 4 × 2-bed/1.0-bath units multifamily listed at $1.23M.
Deal economics
- At list price, monthly cash flow is $3k ($31k/yr) — positive. Per door: $648/mo.
- The deal already cash-flows at list — no discount required.
- Meets the 1% rule at list price ($13k rent vs $1.23M).
- Recommended offer: $1.16M (6.0% below list) — sets the bar for market timing.
- Cap rate 8.9% vs local median 5.4% in Yonkers — top-decile yield for the area; either an underpriced asset or a hidden risk that comps aren't pricing in. Stress-test before assuming the spread holds.
Location & tenants
- Location reads 68/100 on livability (#528 in NY) — a middle-class / working-renter tenant base. Strengths: employment A, commute B; Watch: amenities F, cost of living F.
- Yonkers City School District (suburban): math 41% / reading 54% proficiency, ranked #413 of 590 in NY (top 70%) — families likely to look elsewhere, expect single-tenant / working-renter base with shorter leases; 64% free/reduced lunch — lower-income household profile, screen leases tightly.
- Market conditions: Rents rising fast (+9.0%/yr); 87 active listings in the ZIP; 954 units permitted in Westchester County in 2024 (649 in 5+ unit buildings).
- At $12,508/mo this rent would consume 221% of the median local household income ($68k/yr) (locally 2783% of renters already pay >50% of income on rent) — very limited rent-growth headroom before tenants either downsize or default.
Forward outlook
- Local home prices are declining (-3.0%/yr); year-one equity from $9k of loan paydown is wiped out by about $37k of value loss. Plan a longer hold.
- Westchester County population projected at +10% by 2050 — modest demand growth; plan on rents tracking national, not racing it.
- At projected returns (-3.0% appreciation + 8.0% rent growth), your $344k cash investment doubles in ~8 years — after that, you're playing with house money.
Negotiation context
- It's been on market 87 days — a 6% lower offer ($1.16M) is reasonable based on typical stale-listing flexibility.
- 6 sale attempts since 27y ago with the ask held roughly flat each time — persistent listings suggest the price (not the market) is what's stuck; bring a comps-based counter.
- Current owner paid $800k; list at $1.23M implies a 54% gain — meaningful room to come down on a strong offer.
Risks & watch-outs
- Watch-outs: flood insurance adds $56/mo.
- Climate carrying-cost: severe flood risk; major wind risk, 27% chance of damaging wind over 30y; extreme-heat days projected 7→15/yr by 2055 (HVAC capex compounding) — expect insurance premiums to compound above CPI over the hold.
Questions for the listing agent
- It's been on market 87 days. Have you received any prior offers? Is the seller open to a 6% concession, seller financing, or rate buy-down credit?
- Can we see the unit-by-unit rent roll, current vacancy, and any below-market leases? What's the average tenancy length?
- What capital expenditures (roof, boiler, parking lot, exteriors) have been made in the last 5 years, and what's planned in the next 2?
- Built in 1974 — when were the roof, HVAC, electrical panel, plumbing, and water heater last replaced?
- What's the actual annual flood-insurance premium (NFIP or private), and is the property in a SFHA with mandatory coverage?
- Why hasn't it sold? Are there any deal-killer items the seller is aware of (foundation, flood, title, zoning, code violations)?
- Is there a deadline driving the sale (1031 exchange, divorce, estate, relocation)? That informs how much negotiation room exists.
- What's the average days-on-market for RENTAL listings here right now (not sales)? A rising rental-DOM trend means longer vacancies and softer asking-rent achievability than the comps imply.
- What's the recent tenant-quality profile in this submarket — average credit score on applications, eviction rate, late-payment / NSF rate, and stable-employment percentage? A property-management company in the area should have these aggregated.
- How much new apartment / multifamily construction is in the pipeline within 1–3 miles? Heavy new supply (>2% of stock underway) typically softens rents 12–24 months out; light construction supports rent growth.
Investment metrics
- 1% rule
- 1.02% ✓
- Cap rate
- 8.88%
- Cash-on-cash
- 9.22%
- DSCR
- 1.41
- GRM
- 8.2
CMA / ARV
- ARV (median comp)
- $1,504,381
- List price
- $1,230,000
- Delta
- -18.24%
- Verdict
- UNDERPRICED
- Comps
- 20 within 1.0 mi
Show comp detail 2 sales within ~0.75 mi
| Address | Dist | Beds/Ba | Sqft | Sold | Price | $/sf | Match |
|---|---|---|---|---|---|---|---|
| 161 Park Hill Ave | 0.41mi | 7/3.0 (-1) | 5,027 (-1%) | 18mo | $935,000 | $186 | 55 |
| 51 Courter Ave | 0.74mi | 8/6.0 | 4,653 (-8%) | 1mo | $885,000 | $190 | 43 |
Match score weights: distance 35% · size 25% · config 20% · recency 20%. Top-matched comps best support the ARV.
Projected returns pro-forma
-3.0% appreciation · 8.0% rent growth · sell at horizon
- IRR
- 2.3%
- Equity multiple
- 1.09×
- Total profit
- $31,267
- Equity at exit
- $183,397
- IRR
- 15.8%
- Equity multiple
- 2.56×
- Total profit
- $538,336
- Equity at exit
- $106,348
Cash invested: $344,400 (down + closing). Projections, not guarantees.
Landlord ↔ Tenant lean methodology
- Overall (CITY)
- 5 Strongly Tenant-Friendly
- State New York
- 15 Strongly Tenant-Friendly · D+10
- County
- — inherits STATE
- City Yonkers
- 5 Strongly Tenant-Friendly · D+20
ZIP-level market 10705
- Rents YoY
- 9.0%
- Active inventory
- 87
- Price-to-rent
- 32.8×
Monthly cashflow live
- Estimated rent
- $12,508 high interval (Pro) →
- Mortgage (P&I)
- −$6,450
- Tax from tax record
- −$272 /mo · $3,262/yr
- Insurance
- −$512
- Flood insurance flood zone
- −$56 /mo · $666/yr
- HOA
- −$0
- Vacancy / Maint / Mgmt
- −$2,627
- Net cashflow
- $2,591
Break-even live
Sensitivity live
| Price | -10% $3,287 | -5% $2,939 | +0% $2,591 | +5% $2,243 | +10% $1,895 |
|---|---|---|---|---|---|
| Rent | -10% $1,603 | -5% $2,097 | +0% $2,591 | +5% $3,085 | +10% $3,579 |
| Rate | -1.0pp $3,211 | -0.5pp $2,904 | base $2,591 | +0.5pp $2,272 | +1.0pp $1,948 |
4-unit breakdown (identical units grouped — click to expand)
| Units | Beds | Baths | Est. rent |
|---|---|---|---|
| 4× units | 2 | 1 | $12,508 |
| #1 | 2 | 1 | $3,127 |
| #2 | 2 | 1 | $3,127 |
| #3 | 2 | 1 | $3,127 |
| #4 | 2 | 1 | $3,127 |
| Total (4 units) | $12,508 | ||
UW: 25.0% down · 7.5% · 30yr · 1.5% tax · 5.0% vac · 8.0% maint · 8.0% mgmt
Financing live
Cash to close
- Down payment
- $307,500
- Closing costs
- $36,900
- Reserves months
- —
- Total cash needed
- —
Loan-product check · same deal, 3 products live
Conventional
25% down · 7.5% · 30yr
- Down + closing
- —
- Monthly P&I
- —
- Monthly cashflow
- —
- DSCR
- —
- Eligible?
- —
Personal DTI + credit; lowest rate.
DSCR
20% down · 8.5% · 30yr
- Down + closing
- —
- Monthly P&I
- —
- Monthly cashflow
- —
- DSCR
- —
- Eligible?
- —
No personal income docs; deal must DSCR.
Hard money
10% down · 12.0% · 12mo
- Down + closing
- —
- Monthly P&I
- —
- Monthly cashflow
- —
- DSCR
- —
- Eligible?
- —
Short-term bridge; refi at stabilization.
Listing history 32 events
-
2026-06-21days on market $1,230,000 Active 87 DOM
-
2026-06-18days on market $1,230,000 Active 84 DOM
-
2026-06-17days on market $1,230,000 Active 83 DOM
-
2026-06-16days on market $1,230,000 Active 82 DOM
-
2026-06-15days on market $1,230,000 Active 81 DOM
-
2026-06-13days on market $1,230,000 Active 79 DOM
-
2026-06-09days on market $1,230,000 Active 75 DOM
-
2026-06-08days on market $1,230,000 Active 74 DOM
-
2026-06-07days on market $1,230,000 Active 73 DOM
-
2026-06-04days on market $1,230,000 Active 70 DOM
-
2026-06-03days on market $1,230,000 Active 69 DOM
-
2026-06-02days on market $1,230,000 Active 68 DOM
-
2026-06-01days on market $1,230,000 Active 67 DOM
-
2026-05-31days on market $1,230,000 Active 66 DOM
-
2026-03-26$1,230,000 Active 1149-char remark
Show marketing remark (1149 chars)
Prime investment opportunity in Yonkers featuring a well-maintained four-family property with strong income potential and long-term upside. The building consists of four residential units, all currently occupied on a month-to-month basis, offering flexibility for future rent increases or repositioning. Tenants are responsible for all utilities except heat, with annual heating costs approximately $12,000, helping investors plan operating expenses accordingly. Units offer desirable interior features including hardwood flooring, granite countertops, dishwashers, windowed bathrooms, dedicated dining areas, basement laundry access, and shared backyard space. Conveniently located near major roadways and public transportation, the property provides easy access to New York City and surrounding areas. It is situated close to shopping centers, restaurants, schools, and everyday essentials, as well as nearby recreational options such as Tibbetts Brook Park. This location offers a strong rental market with consistent demand, making it an excellent opportunity for investors seeking a stable, income-producing asset with future upside potential.
-
2022-12-23soldstatus $800,000
-
2017-08-30soldstatus $500,000 Sold 153-char remark
Show marketing remark (153 chars)
Great Investment!!! Four family brick townhouse, with 2 - one bedroom,1- three bedrooms, and 1- four bedroom apartment. Low rents with room for increase.
-
2017-07-21historical Pending 153-char remark
Show marketing remark (153 chars)
Great Investment!!! Four family brick townhouse, with 2 - one bedroom,1- three bedrooms, and 1- four bedroom apartment. Low rents with room for increase.
-
2017-05-30$539,000 Active 153-char remark
Show marketing remark (153 chars)
Great Investment!!! Four family brick townhouse, with 2 - one bedroom,1- three bedrooms, and 1- four bedroom apartment. Low rents with room for increase.
-
2014-01-27price $529,000
-
2007-11-02historical
-
2007-05-02
-
2006-03-03soldstatus $550,000
-
2005-09-29soldstatus $550,000
-
2005-07-08historical
-
2005-06-20$550,000
-
2005-05-14historical
-
2004-12-14
-
2000-06-25historical
-
1999-05-17
-
1990-01-29soldstatus $170,000
-
1988-12-29soldstatus $170,000
ⓘ Source: listings_history table (triggers on properties + properties_extension) + one-shot
backfill from property_details.listing_events for pre-trigger history.
Tax reassessment forecast NY · Partial reset (capped growth)
- Current annual tax
- $3,262 · $272/mo
- Projected year-2 tax
- $12,025 · $1,002/mo
- Expected delta
- +$8,762/yr (+$730/mo · 268.6%)
ⓘ Screening estimate from a state-policy table — verify with the county assessor before closing.
Climate risk First Street
- Flood 8/10 Severe FEMA zone X (unshaded) · 78% chance over 30 yrs
- Wildfire 1/10 Low
- Heat 6/10 Major 7 d/yr ≥99°F today · 15 d/yr by 30 yrs out
- Wind 6/10 Major 27% chance of damaging wind over 30 yrs
- Air quality 3/10 Moderate 3 unhealthy d/yr today · 4 by 30 yrs out
Nearby sold comps map
Loading sold comps map…
Walkable amenities ~0.75 mi
Loading nearby amenities…
Taxation est. · year 1
- Rental income
- $150,096
- − Mortgage interest
- −$68,899
- − Property taxes
- −$3,262
- − Insurance
- −$6,816
- − Repairs & maintenance
- −$12,008
- − Management
- −$12,008
- − Depreciation
- −$35,782
- Taxable income
- $11,321
- Est. tax owed @ 24.0%
- −$2,717
- After-tax cash flow
- $28,377/yr
For passive investors: Depreciation is non-cash, so a rental often shows a tax loss while cash-flowing — sheltering income. Rental losses are passive: they offset passive income freely, and up to $25,000/yr can offset ordinary (W-2) income if you actively participate and your MAGI is under $100k (phasing out to $0 by $150k); unused losses carry forward. On sale, claimed depreciation is recaptured at up to 25%, and gains may owe capital-gains tax (a 1031 exchange can defer both). Figures are a year-1 estimate at your 24.0% rate — not tax advice; consult a CPA.
Schools (NCES district)
- District
- Yonkers City School District
- NCES district ID
- 3631920
- Math proficiency
- 41% ▼ -1.00%
- Reading proficiency
- 54% ▲ 14.00%
- Median HH income
- $58,042
- Composite
- 41.43/100
- National rank
- #3471
- State rank
- #413 of 590 in NY
Livability — Yonkers
- Score
- 68/100
- State rank
- #528
- US rank
- #9394
Category grades
Schools grade is shown separately in the Schools card above.
Census & demographics
- Census place
- Yonkers, NY
- County
- Westchester County · 709,332 people
- City population
- 212,407
- Metro
- New York-Newark-Jersey City, NY-NJ-PA
- Population (ZIP)
- 38,887
- Household income
- $67,918
- Rent vs Own
- Severe rent burden
- 2783.0
Population outlook (Westchester County) Hauer SSP2
- Today (2025)
- 1,028,035 people
- By 2030
- 1,051,636 · +2.3%
- By 2040
- 1,098,520 · +6.9%
- By 2050
- 1,136,044 · +10.5%
- By 2075
- 1,196,925 · +16.4%
- By 2100
- 1,175,147 · +14.3%
Race, ethnicity, and origin ACS 2023
- Neighborhood character
- Diverse neighborhood (Simpson 0.56)
- Race & ethnicity
- Hispanic / Latino 62% White 17% Two or more races 16% Black 12% Asian 5% Native American 1%
- Hispanic origin (detail)
- Mexican 13% Puerto Rican 9% Dominican 27%
- Common ancestry
- Scotch-Irish 1% Romanian 1%
- Foreign-born
- 40% · Canada, Jamaica, South Korea
- Languages at home
- 39% English-only · Spanish 51% Other Indo-European 3% Other Asian/Pacific 2%
Political lean MEDSL · Westchester
- 2024 margin
- Strong D (+26.3) · D 63.1% · R 36.9%
- 2008→2024 swing
- -1.3pp toward R · 2008: 27.6pp · 2024: 26.3pp
- All cycles
- 2024: D+26.3 2020: D+36.3 2016: D+32.8 2012: D+22.2 2008: D+27.6
Not yet ingested
- Civics
- —
Market trends
- HPI YoY
- ▼ -368.22%
- Current HPI
- 314.1777
- Rent YoY
- ▲ 9.00%
- Metro
- New York-Newark-Jersey City, NY-NJ-PA
- State GDP YoY
- ▲ 2.60%
- F500 in state
- 92
Industry mix (Fortune 500 HQ in NY)
| Industry | F500 HQs | Revenue |
|---|---|---|
| Financial Services | 10 | $950B |
|
||
| Consumer Goods | 9 | $162B |
|
||
| Insurance | 4 | $225B |
|
||
| Telecommunications | 2 | $144B |
|
||
| Pharmaceuticals | 2 | $112B |
|
||
| Media / Entertainment | 2 | $69B |
|
||
Price history
+623.5% since first listed18 events — show timeline
- 2026-03-26 Listed $1,230,000 OneKey® MLS as Distributed by MLS Grid
- 2022-12-23 Sold (Public Records) $800,000 Public Records
- 2017-08-30 Sold (MLS) $500,000 OneKey® MLS as Distributed by MLS Grid
- 2017-07-21 Contingent — OneKey® MLS as Distributed by MLS Grid
- 2017-05-30 Listed $539,000 OneKey® MLS as Distributed by MLS Grid
- 2014-01-27 Price Changed $529,000 HGMLS
- 2007-11-02 Delisted — HGMLS
- 2007-05-02 Listed — HGMLS
- 2006-03-03 Sold (Public Records) $550,000 Public Records
- 2005-09-29 Sold (MLS) $550,000 HGMLS
- 2005-07-08 Delisted — HGMLS
- 2005-06-20 Listed $550,000 HGMLS
- 2005-05-14 Delisted — HGMLS
- 2004-12-14 Listed — HGMLS
- 2000-06-25 Delisted — HGMLS
- 1999-05-17 Listed — HGMLS
- 1990-01-29 Sold (Public Records) $170,000 Public Records
- 1988-12-29 Sold (Public Records) $170,000 Public Records
Property tax history
-21.5%/yrLatest (2025): $3,262 · +0.5% YoY. Source: county tax records.
Cash-flow waterfall
monthlySold comps — $/sqft
last 12 mo · ≤1 miLoading sold comps…