 Triplex
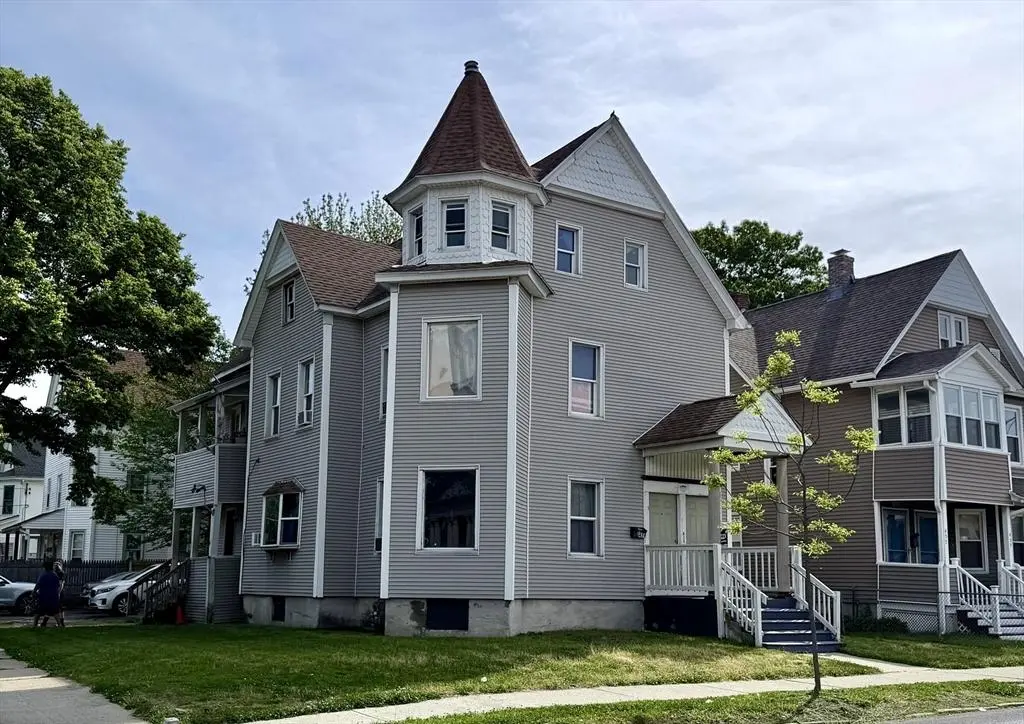
459-461 Armory St · Springfield, MA
Flood risk 1/10 · Minimal
- FEMA flood zone
- X (unshaded)
- Chance of flooding over 30 yrs
- 0.0%
- Est. flood insurance / yr
- $473 – $860
Fire risk 1/10 · Minimal
- Est. fire insurance / yr
- $915 – $1,699
Heat risk 5/10 · Moderate
- Hot days now (above 99°F)
- 7 days/yr
- Hot days in 30 yrs
- 16 days/yr
Wind risk 5/10 · Moderate
- Chance of severe wind over 30 yrs
- 26.0%
Air-quality risk 2/10 · Minimal
- Unhealthy air days now
- 1 days/yr
- Unhealthy air days in 30 yrs
- 2 days/yr
Risk factors via First Street. Map © Google.
Why this score? — see what drove the B grade
The composite is a weighted blend of 9 inputs, each scored 0–100. Each bar is that input's sub-score; the figure is the points it added to the 100-point composite (weight × sub-score).
- Cash flow +30.0/30.0
- ARV discount +11.2/15.0
- DSCR +10.0/10.0
- 1% rule +8.8/10.0
- Livability +3.7/5.0
- Rent growth +2.5/5.0
- Condition / age +2.5/5.0
- Schools +1.6/10.0
- Appreciation +0.0/10.0
$395,000
🖨 Deal sheet (PDF) 📄 Offer letter ✓ Due diligence
Multi-family units
County records classify this as Multi-Family (2-4 Unit). Listing-text estimate: 3 units. confirmed
Listing remarks
Excellent opportunity for investors! This fully rented three-family investment property features long-term tenants and offers 3,075 square feet of living space with a total of 14 rooms, 8 bedrooms, and 3 full bathrooms. The first and second-floor units each offer 3 bedrooms and 1 full bathroom, while the third-floor unit features 2 bedrooms and 1 full bathroom. Each unit has separate utilities. Current rents are below market value, offering strong potential for increased cash flow. Conveniently located near shopping, restaurants, parks, medical facilities, and major commuter routes. Showings deferred until the Open House on Sunday, June 7, from 12 pm to 2 pm.
Key facts
- Strong potential
- Long-term tenants
- Separate utilities
Tags
Property features AI
Finance
- Other: Listing status: Active
- HOA & community: Not a senior community
Exterior
- Parking: Four off-street/open parking spaces
- Utilities: Public water; Public sewer
- Home design: Three-story building; 3-family property (3 units up/down); Total building area approximately 3,075
- Construction: Concrete perimeter foundation; Lead paint: certified treated; Year built (public records)
- Exterior features: Corner lot; Lot size about 0.12 acres
Interior
- Bathrooms: Three full bathrooms
- Interior features: Total of 14 rooms; Three units in the building
Neighborhood map
What this means for you Summary
Snapshot
- This is a 3 × 3-bed/?-bath units multifamily listed at $395k. Condition is rated fair.
Deal economics
- At list price, monthly cash flow is $2k ($19k/yr) — positive. Per door: $524/mo.
- The deal already cash-flows at list — no discount required.
- Meets the 1% rule at list price ($5k rent vs $395k).
- Cap rate 11.1% vs local median 4.9% in Springfield — top-decile yield for the area; either an underpriced asset or a hidden risk that comps aren't pricing in. Stress-test before assuming the spread holds.
Location & tenants
- Location reads 73/100 on livability (#97 in MA) — a middle-class / working-renter tenant base. Strengths: commute A+, health & safety A+, amenities A; Watch: schools D, crime F, employment D-.
- Springfield (urban): math 13% / reading 25% proficiency, ranked #296 of 302 in MA (top 98%) — low school quality limits family demand, transient renter base, plan for 1-2y turnover; 81% free/reduced lunch — lower-income household profile, screen leases tightly.
- Market conditions: 23 active listings in the ZIP; 453 units permitted in Hampden County in 2024 (116 in 5+ unit buildings).
Forward outlook
- Local home prices are declining (-3.0%/yr); year-one equity from $3k of loan paydown is wiped out by about $12k of value loss. Plan a longer hold.
- Hampden County population projected at +5% by 2050 — modest demand growth; plan on rents tracking national, not racing it.
- At projected returns (-3.0% appreciation + 3.0% rent growth), your $111k cash investment doubles in ~8 years — after that, you're playing with house money.
Negotiation context
- Only 14 days on market — expect competitive offers; lowballing is unlikely to land.
- 2 sale attempts since 6y ago with the ask held roughly flat each time — persistent listings suggest the price (not the market) is what's stuck; bring a comps-based counter.
- Current owner paid $175k; list at $395k implies a 126% gain — meaningful room to come down on a strong offer.
Risks & watch-outs
- Watch-outs: built in 1898 — expect roof / HVAC / electrical / plumbing capex.
- Climate carrying-cost: moderate wind risk, 26% chance of damaging wind over 30y; extreme-heat days projected 7→16/yr by 2055 (HVAC capex compounding) — expect insurance premiums to compound above CPI over the hold.
Questions for the listing agent
- Can we see the unit-by-unit rent roll, current vacancy, and any below-market leases? What's the average tenancy length?
- What capital expenditures (roof, boiler, parking lot, exteriors) have been made in the last 5 years, and what's planned in the next 2?
- Have any recent inspections been done? Can we get a copy of the seller's disclosures and any deferred-maintenance estimates?
- Built in 1898 — when were the roof, HVAC, electrical panel, plumbing, and water heater last replaced?
- Is there a deadline driving the sale (1031 exchange, divorce, estate, relocation)? That informs how much negotiation room exists.
- Schools are D-rated, which usually means shorter tenancies and higher turnover. Who's the typical renter profile here, and what's been the actual vacancy rate?
- Crime grade is F in this area — have there been break-ins, vandalism, or insurance claims at this property in the last 3 years? What carrier currently insures it and at what premium?
- What's the average days-on-market for RENTAL listings here right now (not sales)? A rising rental-DOM trend means longer vacancies and softer asking-rent achievability than the comps imply.
- What's the recent tenant-quality profile in this submarket — average credit score on applications, eviction rate, late-payment / NSF rate, and stable-employment percentage? A property-management company in the area should have these aggregated.
- How much new apartment / multifamily construction is in the pipeline within 1–3 miles? Heavy new supply (>2% of stock underway) typically softens rents 12–24 months out; light construction supports rent growth.
Investment metrics
- 1% rule
- 1.38% ✓
- Cap rate
- 11.07%
- Cash-on-cash
- 17.05%
- DSCR
- 1.76
- GRM
- 6.0
CMA / ARV
- ARV (on-the-fly)
- $430,500
- Comps found
- 12
Show comp detail 12 sales within ~0.75 mi
| Address | Dist | Beds/Ba | Sqft | Sold | Price | $/sf | Match |
|---|---|---|---|---|---|---|---|
| 708-710 Carew St | 0.19mi | 8/3.0 (-1) | 2,772 (-10%) | 2mo | $415,000 | $150 | 68 |
| 9 Murray Hill Ave | 0.54mi | 9/3.0 | 3,170 (+3%) | 3mo | $410,000 | $129 | 67 |
| 75-77 Mooreland St | 0.23mi | 9/3.0 | 3,366 (+10%) | 8mo | $355,000 | $105 | 67 |
| 44-46 Hastings St | 0.36mi | 8/2.0 (-1) | 3,035 (-1%) | 7mo | $374,300 | $123 | 66 |
| 744-746 Carew St | 0.25mi | 9/3.0 | 3,474 (+13%) | 3mo | $515,000 | $148 | 64 |
| 404-406 Franklin St | 0.43mi | 9/3.0 | 3,213 (+4%) | 11mo | $425,000 | $132 | 64 |
| 731-733 Carew St | 0.23mi | 8/3.0 (-1) | 3,364 (+9%) | 9mo | $515,000 | $153 | 61 |
| 42-44 Narragansett St | 0.62mi | 8/3.0 (-1) | 3,040 (-1%) | 8mo | $467,000 | $154 | 58 |
| 797 Carew St | 0.35mi | 10/3.0 (+1) | 3,400 (+11%) | 4mo | $442,000 | $130 | 58 |
| 133 Massasoit St | 0.65mi | 8/4.0 (-1) | 3,111 (+1%) | 8mo | $475,000 | $153 | 52 |
| 49 Prospect St | 0.67mi | 9/3.0 | 3,258 (+6%) | 9mo | $455,000 | $140 | 51 |
| 211-213 Chapin Ter | 0.46mi | 8/3.0 (-1) | 3,475 (+13%) | 2mo | $450,000 | $129 | 50 |
Match score weights: distance 35% · size 25% · config 20% · recency 20%. Top-matched comps best support the ARV.
Projected returns pro-forma
-3.0% appreciation · 3.0% rent growth · sell at horizon
- IRR
- 8.3%
- Equity multiple
- 1.33×
- Total profit
- $36,184
- Equity at exit
- $58,896
- IRR
- 17.6%
- Equity multiple
- 2.45×
- Total profit
- $160,747
- Equity at exit
- $34,152
Cash invested: $110,600 (down + closing). Projections, not guarantees.
Landlord ↔ Tenant lean methodology
- Overall (STATE)
- 20 Strongly Tenant-Friendly
- State Massachusetts
- 20 Strongly Tenant-Friendly · D+15
- County
- — inherits STATE
- City
- — inherits STATE
ZIP-level market 01104
- Home prices YoY
- -21.1%
- Active inventory
- 23
- Price-to-rent
- 18.1×
Monthly cashflow live
- Estimated rent
- $5,445 high interval (Pro) →
- Mortgage (P&I)
- −$2,071
- Tax est. 1.5%
- −$494 /mo · $5,925/yr
- Insurance
- −$165
- HOA
- −$0
- Vacancy / Maint / Mgmt
- −$1,143
- Net cashflow
- $1,572
Break-even live
Sensitivity live
| Price | -10% $1,845 | -5% $1,708 | +0% $1,572 | +5% $1,435 | +10% $1,299 |
|---|---|---|---|---|---|
| Rent | -10% $1,142 | -5% $1,357 | +0% $1,572 | +5% $1,787 | +10% $2,002 |
| Rate | -1.0pp $1,771 | -0.5pp $1,672 | base $1,572 | +0.5pp $1,469 | +1.0pp $1,365 |
3-unit breakdown (identical units grouped — click to expand)
| Units | Beds | Baths | Est. rent |
|---|---|---|---|
| 3× units | 3 | — | $5,445 |
| #1 | 3 | — | $1,815 |
| #2 | 3 | — | $1,815 |
| #3 | 3 | — | $1,815 |
| Total (3 units) | $5,445 | ||
UW: 25.0% down · 7.5% · 30yr · 1.5% tax · 5.0% vac · 8.0% maint · 8.0% mgmt
Financing live
Cash to close
- Down payment
- $98,750
- Closing costs
- $11,850
- Reserves months
- —
- Total cash needed
- —
Loan-product check · same deal, 3 products live
Conventional
25% down · 7.5% · 30yr
- Down + closing
- —
- Monthly P&I
- —
- Monthly cashflow
- —
- DSCR
- —
- Eligible?
- —
Personal DTI + credit; lowest rate.
DSCR
20% down · 8.5% · 30yr
- Down + closing
- —
- Monthly P&I
- —
- Monthly cashflow
- —
- DSCR
- —
- Eligible?
- —
No personal income docs; deal must DSCR.
Hard money
10% down · 12.0% · 12mo
- Down + closing
- —
- Monthly P&I
- —
- Monthly cashflow
- —
- DSCR
- —
- Eligible?
- —
Short-term bridge; refi at stabilization.
Listing history 12 events
-
2026-06-18days on market $395,000 Active 14 DOM
-
2026-06-17days on market $395,000 Active 13 DOM
-
2026-06-16days on market $395,000 Active 12 DOM
-
2026-06-15days on market $395,000 Active 11 DOM
-
2026-06-14days on market $395,000 Active 9 DOM
-
2026-06-13days on market $395,000 Active 8 DOM
-
2026-06-10days on market $395,000 Active 6 DOM
-
2026-06-09days on market $395,000 Active 5 DOM
-
2026-06-08statusdays on market $395,000 Active 4 DOM
-
2026-06-07days on market $395,000 New 3 DOM
-
2026-06-05remarks 667-char remark
-
2026-06-05$395,000 New 1 DOM
ⓘ Source: listings_history table (triggers on properties + properties_extension) + one-shot
backfill from property_details.listing_events for pre-trigger history.
Climate risk First Street
- Flood 1/10 Low FEMA zone X (unshaded) · 0% chance over 30 yrs
- Wildfire 1/10 Low
- Heat 5/10 Major 7 d/yr ≥99°F today · 16 d/yr by 30 yrs out
- Wind 5/10 Major 26% chance of damaging wind over 30 yrs
- Air quality 2/10 Low 1 unhealthy d/yr today · 2 by 30 yrs out
Nearby sold comps map
Loading sold comps map…
Walkable amenities ~0.75 mi
Loading nearby amenities…
Taxation est. · year 1
- Rental income
- $65,340
- − Mortgage interest
- −$22,126
- − Property taxes
- −$5,925
- − Insurance
- −$1,975
- − Repairs & maintenance
- −$5,227
- − Management
- −$5,227
- − Depreciation
- −$11,491
- Taxable income
- $13,369
- Est. tax owed @ 24.0%
- −$3,208
- After-tax cash flow
- $15,653/yr
For passive investors: Depreciation is non-cash, so a rental often shows a tax loss while cash-flowing — sheltering income. Rental losses are passive: they offset passive income freely, and up to $25,000/yr can offset ordinary (W-2) income if you actively participate and your MAGI is under $100k (phasing out to $0 by $150k); unused losses carry forward. On sale, claimed depreciation is recaptured at up to 25%, and gains may owe capital-gains tax (a 1031 exchange can defer both). Figures are a year-1 estimate at your 24.0% rate — not tax advice; consult a CPA.
Condition & rehab AI · 9 photos
This three-family investment property requires moderate repairs and maintenance to improve its condition and value. Key areas for improvement include kitchen and bathroom organization, flooring replacement, and paint touch-up or repainting. The home is located in a good neighborhood with good curb appeal, making it a solid investment opportunity.
Repairs flagged
- Minor Kitchen organization — Cluttered countertops and shelves indicate disorganization.
- Minor Bathroom organization — Disorganized sink and counter indicate need for cleaning and organization.
- Moderate Flooring — Worn carpet in living room and bedrooms suggests need for replacement or cleaning.
- Moderate Paint — Chipped and worn paint in some areas indicates need for touch-up or repainting.
Value-add opportunities
- Both Kitchen organization — A clutter-free kitchen can improve both resale and rental value by making the space more appealing.
- Both Bathroom organization — A tidy bathroom enhances the overall appeal and can attract more tenants or buyers.
- Both Flooring replacement — Replacing worn carpet with new flooring can significantly improve the home's appearance and value.
- Both Paint touch-up or repainting — Fresh paint can make the home look more inviting and can increase its value.
Renovation cost estimate screening
| Repair item | Severity | Est. cost |
|---|---|---|
| Kitchen organization · Cluttered countertops and shelves indicate disorganization. | Minor | $500–3,000 |
| Bathroom organization · Disorganized sink and counter indicate need for cleaning and organization. | Minor | $500–3,000 |
| Flooring · Worn carpet in living room and bedrooms suggests need for replacement or cleaning. | Moderate | $3,000–15,000 |
| Paint · Chipped and worn paint in some areas indicates need for touch-up or repainting. | Moderate | $3,000–15,000 |
| Total estimated repair cost · 4 items | $7,000–36,000 |
Value-add ROI direction
- Both Kitchen organization — A clutter-free kitchen can improve both resale and rental value by making the space more appealing. ↑
- Both Bathroom organization — A tidy bathroom enhances the overall appeal and can attract more tenants or buyers. ↑
- Both Flooring replacement — Replacing worn carpet with new flooring can significantly improve the home's appearance and value. ↑
- Both Paint touch-up or repainting — Fresh paint can make the home look more inviting and can increase its value. ↑
ⓘ Cost ranges are severity-bucket heuristics (US national rule-of-thumb). Get contractor quotes + a written scope before underwriting a rehab budget.
Schools (NCES district)
- District
- Springfield
- NCES district ID
- 2511130
- Math proficiency
- 13% ▼ -12.00%
- Reading proficiency
- 25% ▼ -5.00%
- Median HH income
- $34,938
- Composite
- 15.6/100
- National rank
- #9293
- State rank
- #296 of 302 in MA
Livability — Springfield
- Score
- 73/100
- State rank
- #97
- US rank
- #5195
Category grades
Schools grade is shown separately in the Schools card above.
Census & demographics
- Census place
- Springfield, MA
- City population
- 61,006
- Population (ZIP)
- 21,745
Population outlook (Hampden County) Hauer SSP2
- Today (2025)
- 485,646 people
- By 2030
- 491,517 · +1.2%
- By 2040
- 500,539 · +3.1%
- By 2050
- 508,827 · +4.8%
- By 2075
- 539,167 · +11.0%
- By 2100
- 545,698 · +12.4%
Race, ethnicity, and origin ACS 2023
- Neighborhood character
- Diverse neighborhood (Simpson 0.56)
- Race & ethnicity
- Hispanic / Latino 60% Two or more races 35% White 25% Black 13% Asian 1%
- Hispanic origin (detail)
- Mexican 1% Puerto Rican 48% Dominican 4%
- Common ancestry
- Lithuanian 3% Romanian 2% Hispanic 1%
- Foreign-born
- 9% · Canada, China
- Languages at home
- 50% English-only · Spanish 45% French/Haitian/Cajun 1% Chinese 1%
Political lean MEDSL · Hampden
- 2024 margin
- Lean D (+8.9) · D 53.4% · R 44.5% · Other 2.1%
- 2008→2024 swing
- -16.4pp toward R · 2008: 25.3pp · 2024: 8.9pp
- All cycles
- 2024: D+8.9 2020: D+17.7 2016: D+16.0 2012: D+25.4 2008: D+25.3
Not yet ingested
- Civics
- —
Market trends
- HPI YoY
- ▼ -99.49%
- Current HPI
- 371.3425
- Rent YoY
- —
- Metro
- —
- State GDP YoY
- ▲ 2.28%
- F500 in state
- 38
Industry mix (Fortune 500 HQ in MA)
| Industry | F500 HQs | Revenue |
|---|---|---|
| Technology | 3 | $17B |
|
||
| Insurance | 2 | $84B |
|
||
| Retail | 2 | $76B |
|
||
| Life Sciences | 1 | $43B |
|
||
| Energy Technology | 1 | $31B |
|
||
| Aerospace / Defense | 1 | $18B |
|
||
Price history
+119.6% since first listed3 events — show timeline
- 2026-06-04 Listed $395,000 MLS PIN
- 2021-02-11 Sold (MLS) $175,000 MLS PIN
- 2020-10-07 Listed $179,900 MLS PIN
Cash-flow waterfall
monthlySold comps — $/sqft
last 12 mo · ≤1 miLoading sold comps…