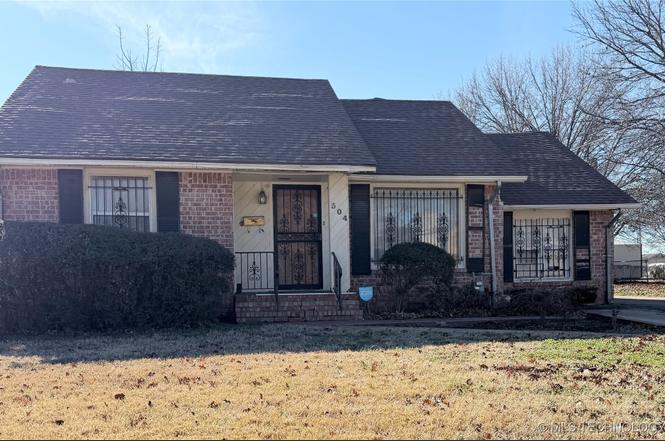
304 E Woodrow Pl · Tulsa, OK
Flood risk 1/10 · Minimal
- FEMA flood zone
- X (unshaded)
- Chance of flooding over 30 yrs
- 0.0%
- Est. flood insurance / yr
- $507 – $1,088
Fire risk 5/10 · Moderate
- Est. fire insurance / yr
- $2,463 – $4,575
Heat risk 6/10 · Moderate
- Hot days now (above 110°F)
- 7 days/yr
- Hot days in 30 yrs
- 18 days/yr
Wind risk 3/10 · Minor
- Chance of severe wind over 30 yrs
- 4.0%
Air-quality risk 2/10 · Minimal
- Unhealthy air days now
- 2 days/yr
- Unhealthy air days in 30 yrs
- 2 days/yr
Risk factors via First Street. Map © Google.
Why this score? — see what drove the C grade
The composite is a weighted blend of 9 inputs, each scored 0–100. Each bar is that input's sub-score; the figure is the points it added to the 100-point composite (weight × sub-score).
- Cash flow +20.1/30.0
- ARV discount +13.6/15.0
- DSCR +6.4/10.0
- 1% rule +4.1/10.0
- Livability +3.8/5.0
- Rent growth +3.4/5.0
- Appreciation +2.7/10.0
- Condition / age +2.5/5.0
- Schools +0.8/10.0
$180,000
🖨 Deal sheet (PDF) 📄 Offer letter ✓ Due diligence
Listing remarks
This lovely home is situated in a peaceful neighborhood, just 1.5 miles from downtown Tulsa, offering quick access to the vibrant Historical Greenwood District, Gilcrease Museum, Driller Park, and a variety of popular restaurants and shops. The property features an extra? Large lot with mature fruit trees, providing plenty of space to relax, garden, or entertain. A huge covered patio deck and a beautiful gazebo create the perfect outdoor retreat for gatherings or quiet evenings at home. A great blend of convenience, comfort, and outdoor living? This home is a must-see.
Key facts
- Mature fruit trees
- Beautiful gazebo
- Extra large lot
Tags
Property features AI
Exterior
- Parking: Detached garage; 2-car garage
- Security: Smoke detector(s); No safety shelter
- Utilities: Electricity available; Natural gas available; High-speed internet available; Public water; Public sewer
- Home design: Single-story; Faces north; Crawlspace foundation
- Construction: Brick and wood frame construction; Asphalt/fiberglass roof; Crawlspace foundation; Built (year per public records)
- Exterior features: Covered patio; Deck; Patio; Shed(s); Gazebo; Partial fencing; Smoke detectors
Interior
- Kitchen: Eat-in kitchen; Dishwasher; Disposal; Icemaker; Microwave; Oven/Range/Stove; Refrigerator; Trash compactor
- Bedrooms: Multiple bedrooms on the first floor; Master bedroom on the first floor (no attached bath); Additional bedrooms on the first floor (no attached baths)
- Flooring: Carpet; Hardwood
- Bathrooms: Two full bathrooms; Hall full bathroom
- Heating & cooling: Central heating (gas); Central air conditioning; Has fireplace (wood burning)
- Interior features: Ceiling fans; Laminate countertops; Wood window frames
- Laundry & utility: Washer hookup; Electric dryer hookup; Gas dryer hookup; Inside utility room
Neighborhood map
What this means for you Summary
Snapshot
- This is a 3-bed/2.0-bath single-family listed at $180k.
Deal economics
- At list price, monthly cash flow is $223 ($3k/yr) — positive.
- The deal already cash-flows at list — no discount required.
- To meet the 1% rule (rent ≥ 1% of price), the offer needs to be $163k (9.3% below list).
- Recommended offer: $158k (12.0% below list) — sets the bar for market timing.
- Cap rate 7.8% vs local median 3.8% in Tulsa — top-decile yield for the area; either an underpriced asset or a hidden risk that comps aren't pricing in. Stress-test before assuming the spread holds.
Location & tenants
- Location reads 75/100 on livability (#13 in OK, #4,058 nationally) — a middle-class / working-renter tenant base. Strengths: amenities A+, commute A+, cost of living A+; Watch: crime F, employment D-.
- Tulsa (urban): math 7% / reading 12% proficiency, ranked #250 of 270 in OK (top 93%) — low school quality limits family demand, transient renter base, plan for 1-2y turnover; 76% free/reduced lunch — lower-income household profile, screen leases tightly.
- Zoned schools: Project Accept Traice Es (math 10% / reading 10%, grade F, #695 of 845 statewide, top 84%, 558 students, 0% FRL); Monroe Demonstration Ms (math 0% / reading 2%, grade F, #344 of 345 statewide, top 100%, 688 students, 0% FRL); Booker T. Washington Hs (math 41% / reading 61%, grade D+, #2 of 447 statewide, top 0%, 1,280 students, 0% FRL) — zoned schools average 0% FRL vs 76% district-wide (76 pts lower); this property's tenant base skews higher-income than the district average.
- Market conditions: Rents rising (+3.5%/yr); 137 active listings in the ZIP; 8 comparable units currently listed for rent nearby; rentals at typical pace (median 25d on market — plan ~3-4 weeks tenant-placement turnaround); lower-income renter base — watch delinquency; 2,818 units permitted in Tulsa County in 2024 (518 in 5+ unit buildings).
- At $1,633/mo this rent would consume 48% of the median local household income ($41k/yr) (locally 1055% of renters already pay >50% of income on rent) — very limited rent-growth headroom before tenants either downsize or default.
Forward outlook
- Local home prices are declining (-3.0%/yr); year-one equity from $1k of loan paydown is wiped out by about $5k of value loss. Plan a longer hold.
- Tulsa County population projected at +30% by 2050 — long-run rental-demand tailwind backs the buy-and-hold thesis.
Negotiation context
- It's been on market 152 days — a 12% lower offer ($158k) is reasonable based on typical stale-listing flexibility.
Risks & watch-outs
- Watch-outs: built in 1940 — expect roof / HVAC / electrical / plumbing capex.
- Climate carrying-cost: moderate wildfire risk; extreme-heat days projected 7→18/yr by 2055 (HVAC capex compounding) — expect insurance premiums to compound above CPI over the hold.
Questions for the listing agent
- It's been on market 152 days. Have you received any prior offers? Is the seller open to a 12% concession, seller financing, or rate buy-down credit?
- Built in 1940 — when were the roof, HVAC, electrical panel, plumbing, and water heater last replaced?
- Why hasn't it sold? Are there any deal-killer items the seller is aware of (foundation, flood, title, zoning, code violations)?
- Is there a deadline driving the sale (1031 exchange, divorce, estate, relocation)? That informs how much negotiation room exists.
- Schools are F-rated, which usually means shorter tenancies and higher turnover. Who's the typical renter profile here, and what's been the actual vacancy rate?
- Crime grade is F in this area — have there been break-ins, vandalism, or insurance claims at this property in the last 3 years? What carrier currently insures it and at what premium?
- What's the average days-on-market for RENTAL listings here right now (not sales)? A rising rental-DOM trend means longer vacancies and softer asking-rent achievability than the comps imply.
- What's the recent tenant-quality profile in this submarket — average credit score on applications, eviction rate, late-payment / NSF rate, and stable-employment percentage? A property-management company in the area should have these aggregated.
- How much new for-sale + rental construction is in the pipeline within 1–3 miles? Heavy new supply typically softens prices + rents 12–24 months out; constrained supply supports both.
Investment metrics
- 1% rule
- 0.91% ✗
- Cap rate
- 7.78%
- Cash-on-cash
- 5.31%
- DSCR
- 1.24
- GRM
- 9.2
CMA / ARV
- ARV (on-the-fly)
- $208,104
- Comps found
- 12
Show comp detail 12 sales within ~0.75 mi
| Address | Dist | Beds/Ba | Sqft | Sold | Price | $/sf | Match |
|---|---|---|---|---|---|---|---|
| 219 E Woodrow Pl | 0.09mi | 3/2.0 | 1,426 (-5%) | 8mo | $270,000 | $189 | 80 |
| 256 E Tecumseh St | 0.28mi | 3/2.5 | 1,533 (+2%) | 12mo | $235,000 | $153 | 73 |
| 2511 N Boston Ave | 0.38mi | 3/1.5 | 1,454 (-4%) | 2mo | $155,510 | $107 | 72 |
| 2317 N Frankfort Ave | 0.18mi | 4/2.0 (+1) | 1,400 (-7%) | 4mo | $195,000 | $139 | 72 |
| 2503 N Boston Pl | 0.33mi | 3/1.0 | 1,397 (-7%) | 7mo | $130,000 | $93 | 63 |
| 430 E Seminole Pl | 0.36mi | 3/2.0 | 1,654 (+10%) | 9mo | $210,000 | $127 | 60 |
| 2020 N Madison Pl | 0.68mi | 3/2.0 | 1,521 (+1%) | 9mo | $192,500 | $127 | 60 |
| 2124 N Norfolk Ave | 0.73mi | 3/2.0 | 1,614 (+7%) | 3mo | $200,000 | $124 | 51 |
| 776 E Seminole Pl | 0.64mi | 3/2.0 | 1,316 (-13%) | 0mo | $182,000 | $138 | 48 |
| 1546 N Denver Ave | 0.69mi | 2/1.0 (-1) | 1,498 (-1%) | 11mo | $215,000 | $144 | 48 |
| 2540 N Madison Ave E | 0.72mi | 2/1.0 (-1) | 1,480 (-2%) | 10mo | $78,000 | $53 | 46 |
| 332 E 27th Pl N | 0.52mi | 4/3.0 (+1) | 1,360 (-10%) | 10mo | $215,000 | $158 | 42 |
Match score weights: distance 35% · size 25% · config 20% · recency 20%. Top-matched comps best support the ARV.
Projected returns pro-forma
-3.0% appreciation · 3.54% rent growth · sell at horizon
- IRR
- -7.6%
- Equity multiple
- 0.72×
- Total profit
- $-14,161
- Equity at exit
- $26,839
- IRR
- 2.5%
- Equity multiple
- 1.18×
- Total profit
- $9,312
- Equity at exit
- $15,563
Cash invested: $50,400 (down + closing). Projections, not guarantees.
Landlord ↔ Tenant lean methodology
- Overall (STATE)
- 83 Strongly Landlord-Friendly
- State Oklahoma
- 83 Strongly Landlord-Friendly · R+20
- County
- — inherits STATE
- City
- — inherits STATE
ZIP-level market 74106
- Home prices YoY
- -2.5%
- Rents YoY
- 3.5%
- Active inventory
- 137
- Price-to-rent
- 9.2×
Monthly cashflow live
- Estimated rent
- $1,633 high interval (Pro) →
- Mortgage (P&I)
- −$944
- Tax from tax record
- −$48 /mo · $578/yr
- Insurance
- −$75
- HOA
- −$0
- Vacancy / Maint / Mgmt
- −$343
- Net cashflow
- $223
Break-even live
Sensitivity live
| Price | -10% $325 | -5% $274 | +0% $223 | +5% $172 | +10% $121 |
|---|---|---|---|---|---|
| Rent | -10% $94 | -5% $158 | +0% $223 | +5% $287 | +10% $352 |
| Rate | -1.0pp $314 | -0.5pp $269 | base $223 | +0.5pp $176 | +1.0pp $129 |
UW: 25.0% down · 7.5% · 30yr · 1.5% tax · 5.0% vac · 8.0% maint · 8.0% mgmt
Financing live
Cash to close
- Down payment
- $45,000
- Closing costs
- $5,400
- Reserves months
- —
- Total cash needed
- —
Loan-product check · same deal, 3 products live
Conventional
25% down · 7.5% · 30yr
- Down + closing
- —
- Monthly P&I
- —
- Monthly cashflow
- —
- DSCR
- —
- Eligible?
- —
Personal DTI + credit; lowest rate.
DSCR
20% down · 8.5% · 30yr
- Down + closing
- —
- Monthly P&I
- —
- Monthly cashflow
- —
- DSCR
- —
- Eligible?
- —
No personal income docs; deal must DSCR.
Hard money
10% down · 12.0% · 12mo
- Down + closing
- —
- Monthly P&I
- —
- Monthly cashflow
- —
- DSCR
- —
- Eligible?
- —
Short-term bridge; refi at stabilization.
Rent comps 8 comps
| Address | Beds | Baths | Sqft | Rent | $/sqft | DOM | Units | Dist |
|---|---|---|---|---|---|---|---|---|
| 313 E Woodrow Pl Tulsa, OK | 4.0 | 2.0 | 1747 | $1,640 | $0.94 | 23d | 1 | 0.02mi |
| 245 E Young Pl Tulsa, OK | 3.0 | 2.0 | 1528 | $1,450 | $0.95 | 17d | 1 | 0.21mi |
| 230 E Zion St Tulsa, OK | 4.0 | 2.0 | 1857 | $1,650 | $0.89 | 25d | 1 | 0.24mi |
| 205 E Marshall St Tulsa, OK | 3.0 | 2.0 | 1452 | $1,725 | $1.19 | 25d | 1 | 0.99mi |
| 3120 N Hartford Pl Tulsa, OK | 4.0 | 1.0 | 1176 | $1,500 | $1.28 | 5d | 1 | 1.00mi |
| 1152 N Boston Pl Tulsa, OK | 4.0 | 2.0 | 1756 | $2,550 | $1.45 | 25d | 1 | 1.08mi |
| 1127 N Boston Ave Tulsa, OK | 4.0 | 2.0 | 1745 | $2,275 | $1.30 | 25d | 1 | 1.14mi |
| 1008 E King Pl Tulsa, OK | 3.0 | 1.0 | 1284 | $1,295 | $1.01 | 3d | 1 | 1.38mi |
Listing history 17 events
-
2026-06-22days on market $180,000 Active 152 DOM
-
2026-06-18days on market $180,000 Active 149 DOM
-
2026-06-17days on market $180,000 Active 148 DOM
-
2026-06-16days on market $180,000 Active 147 DOM
-
2026-06-15days on market $180,000 Active 146 DOM
-
2026-06-13days on market $180,000 Active 144 DOM
-
2026-06-10days on market $180,000 Active 141 DOM
-
2026-06-09days on market $180,000 Active 140 DOM
-
2026-06-08days on market $180,000 Active 139 DOM
-
2026-06-07days on market $180,000 Active 138 DOM
-
2026-06-05days on market $180,000 Active 135 DOM
-
2026-06-03days on market $180,000 Active 134 DOM
-
2026-06-02days on market $180,000 Active 133 DOM
-
2026-06-01days on market $180,000 Active 132 DOM
-
2026-05-31days on market $180,000 Active 131 DOM
-
2026-03-27price $180,000
-
2026-01-16$199,900 Active
ⓘ Source: listings_history table (triggers on properties + properties_extension) + one-shot
backfill from property_details.listing_events for pre-trigger history.
Tax reassessment forecast OK · Resets to sale price
- Current annual tax
- $578 · $48/mo
- Projected year-2 tax
- $1,620 · $135/mo
- Expected delta
- +$1,042/yr (+$87/mo · 180.3%)
ⓘ Screening estimate from a state-policy table — verify with the county assessor before closing.
Climate risk First Street
- Flood 1/10 Low FEMA zone X (unshaded) · 0% chance over 30 yrs
- Wildfire 5/10 Major
- Heat 6/10 Major 7 d/yr ≥110°F today · 18 d/yr by 30 yrs out
- Wind 3/10 Moderate 4% chance of damaging wind over 30 yrs
- Air quality 2/10 Low 2 unhealthy d/yr today · 2 by 30 yrs out
Nearby sold comps map
Loading sold comps map…
Walkable amenities ~0.75 mi
Loading nearby amenities…
Taxation est. · year 1
- Rental income
- $19,596
- − Mortgage interest
- −$10,083
- − Property taxes
- −$578
- − Insurance
- −$900
- − Repairs & maintenance
- −$1,568
- − Management
- −$1,568
- − Depreciation
- −$5,236
- Taxable loss
- −$337
- Est. tax savings @ 24.0%
- +$81
- After-tax cash flow
- $2,756/yr
For passive investors: Depreciation is non-cash, so a rental often shows a tax loss while cash-flowing — sheltering income. Rental losses are passive: they offset passive income freely, and up to $25,000/yr can offset ordinary (W-2) income if you actively participate and your MAGI is under $100k (phasing out to $0 by $150k); unused losses carry forward. On sale, claimed depreciation is recaptured at up to 25%, and gains may owe capital-gains tax (a 1031 exchange can defer both). Figures are a year-1 estimate at your 24.0% rate — not tax advice; consult a CPA.
Schools (NCES district)
- District
- Tulsa
- NCES district ID
- 4030240
- Math proficiency
- 7% ▼ -9.00%
- Reading proficiency
- 12% ▼ -7.00%
- Median HH income
- $37,895
- Composite
- 8.04/100
- National rank
- #9919
- State rank
- #250 of 270 in OK
Livability — Tulsa
- Score
- 75/100
- State rank
- #13
- US rank
- #4058
Category grades
Schools grade is shown separately in the Schools card above.
Census & demographics
- Census place
- Tulsa, OK
- County
- Tulsa County · 640,811 people
- City population
- 389,418
- Metro
- Tulsa, OK
- Population (ZIP)
- 15,655
- Household income
- $40,776
- Rent vs Own
- Severe rent burden
- 1055.0
Population outlook (Tulsa County) Hauer SSP2
- Today (2025)
- 723,846 people
- By 2030
- 766,033 · +5.8%
- By 2040
- 851,386 · +17.6%
- By 2050
- 938,389 · +29.6%
- By 2075
- 1,166,011 · +61.1%
- By 2100
- 1,350,277 · +86.5%
Race, ethnicity, and origin ACS 2023
- Neighborhood character
- Diverse neighborhood (Simpson 0.65)
- Race & ethnicity
- Black 55% White 17% Hispanic / Latino 14% Two or more races 13% Native American 4%
- Hispanic origin (detail)
- Mexican 11%
- Common ancestry
- Romanian 1% Serbian 1% Lithuanian 1%
- Foreign-born
- 5% · Canada
- Languages at home
- 87% English-only · Spanish 10% German/W. Germanic 1%
Political lean MEDSL · Tulsa
- 2024 margin
- R (+15.2) · D 41.3% · R 56.5% · Other 2.2%
- 2008→2024 swing
- +9.2pp toward D · 2008: -24.5pp · 2024: -15.2pp
- All cycles
- 2024: R+15.2 2020: R+15.6 2016: R+22.9 2012: R+27.4 2008: R+24.5
Not yet ingested
- Civics
- —
Market trends
- HPI YoY
- ▼ -4.58%
- Current HPI
- 179.5268
- Rent YoY
- ▲ 3.54%
- Metro
- Tulsa, OK
- State GDP YoY
- ▲ 1.55%
- F500 in state
- 6
Industry mix (Fortune 500 HQ in OK)
| Industry | F500 HQs | Revenue |
|---|---|---|
| Energy | 3 | $48B |
|
||
Price history
-10.0% since first listed2 events — show timeline
- 2026-03-27 Price Changed $180,000 MLS Technology, Inc.
- 2026-01-16 Listed $199,900 MLS Technology, Inc.
Property tax history
-2.8%/yrLatest (2025): $578 · +3.4% YoY. Source: county tax records.
Cash-flow waterfall
monthlySold comps — $/sqft
last 12 mo · ≤1 miLoading sold comps…