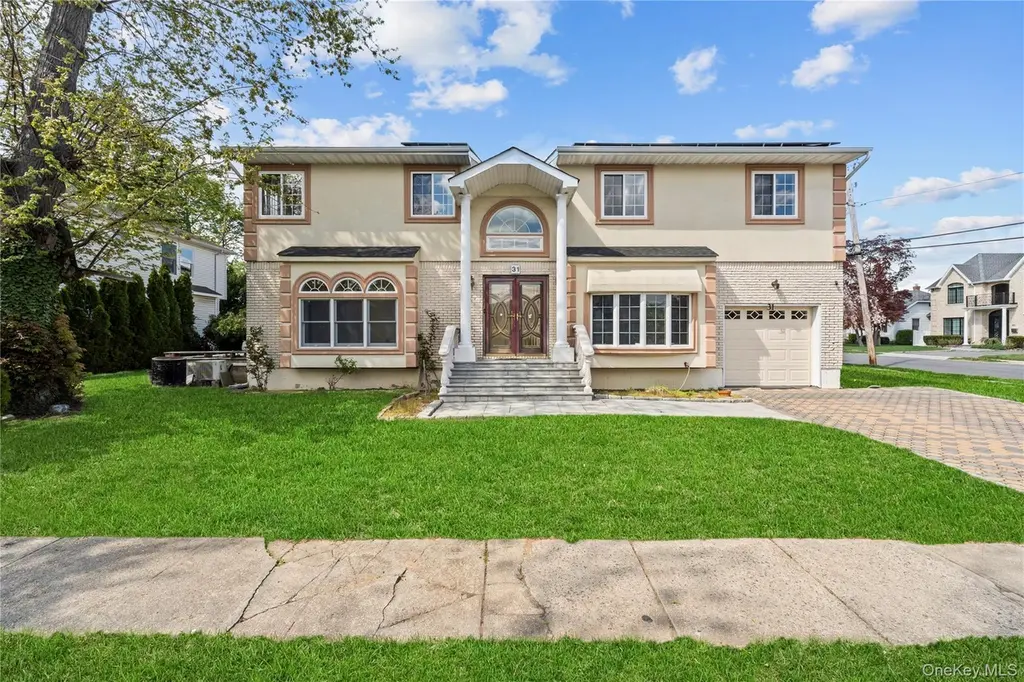
31 Woodward St · Roslyn Heights, NY
Flood risk 1/10 · Minimal
- FEMA flood zone
- X (unshaded)
- Chance of flooding over 30 yrs
- 0.0%
- Est. flood insurance / yr
- $473 – $860
Fire risk 1/10 · Minimal
- Est. fire insurance / yr
- $691 – $1,283
Heat risk 6/10 · Moderate
- Hot days now (above 98°F)
- 7 days/yr
- Hot days in 30 yrs
- 16 days/yr
Wind risk 6/10 · Moderate
- Chance of severe wind over 30 yrs
- 53.0%
Air-quality risk 4/10 · Minor
- Unhealthy air days now
- 6 days/yr
- Unhealthy air days in 30 yrs
- 7 days/yr
Risk factors via First Street. Map © Google.
Why this score? — see what drove the D+ grade
The composite is a weighted blend of 9 inputs, each scored 0–100. Each bar is that input's sub-score; the figure is the points it added to the 100-point composite (weight × sub-score).
- ARV discount +13.9/15.0
- Cash flow +11.9/30.0
- Schools +7.7/10.0
- Livability +4.0/5.0
- DSCR +3.5/10.0
- 1% rule +3.3/10.0
- Rent growth +2.5/5.0
- Condition / age +2.5/5.0
- Appreciation +0.0/10.0
$1,448,000
🖨 Deal sheet (PDF) 📄 Offer letter ✓ Due diligence
Listing remarks MLS
IMPRESSIVE MODERN 4 BEDROOM COLONIAL PRIVATELY LOCATED ON ONE THE NICEST BLOCK IN ROSLYN HEIGHTS. OFFERING 4 LARGE BEDROOMS, SPACIOUS LIVING ROOM, FAMILY ROOM WITH FIREPLACE AND DINING ROOM, BEAUTIFUL WOOD FLOORS THROUGHOUT. THIS PROPERTY IS CLOSE TO ALL PUBLIC TRANSPORTATION, PARKS, STORS, BEACHES, HOSPITALS, HIGHWAYS QUICK ACCESS AND RESTAURANTS. GREAT VALUE.
Key facts
- Double vanity
- Ample natural light
- Finished basement
Tags
Property features AI
Exterior
- Parking: Detached carport for 2 cars; 1-car garage; Driveway (total 3 parking spaces)
- Utilities: Public sewer; Electricity available; Natural gas available
- Home design: Single family residence
- Construction: Brick and stucco construction
- Exterior features: Brick and stucco exterior; Not waterfront
Interior
- Kitchen: Dishwasher; Exhaust fan; Gas cooktop; Gas oven; Stainless steel appliances
- Bedrooms: Total rooms: 12
- Bathrooms: 3 full bathrooms; 1 half bathroom
- Heating & cooling: Baseboard heating; Ductless cooling
- Interior features: Central vacuum; Chandelier; Chef's kitchen; Double vanity; Entrance foyer; Formal dining; Granite counters; High ceilings; Kitchen island; Full basement; Crawl attic
Neighborhood map
What this means for you Summary
Snapshot
- This is a 4-bed/2.5-bath single-family listed at $1.45M.
Deal economics
- At list price, monthly cash flow is $-360 ($-4k/yr) — negative.
- To cash-flow at today's rent, offer at most $1.38M (4.4% below list).
- To meet the 1% rule (rent ≥ 1% of price), the offer needs to be $1.20M (17.1% below list).
- Recommended offer: $1.20M (17.1% below list) — sets the bar for 1% rule.
Location & tenants
- Location reads 81/100 on livability (#98 in NY, #1,499 nationally) — a professional / high-income tenant draw. Strengths: crime A+, commute A+, employment A+; Watch: amenities D+, cost of living F.
- Roslyn Union Free School District (suburban): math 83% / reading 82% proficiency, ranked #28 of 590 in NY (top 5%) — strong family-tenant draw, lease renewals of 3-5y typical; only 8% free/reduced lunch — higher-income household profile.
- Zoned schools: Roslyn Heights Elementary School (345 students, 20% FRL); Roslyn Middle School (math 78% / reading 82%, grade A+, #28 of 729 statewide, top 4%, 766 students, 16% FRL); Roslyn High School (math 97% / reading 87%, grade A+, #171 of 1,100 statewide, top 18%, 1,035 students, 15% FRL).
- Market conditions: 71 active listings in the ZIP; 1 comparable units currently listed for rent nearby; 824 units permitted in Nassau County in 2024 (153 in 5+ unit buildings).
Forward outlook
- Local home prices are declining (-3.0%/yr); year-one equity from $10k of loan paydown is wiped out by about $43k of value loss. Plan a longer hold.
- Nassau County population projected at +7% by 2050 — modest demand growth; plan on rents tracking national, not racing it.
Negotiation context
- It's been on market 59 days — a 3% lower offer ($1.40M) is reasonable based on typical stale-listing flexibility.
- 3 sale attempts with the ask held roughly flat each time — persistent listings suggest the price (not the market) is what's stuck; bring a comps-based counter.
- Current owner paid $1.25M; 16% above their basis — modest negotiation headroom, anchor on the comps not their cost.
Risks & watch-outs
- Climate carrying-cost: major wind risk, 53% chance of damaging wind over 30y; extreme-heat days projected 7→16/yr by 2055 (HVAC capex compounding) — expect insurance premiums to compound above CPI over the hold.
Questions for the listing agent
- What do current leases actually rent for vs. the listed asking? Can we see a recent rent roll and the last 12 months of T-12 income?
- It's been on market 59 days. Have you received any prior offers? Is the seller open to a 17% concession, seller financing, or rate buy-down credit?
- Is there a deadline driving the sale (1031 exchange, divorce, estate, relocation)? That informs how much negotiation room exists.
- Schools are A-rated — typically a magnet for longer-tenancy family renters. What's the average tenant stay here, and is there a school-zone premium baked into asking?
- The area grade is low — what's the realistic commute time and amenity access for the typical tenant pool here? Any planned neighborhood developments (good or bad) we should know about?
- What's the average days-on-market for RENTAL listings here right now (not sales)? A rising rental-DOM trend means longer vacancies and softer asking-rent achievability than the comps imply.
- What's the recent tenant-quality profile in this submarket — average credit score on applications, eviction rate, late-payment / NSF rate, and stable-employment percentage? A property-management company in the area should have these aggregated.
- How much new for-sale + rental construction is in the pipeline within 1–3 miles? Heavy new supply typically softens prices + rents 12–24 months out; constrained supply supports both.
Investment metrics
- 1% rule
- 0.83% ✗
- Cap rate
- 5.99%
- Cash-on-cash
- -1.06%
- DSCR
- 0.95
- GRM
- 10.1
CMA / ARV
- ARV (median comp)
- $1,688,481
- List price
- $1,448,000
- Delta
- -14.24%
- Verdict
- UNDERPRICED
- Comps
- 20 within 1.0 mi
Show comp detail 12 sales within ~0.75 mi
| Address | Dist | Beds/Ba | Sqft | Sold | Price | $/sf | Match |
|---|---|---|---|---|---|---|---|
| 37 Maple St | 0.07mi | 4/2.5 | 2,500 (+7%) | 7mo | $1,550,000 | $620 | 78 |
| 15 Dianas Cir | 0.23mi | 4/3.0 | 2,416 (+4%) | 6mo | $1,665,000 | $689 | 76 |
| 107 Warner Ave | 0.29mi | 4/2.5 | 2,404 (+3%) | 7mo | $930,000 | $387 | 75 |
| 5 Hillside Ave | 0.33mi | 4/2.0 | 2,230 (-4%) | 2mo | $1,305,000 | $585 | 74 |
| 134 Warner Ave | 0.29mi | 5/2.5 (+1) | 2,296 (-1%) | 6mo | $1,112,500 | $485 | 74 |
| 53 Maple St | 0.07mi | 4/2.0 | 2,048 (-12%) | 5mo | $1,100,000 | $537 | 70 |
| 38 High St | 0.31mi | 5/2.0 (+1) | 2,240 (-4%) | 3mo | $999,990 | $446 | 69 |
| 142 Willow St | 0.26mi | 3/2.5 (-1) | 2,100 (-10%) | 3mo | $880,000 | $419 | 64 |
| 53 Stratford N | 0.47mi | 4/2.5 | 2,169 (-7%) | 8mo | $1,330,000 | $613 | 60 |
| 18 Willow St | 0.12mi | 3/2.5 (-1) | 1,982 (-15%) | 10mo | $1,060,000 | $535 | 56 |
| 62 Harvard St | 0.69mi | 4/3.5 | 2,461 (+6%) | 12mo | $1,350,000 | $549 | 45 |
| 122 Main St | 0.68mi | 3/3.0 (-1) | 2,100 (-10%) | 6mo | $999,990 | $476 | 40 |
Match score weights: distance 35% · size 25% · config 20% · recency 20%. Top-matched comps best support the ARV.
Projected returns pro-forma
-3.0% appreciation · 3.0% rent growth · sell at horizon
- IRR
- -18.0%
- Equity multiple
- 0.36×
- Total profit
- $-257,465
- Equity at exit
- $215,902
- IRR
- -10.3%
- Equity multiple
- 0.38×
- Total profit
- $-253,372
- Equity at exit
- $125,197
Cash invested: $405,440 (down + closing). Projections, not guarantees.
Landlord ↔ Tenant lean methodology
- Overall (STATE)
- 15 Strongly Tenant-Friendly
- State New York
- 15 Strongly Tenant-Friendly · D+10
- County
- — inherits STATE
- City
- — inherits STATE
ZIP-level market 11577
- Home prices YoY
- -28.9%
- Active inventory
- 71
- Price-to-rent
- 10.1×
Monthly cashflow live
- Estimated rent
- $12,000 medium interval (Pro) →
- Mortgage (P&I)
- −$7,593
- Tax from tax record
- −$1,643 /mo · $19,714/yr
- Insurance
- −$603
- HOA
- −$0
- Vacancy / Maint / Mgmt
- −$2,520
- Net cashflow
- $-360
Break-even live
Sensitivity live
| Price | -10% $460 | -5% $50 | +0% $-360 | +5% $-769 | +10% $-1,179 |
|---|---|---|---|---|---|
| Rent | -10% $-1,308 | -5% $-834 | +0% $-360 | +5% $114 | +10% $588 |
| Rate | -1.0pp $370 | -0.5pp $9 | base $-360 | +0.5pp $-735 | +1.0pp $-1,117 |
UW: 25.0% down · 7.5% · 30yr · 1.5% tax · 5.0% vac · 8.0% maint · 8.0% mgmt
Financing live
Cash to close
- Down payment
- $362,000
- Closing costs
- $43,440
- Reserves months
- —
- Total cash needed
- —
Loan-product check · same deal, 3 products live
Conventional
25% down · 7.5% · 30yr
- Down + closing
- —
- Monthly P&I
- —
- Monthly cashflow
- —
- DSCR
- —
- Eligible?
- —
Personal DTI + credit; lowest rate.
DSCR
20% down · 8.5% · 30yr
- Down + closing
- —
- Monthly P&I
- —
- Monthly cashflow
- —
- DSCR
- —
- Eligible?
- —
No personal income docs; deal must DSCR.
Hard money
10% down · 12.0% · 12mo
- Down + closing
- —
- Monthly P&I
- —
- Monthly cashflow
- —
- DSCR
- —
- Eligible?
- —
Short-term bridge; refi at stabilization.
Rent comps 1 comps
| Address | Beds | Baths | Sqft | Rent | $/sqft | DOM | Units | Dist |
|---|---|---|---|---|---|---|---|---|
| 902 Mill Crk S #902 Roslyn, NY | 3.0 | 3.5 | 3172 | $12,000 | $3.78 | 23d | 1 | 1.04mi |
Listing history 27 events
-
2026-06-21days on market $1,448,000 Active 59 DOM
-
2026-06-18days on market $1,448,000 Active 56 DOM
-
2026-06-17days on market $1,448,000 Active 55 DOM
-
2026-06-16days on market $1,448,000 Active 54 DOM
-
2026-06-15days on market $1,448,000 Active 53 DOM
-
2026-06-13days on market $1,448,000 Active 51 DOM
-
2026-06-13days on market $1,448,000 Active 50 DOM
-
2026-06-09days on market $1,448,000 Active 47 DOM
-
2026-06-08days on market $1,448,000 Active 46 DOM
-
2026-06-07days on market $1,448,000 Active 45 DOM
-
2026-06-04days on market $1,448,000 Active 42 DOM
-
2026-06-03days on market $1,448,000 Active 41 DOM
-
2026-06-02days on market $1,448,000 Active 40 DOM
-
2026-06-01days on market $1,448,000 Active 39 DOM
-
2026-05-31days on market $1,448,000 Active 38 DOM
-
2026-05-12historical $8,500
-
2026-05-12price $1,448,000 1291-char remark
-
2026-04-23$1,457,000 Active 1291-char remark
-
2026-04-14$8,500
-
2026-03-25soldstatus $1,250,000
-
2026-03-13soldstatus $1,250,000 Closed 365-char remark
Show marketing remark (365 chars)
IMPRESSIVE MODERN 4 BEDROOM COLONIAL PRIVATELY LOCATED ON ONE THE NICEST BLOCK IN ROSLYN HEIGHTS. OFFERING 4 LARGE BEDROOMS, SPACIOUS LIVING ROOM, FAMILY ROOM WITH FIREPLACE AND DINING ROOM, BEAUTIFUL WOOD FLOORS THROUGHOUT. THIS PROPERTY IS CLOSE TO ALL PUBLIC TRANSPORTATION, PARKS, STORS, BEACHES, HOSPITALS, HIGHWAYS QUICK ACCESS AND RESTAURANTS. GREAT VALUE.
-
2025-12-04status Pending 365-char remark
Show marketing remark (365 chars)
IMPRESSIVE MODERN 4 BEDROOM COLONIAL PRIVATELY LOCATED ON ONE THE NICEST BLOCK IN ROSLYN HEIGHTS. OFFERING 4 LARGE BEDROOMS, SPACIOUS LIVING ROOM, FAMILY ROOM WITH FIREPLACE AND DINING ROOM, BEAUTIFUL WOOD FLOORS THROUGHOUT. THIS PROPERTY IS CLOSE TO ALL PUBLIC TRANSPORTATION, PARKS, STORS, BEACHES, HOSPITALS, HIGHWAYS QUICK ACCESS AND RESTAURANTS. GREAT VALUE.
-
2025-10-31price $1,299,999 365-char remark
Show marketing remark (365 chars)
IMPRESSIVE MODERN 4 BEDROOM COLONIAL PRIVATELY LOCATED ON ONE THE NICEST BLOCK IN ROSLYN HEIGHTS. OFFERING 4 LARGE BEDROOMS, SPACIOUS LIVING ROOM, FAMILY ROOM WITH FIREPLACE AND DINING ROOM, BEAUTIFUL WOOD FLOORS THROUGHOUT. THIS PROPERTY IS CLOSE TO ALL PUBLIC TRANSPORTATION, PARKS, STORS, BEACHES, HOSPITALS, HIGHWAYS QUICK ACCESS AND RESTAURANTS. GREAT VALUE.
-
2025-07-28$1,399,999 Active 365-char remark
Show marketing remark (365 chars)
IMPRESSIVE MODERN 4 BEDROOM COLONIAL PRIVATELY LOCATED ON ONE THE NICEST BLOCK IN ROSLYN HEIGHTS. OFFERING 4 LARGE BEDROOMS, SPACIOUS LIVING ROOM, FAMILY ROOM WITH FIREPLACE AND DINING ROOM, BEAUTIFUL WOOD FLOORS THROUGHOUT. THIS PROPERTY IS CLOSE TO ALL PUBLIC TRANSPORTATION, PARKS, STORS, BEACHES, HOSPITALS, HIGHWAYS QUICK ACCESS AND RESTAURANTS. GREAT VALUE.
-
1989-10-05soldstatus $385,000
-
1988-06-16soldstatus $210,000
-
1987-09-22soldstatus $175,000
ⓘ Source: listings_history table (triggers on properties + properties_extension) + one-shot
backfill from property_details.listing_events for pre-trigger history.
Tax reassessment forecast NY · Partial reset (capped growth)
- Current annual tax
- $19,714 · $1,643/mo
- Projected year-2 tax
- $22,093 · $1,841/mo
- Expected delta
- +$2,379/yr (+$198/mo · 12.1%)
ⓘ Screening estimate from a state-policy table — verify with the county assessor before closing.
Climate risk First Street
- Flood 1/10 Low FEMA zone X (unshaded) · 0% chance over 30 yrs
- Wildfire 1/10 Low
- Heat 6/10 Major 7 d/yr ≥98°F today · 16 d/yr by 30 yrs out
- Wind 6/10 Major 53% chance of damaging wind over 30 yrs
- Air quality 4/10 Moderate 6 unhealthy d/yr today · 7 by 30 yrs out
Nearby sold comps map
Loading sold comps map…
Walkable amenities ~0.75 mi
Loading nearby amenities…
Taxation est. · year 1
- Rental income
- $144,000
- − Mortgage interest
- −$81,111
- − Property taxes
- −$19,714
- − Insurance
- −$7,240
- − Repairs & maintenance
- −$11,520
- − Management
- −$11,520
- − Depreciation
- −$42,124
- Taxable loss
- −$29,228
- Est. tax savings @ 24.0%
- +$7,015
- After-tax cash flow
- $2,699/yr
For passive investors: Depreciation is non-cash, so a rental often shows a tax loss while cash-flowing — sheltering income. Rental losses are passive: they offset passive income freely, and up to $25,000/yr can offset ordinary (W-2) income if you actively participate and your MAGI is under $100k (phasing out to $0 by $150k); unused losses carry forward. On sale, claimed depreciation is recaptured at up to 25%, and gains may owe capital-gains tax (a 1031 exchange can defer both). Figures are a year-1 estimate at your 24.0% rate — not tax advice; consult a CPA.
Schools (NCES district)
- District
- Roslyn Union Free School District
- NCES district ID
- 3625050
- Math proficiency
- 83% ▼ -2.00%
- Reading proficiency
- 82% ▲ 3.00%
- Median HH income
- $128,640
- Composite
- 77.26/100
- National rank
- #101
- State rank
- #28 of 590 in NY
Livability — Roslyn Heights
- Score
- 81/100
- State rank
- #98
- US rank
- #1499
Category grades
Schools grade is shown separately in the Schools card above.
Census & demographics
- Census place
- Roslyn Heights, NY
- Population (ZIP)
- 12,771
Population outlook (Nassau County) Hauer SSP2
- Today (2025)
- 1,409,302 people
- By 2030
- 1,431,482 · +1.6%
- By 2040
- 1,471,607 · +4.4%
- By 2050
- 1,502,845 · +6.6%
- By 2075
- 1,575,403 · +11.8%
- By 2100
- 1,554,356 · +10.3%
Race, ethnicity, and origin ACS 2023
- Neighborhood character
- Majority White (64%)
- Race & ethnicity
- White 64% Asian 22% Hispanic / Latino 10% Two or more races 8% Black 2%
- Hispanic origin (detail)
- Mexican 2% Puerto Rican 1% Cuban 2%
- Common ancestry
- Scotch-Irish 6% Romanian 4% Danish 2%
- Foreign-born
- 25% · China, Canada, South Korea
- Languages at home
- 67% English-only · Other Indo-European 11% Chinese 9% Spanish 8%
Political lean MEDSL · Nassau
- 2024 margin
- Toss-up / Even · D 47.9% · R 52.1%
- 2008→2024 swing
- -12.6pp toward R · 2008: 8.4pp · 2024: -4.2pp
- All cycles
- 2024: R+4.2 2020: D+9.5 2016: D+5.3 2012: D+6.7 2008: D+8.4
Not yet ingested
- Civics
- —
Market trends
- HPI YoY
- ▼ -125.67%
- Current HPI
- 308.3566
- Rent YoY
- —
- Metro
- —
- State GDP YoY
- ▲ 2.60%
- F500 in state
- 92
Industry mix (Fortune 500 HQ in NY)
| Industry | F500 HQs | Revenue |
|---|---|---|
| Financial Services | 10 | $950B |
|
||
| Consumer Goods | 9 | $162B |
|
||
| Insurance | 4 | $225B |
|
||
| Telecommunications | 2 | $144B |
|
||
| Pharmaceuticals | 2 | $112B |
|
||
| Media / Entertainment | 2 | $69B |
|
||
Price history
-95.1% since first listed12 events — show timeline
- 2026-05-12 Rental Removed $8,500 ONEKEY
- 2026-05-12 Price Changed $1,448,000 OneKey® MLS as Distributed by MLS Grid
- 2026-04-23 Listed $1,457,000 OneKey® MLS as Distributed by MLS Grid
- 2026-04-14 Listed for Rent $8,500 ONEKEY
- 2026-03-25 Sold (Public Records) $1,250,000 Public Records
- 2026-03-13 Sold (MLS) $1,250,000 OneKey® MLS as Distributed by MLS Grid
- 2025-12-04 Pending — OneKey® MLS as Distributed by MLS Grid
- 2025-10-31 Price Changed $1,299,999 OneKey® MLS as Distributed by MLS Grid
- 2025-07-28 Listed $1,399,999 OneKey® MLS as Distributed by MLS Grid
- 1989-10-05 Sold (Public Records) $385,000 Public Records
- 1988-06-16 Sold (Public Records) $210,000 Public Records
- 1987-09-22 Sold (Public Records) $175,000 Public Records
Property tax history
+2.1%/yrLatest (2024): $19,714 · +2.6% YoY. Source: county tax records.
Cash-flow waterfall
monthlySold comps — $/sqft
last 12 mo · ≤1 miLoading sold comps…