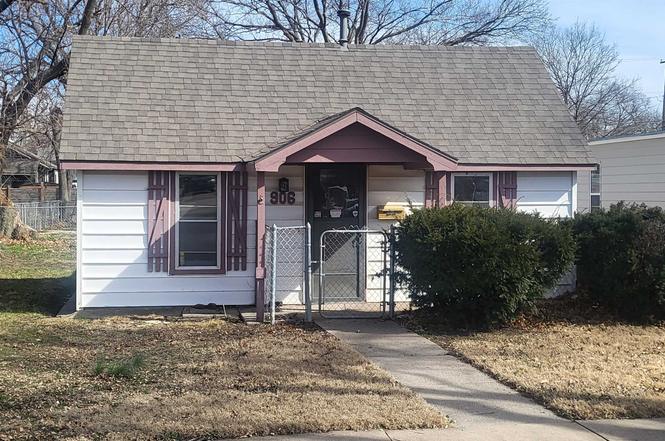
906 N Walnut · McPherson, KS
Flood risk 1/10 · Minimal
- FEMA flood zone
- X (unshaded)
- Chance of flooding over 30 yrs
- 0.0%
- Est. flood insurance / yr
- $507 – $1,088
Fire risk 1/10 · Minimal
- Est. fire insurance / yr
- $1,154 – $2,142
Heat risk 5/10 · Moderate
- Hot days now (above 106°F)
- 7 days/yr
- Hot days in 30 yrs
- 18 days/yr
Wind risk 2/10 · Minimal
- Chance of severe wind over 30 yrs
- —
Air-quality risk 2/10 · Minimal
- Unhealthy air days now
- 0 days/yr
- Unhealthy air days in 30 yrs
- 1 days/yr
Risk factors via First Street. Map © Google.
Why this score? — see what drove the B- grade
The composite is a weighted blend of 9 inputs, each scored 0–100. Each bar is that input's sub-score; the figure is the points it added to the 100-point composite (weight × sub-score).
- Cash flow +30.0/30.0
- DSCR +10.0/10.0
- 1% rule +8.4/10.0
- ARV discount +7.5/15.0
- Livability +4.0/5.0
- Rent growth +2.5/5.0
- Schools +2.5/10.0
- Condition / age +2.5/5.0
- Appreciation +0.0/10.0
$69,900
🖨 Deal sheet (PDF) 📄 Offer letter ✓ Due diligence
Key facts
- Roof
- Floor coverings
- Interior paint
Tags
Property features AI
Finance
- Other: Location: McPherson County
- Financial info: Tax information present but excluded per instructions
- HOA & community: HOA information not provided
Exterior
- Parking: Parking information not provided
- Security: No security features listed
- Utilities: Public water; Sewer available; Natural gas available
- Home design: Single-family onsite built
- Construction: Composition roof; No basement; Foundation details not specified
- Exterior features: One-level layout; Patio; Chain link fencing; Storm doors; Storm windows
Interior
- Kitchen: No kitchen appliance details provided
- Bedrooms: Bedrooms information not provided
- Flooring: Flooring information not provided
- Bathrooms: 1 full bathroom
- Heating & cooling: Central air conditioning (electric); Forced air heating (natural gas)
- Interior features: No built-in appliances listed
- Laundry & utility: Main floor laundry in a separate room; 220V equipment available in laundry area
Neighborhood map
What this means for you Summary
Snapshot
- This is a 1-bed/1.0-bath single-family listed at $70k.
Deal economics
- At list price, monthly cash flow is $264 ($3k/yr) — positive.
- The deal already cash-flows at list — no discount required.
- Meets the 1% rule at list price ($938 rent vs $70k).
- Recommended offer: $64k (9.0% below list) — sets the bar for market timing.
Location & tenants
- Location reads 81/100 on livability (#12 in KS, #1,567 nationally) — a professional / high-income tenant draw. Strengths: amenities A+, cost of living A+, housing A+; Watch: commute F.
- Mcpherson (town): math 25% / reading 32% proficiency, ranked #103 of 169 in KS (top 61%) — low school quality limits family demand, transient renter base, plan for 1-2y turnover.
- Zoned schools: Lincoln Elem (math 22% / reading 32%, grade F, #507 of 684 statewide, top 78%, 253 students, 49% FRL); Mcpherson Middle School (math 21% / reading 27%, grade F, #121 of 219 statewide, top 56%, 492 students, 42% FRL); Mcpherson High (math 22% / reading 22%, grade F, #165 of 327 statewide, top 55%, 709 students, 36% FRL).
- Market conditions: 149 active listings in the ZIP; 1 comparable units currently listed for rent nearby; solid renter incomes; 102 units permitted in McPherson County in 2024 (0 in 5+ unit buildings).
- This rent is only 14% of the median local income ($81k/yr) — well below the 30% rent-burden line; pricing power to push rent on renewal without tenant pushback.
Forward outlook
- Local home prices are declining (-3.0%/yr); year-one equity from $483 of loan paydown is wiped out by about $2k of value loss. Plan a longer hold.
- McPherson County population projected to shrink 6% by 2050 — rents likely to lag national; underwrite the cash flow, not the appreciation.
- At projected returns (-3.0% appreciation + 3.0% rent growth), your $20k cash investment doubles in ~8 years — after that, you're playing with house money.
Negotiation context
- It's been on market 107 days — a 9% lower offer ($64k) is reasonable based on typical stale-listing flexibility.
- Current owner paid $30k; list at $70k implies a 133% gain — meaningful room to come down on a strong offer.
Risks & watch-outs
- Watch-outs: built in 1930 — expect roof / HVAC / electrical / plumbing capex.
- Climate carrying-cost: extreme-heat days projected 7→18/yr by 2055 (HVAC capex compounding) — expect insurance premiums to compound above CPI over the hold.
Questions for the listing agent
- It's been on market 107 days. Have you received any prior offers? Is the seller open to a 9% concession, seller financing, or rate buy-down credit?
- Built in 1930 — when were the roof, HVAC, electrical panel, plumbing, and water heater last replaced?
- Why hasn't it sold? Are there any deal-killer items the seller is aware of (foundation, flood, title, zoning, code violations)?
- Is there a deadline driving the sale (1031 exchange, divorce, estate, relocation)? That informs how much negotiation room exists.
- What's the average days-on-market for RENTAL listings here right now (not sales)? A rising rental-DOM trend means longer vacancies and softer asking-rent achievability than the comps imply.
- What's the recent tenant-quality profile in this submarket — average credit score on applications, eviction rate, late-payment / NSF rate, and stable-employment percentage? A property-management company in the area should have these aggregated.
- How much new for-sale + rental construction is in the pipeline within 1–3 miles? Heavy new supply typically softens prices + rents 12–24 months out; constrained supply supports both.
Investment metrics
- 1% rule
- 1.34% ✓
- Cap rate
- 10.83%
- Cash-on-cash
- 16.19%
- DSCR
- 1.72
- GRM
- 6.2
CMA / ARV
No comps found within radius.
Projected returns pro-forma
-3.0% appreciation · 3.0% rent growth · sell at horizon
- IRR
- 7.2%
- Equity multiple
- 1.28×
- Total profit
- $5,503
- Equity at exit
- $10,422
- IRR
- 16.5%
- Equity multiple
- 2.35×
- Total profit
- $26,491
- Equity at exit
- $6,044
Cash invested: $19,572 (down + closing). Projections, not guarantees.
Landlord ↔ Tenant lean methodology
- Overall (STATE)
- 83 Strongly Landlord-Friendly
- State Kansas
- 83 Strongly Landlord-Friendly · R+10
- County
- — inherits STATE
- City
- — inherits STATE
ZIP-level market 67460
- Active inventory
- 149
- Price-to-rent
- 6.2×
Monthly cashflow live
- Estimated rent
- $938 medium interval (Pro) →
- Mortgage (P&I)
- −$367
- Tax from tax record
- −$81 /mo · $974/yr
- Insurance
- −$29
- HOA
- −$0
- Vacancy / Maint / Mgmt
- −$197
- Net cashflow
- $264
Break-even live
Sensitivity live
| Price | -10% $304 | -5% $284 | +0% $264 | +5% $244 | +10% $225 |
|---|---|---|---|---|---|
| Rent | -10% $190 | -5% $227 | +0% $264 | +5% $301 | +10% $338 |
| Rate | -1.0pp $299 | -0.5pp $282 | base $264 | +0.5pp $246 | +1.0pp $228 |
UW: 25.0% down · 7.5% · 30yr · 1.5% tax · 5.0% vac · 8.0% maint · 8.0% mgmt
Financing live
Cash to close
- Down payment
- $17,475
- Closing costs
- $2,097
- Reserves months
- —
- Total cash needed
- —
Loan-product check · same deal, 3 products live
Conventional
25% down · 7.5% · 30yr
- Down + closing
- —
- Monthly P&I
- —
- Monthly cashflow
- —
- DSCR
- —
- Eligible?
- —
Personal DTI + credit; lowest rate.
DSCR
20% down · 8.5% · 30yr
- Down + closing
- —
- Monthly P&I
- —
- Monthly cashflow
- —
- DSCR
- —
- Eligible?
- —
No personal income docs; deal must DSCR.
Hard money
10% down · 12.0% · 12mo
- Down + closing
- —
- Monthly P&I
- —
- Monthly cashflow
- —
- DSCR
- —
- Eligible?
- —
Short-term bridge; refi at stabilization.
Rent comps 1 comps
| Address | Beds | Baths | Sqft | Rent | $/sqft | DOM | Units | Dist |
|---|---|---|---|---|---|---|---|---|
| 507 E Northview Ave McPherson, KS | 1.0–3.0 | 1.0–2.0 | 900 | $870 | $0.97 | 14d | 5 | 1.09mi |
Listing history 19 events
-
2026-06-19days on market $69,900 Active 107 DOM
-
2026-06-18days on market $69,900 Active 106 DOM
-
2026-06-17days on market $69,900 Active 105 DOM
-
2026-06-16days on market $69,900 Active 104 DOM
-
2026-06-15days on market $69,900 Active 103 DOM
-
2026-06-14days on market $69,900 Active 101 DOM
-
2026-06-12days on market $69,900 Active 100 DOM
-
2026-06-09days on market $69,900 Active 97 DOM
-
2026-06-08days on market $69,900 Active 96 DOM
-
2026-06-07days on market $69,900 Active 95 DOM
-
2026-06-05days on market $69,900 Active 93 DOM
-
2026-06-04pricedays on market $69,900 Active 91 DOM
-
2026-06-02days on market $79,900 Active 90 DOM
-
2026-06-01days on market $79,900 Active 89 DOM
-
2026-05-31days on market $79,900 Active 88 DOM
-
2026-05-31days on market $79,900 Active 87 DOM
-
2026-03-03$79,900 Active
-
1996-04-01soldstatus $30,000
-
1991-01-01soldstatus $20,000
ⓘ Source: listings_history table (triggers on properties + properties_extension) + one-shot
backfill from property_details.listing_events for pre-trigger history.
Tax reassessment forecast KS · Resets to sale price
- Current annual tax
- $974 · $81/mo
- Projected year-2 tax
- $986 · $82/mo
- Expected delta
- +$12/yr (+$1/mo · 1.2%)
ⓘ Screening estimate from a state-policy table — verify with the county assessor before closing.
Climate risk First Street
- Flood 1/10 Low FEMA zone X (unshaded) · 0% chance over 30 yrs
- Wildfire 1/10 Low
- Heat 5/10 Major 7 d/yr ≥106°F today · 18 d/yr by 30 yrs out
- Wind 2/10 Low
- Air quality 2/10 Low 0 unhealthy d/yr today · 1 by 30 yrs out
Nearby sold comps map
Loading sold comps map…
Walkable amenities ~0.75 mi
Loading nearby amenities…
Taxation est. · year 1
- Rental income
- $11,254
- − Mortgage interest
- −$3,915
- − Property taxes
- −$974
- − Insurance
- −$350
- − Repairs & maintenance
- −$900
- − Management
- −$900
- − Depreciation
- −$2,033
- Taxable income
- $2,181
- Est. tax owed @ 24.0%
- −$524
- After-tax cash flow
- $2,645/yr
For passive investors: Depreciation is non-cash, so a rental often shows a tax loss while cash-flowing — sheltering income. Rental losses are passive: they offset passive income freely, and up to $25,000/yr can offset ordinary (W-2) income if you actively participate and your MAGI is under $100k (phasing out to $0 by $150k); unused losses carry forward. On sale, claimed depreciation is recaptured at up to 25%, and gains may owe capital-gains tax (a 1031 exchange can defer both). Figures are a year-1 estimate at your 24.0% rate — not tax advice; consult a CPA.
Schools (NCES district)
- District
- Mcpherson
- NCES district ID
- 2009390
- Math proficiency
- 25% ▼ -3.00%
- Reading proficiency
- 32% ▲ 1.00%
- Median HH income
- $54,750
- Composite
- 25.39/100
- National rank
- #7468
- State rank
- #103 of 169 in KS
Livability — McPherson
- Score
- 81/100
- State rank
- #12
- US rank
- #1567
Category grades
Schools grade is shown separately in the Schools card above.
Census & demographics
- Census place
- McPherson, KS
- County
- McPherson County · 16,348 people
- City population
- 16,348
- Metro
- McPherson, KS
- Population (ZIP)
- 16,348
- Household income
- $80,720
- Rent vs Own
- Severe rent burden
- 492.0
Population outlook (McPherson County) Hauer SSP2
- Today (2025)
- 28,958 people
- By 2030
- 28,735 · -0.8%
- By 2040
- 28,020 · -3.2%
- By 2050
- 27,276 · -5.8%
- By 2075
- 26,211 · -9.5%
- By 2100
- 23,976 · -17.2%
Race, ethnicity, and origin ACS 2023
- Neighborhood character
- Predominantly White (87%)
- Race & ethnicity
- White 87% Hispanic / Latino 6% Two or more races 4% Black 2% Asian 1%
- Hispanic origin (detail)
- Mexican 5%
- Common ancestry
- Slovak 4% Iranian 3% Serbian 2%
- Foreign-born
- 5% · Canada
- Languages at home
- 92% English-only · Spanish 6% German/W. Germanic 1%
Political lean MEDSL · McPherson
- 2024 margin
- Solid R (+41.1) · D 28.5% · R 69.6% · Other 1.9%
- 2008→2024 swing
- -5.8pp toward R · 2008: -35.3pp · 2024: -41.1pp
- All cycles
- 2024: R+41.1 2020: R+40.3 2016: R+42.0 2012: R+41.6 2008: R+35.3
Not yet ingested
- Civics
- —
Market trends
- HPI YoY
- ▼ -216.18%
- Current HPI
- 155.3302
- Rent YoY
- —
- Metro
- McPherson, KS
- State GDP YoY
- —
- F500 in state
- 0
Price history
+299.5% since first listed3 events — show timeline
- 2026-03-03 Listed $79,900 SCKMLS as Distributed by MLS Grid
- 1996-04-01 Sold (Public Records) $30,000 Public Records
- 1991-01-01 Sold (Public Records) $20,000 Public Records
Property tax history
+1.4%/yrLatest (2025): $974 · +7.5% YoY. Source: county tax records.
Cash-flow waterfall
monthlySold comps — $/sqft
last 12 mo · ≤1 miLoading sold comps…