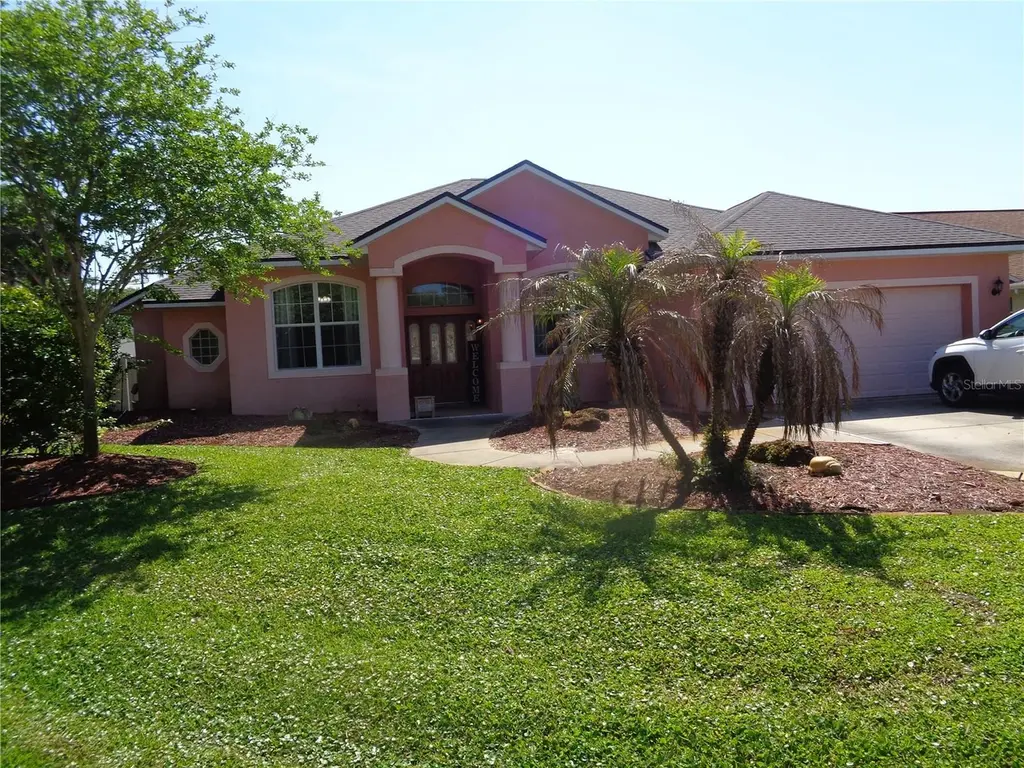
35 Waters Dr · Palm Coast, FL
Flood risk 1/10 · Minimal
- FEMA flood zone
- X (unshaded)
- Chance of flooding over 30 yrs
- 0.0%
- Est. flood insurance / yr
- $507 – $1,088
Fire risk 1/10 · Minimal
- Est. fire insurance / yr
- $947 – $1,759
Heat risk 9/10 · Severe
- Hot days now (above 106°F)
- 7 days/yr
- Hot days in 30 yrs
- 21 days/yr
Wind risk 10/10 · Severe
- Chance of severe wind over 30 yrs
- 99.0%
Air-quality risk 2/10 · Minimal
- Unhealthy air days now
- 2 days/yr
- Unhealthy air days in 30 yrs
- 2 days/yr
Risk factors via First Street. Map © Google.
Why this score? — see what drove the D+ grade
The composite is a weighted blend of 9 inputs, each scored 0–100. Each bar is that input's sub-score; the figure is the points it added to the 100-point composite (weight × sub-score).
- ARV discount +15.0/15.0
- Cash flow +12.9/30.0
- Schools +4.6/10.0
- 1% rule +4.3/10.0
- DSCR +3.9/10.0
- Livability +3.5/5.0
- Rent growth +2.8/5.0
- Condition / age +2.5/5.0
- Appreciation +0.0/10.0
$230,000
🖨 Deal sheet (PDF) 📄 Offer letter ✓ Due diligence
Listing remarks MLS
Gorgeous custom built one owner pool home in the highly desirable area of Pine Lakes. Situated on a corner lot with mature landscaping and grand front entryway. The interior features 3 beds/2 bath with office, tile in main living areas, large windows, 11 ft high ceilings, quality Euro style cabinets in kitchen, updated master bath, pool door access to guest bath, surround sound, and 8 ft sliders that lead to your own personal oasis featuring a covered patio, custom free form salt pool with flagstone surround, and paver patio with gazebo to enjoy in your fully fenced yard. New roof, gutters, a. c. exterior paint, pool pump and service plug to accommodate a generator .
Key facts
- 0.25 acre lot
- 2 garage spots
- Pool
Property features AI
Finance
- HOA & community: No association indicated; Pets allowed; Development: Pine Lakes
Exterior
- Parking: Attached garage; 2-car garage
- Utilities: Public sewer; Electricity connected; Water connected; Sprinkler well
- Home design: Single family residence; One story; Faces west
- Construction: Block and stucco construction; Shingle roof; Slab foundation; Built on a 0.25-acre lot
- Exterior features: Rain gutters; In-ground private pool; Asphalt road access
Interior
- Kitchen: No appliances listed
- Bedrooms: 3 bedrooms
- Flooring: Carpet; Laminate; Tile
- Bathrooms: 2 full bathrooms
- Heating & cooling: Central heating; Central air conditioning
- Interior features: High ceilings
- Laundry & utility: Laundry room
Neighborhood map
What this means for you Summary
Snapshot
- This is a 3-bed/2.0-bath single-family listed at $230k.
Deal economics
- At list price, monthly cash flow is $-15 ($-180/yr) — negative.
- To cash-flow at today's rent, offer at most $227k (1.2% below list).
- To meet the 1% rule (rent ≥ 1% of price), the offer needs to be $215k (6.6% below list).
- Recommended offer: $215k (6.6% below list) — sets the bar for 1% rule.
- Cap rate 6.2% vs local median 3.8% in Palm Coast — top-decile yield for the area; either an underpriced asset or a hidden risk that comps aren't pricing in. Stress-test before assuming the spread holds.
Location & tenants
- Location reads 69/100 on livability (#478 in FL) — a middle-class / working-renter tenant base. Strengths: housing A+, health & safety A+, cost of living B+; Watch: amenities F, commute F.
- Flagler (rural): math 53% / reading 56% proficiency, ranked #20 of 73 in FL (top 27%) — acceptable for families but not a draw, mixed tenant base, ~2y average lease.
- Zoned schools: Lewis E. Wadsworth Elementary (math 54% / reading 57%, grade C, #855 of 2,144 statewide, top 41%, 743 students, 68% FRL); Buddy Taylor Middle School (math 50% / reading 45%, grade C-, #288 of 571 statewide, top 51%, 1,343 students, 63% FRL); Flagler-Palm Coast High School (math 36% / reading 51%, grade F, #248 of 667 statewide, top 38%, 2,523 students, 52% FRL).
- Market conditions: Rents rising (+1.2%/yr); 1380 active listings in the ZIP; 33 comparable units currently listed for rent nearby; rentals at typical pace (median 16d on market — plan ~3-4 weeks tenant-placement turnaround); solid renter incomes; 2,588 units permitted in Flagler County in 2024 (0 in 5+ unit buildings).
- This rent runs 34% of the median local income ($76k/yr) — at the standard rent-burdened threshold; future hikes will face affordability resistance.
Forward outlook
- Local home prices are declining (-3.0%/yr); year-one equity from $2k of loan paydown is wiped out by about $7k of value loss. Plan a longer hold.
- Flagler County population projected at +28% by 2050 — long-run rental-demand tailwind backs the buy-and-hold thesis.
Negotiation context
- It's been on market 18 days — a 2% lower offer ($227k) is reasonable based on typical stale-listing flexibility.
- 2 sale attempts since 5y ago with the ask held roughly flat each time — persistent listings suggest the price (not the market) is what's stuck; bring a comps-based counter.
Risks & watch-outs
- Climate carrying-cost: severe wind risk, 99% chance of damaging wind over 30y; extreme-heat days projected 7→21/yr by 2055 (HVAC capex compounding) — expect insurance premiums to compound above CPI over the hold.
Questions for the listing agent
- What do current leases actually rent for vs. the listed asking? Can we see a recent rent roll and the last 12 months of T-12 income?
- Is there a deadline driving the sale (1031 exchange, divorce, estate, relocation)? That informs how much negotiation room exists.
- The area grade is low — what's the realistic commute time and amenity access for the typical tenant pool here? Any planned neighborhood developments (good or bad) we should know about?
- What's the average days-on-market for RENTAL listings here right now (not sales)? A rising rental-DOM trend means longer vacancies and softer asking-rent achievability than the comps imply.
- What's the recent tenant-quality profile in this submarket — average credit score on applications, eviction rate, late-payment / NSF rate, and stable-employment percentage? A property-management company in the area should have these aggregated.
- How much new for-sale + rental construction is in the pipeline within 1–3 miles? Heavy new supply typically softens prices + rents 12–24 months out; constrained supply supports both.
Investment metrics
- 1% rule
- 0.93% ✗
- Cap rate
- 6.21%
- Cash-on-cash
- -0.28%
- DSCR
- 0.99
- GRM
- 8.9
CMA / ARV
- ARV (on-the-fly)
- $383,040
- Comps found
- 12
Show comp detail 12 sales within ~0.75 mi
| Address | Dist | Beds/Ba | Sqft | Sold | Price | $/sf | Match |
|---|---|---|---|---|---|---|---|
| 7 Wainwright Pl | 0.27mi | 3/2.0 | 2,046 (-4%) | 1mo | $395,000 | $193 | 80 |
| 62 Whittington Dr | 0.20mi | 4/3.0 (+1) | 2,170 (+2%) | 2mo | $495,000 | $228 | 77 |
| 6 Wavecrest Pl | 0.34mi | 4/2.0 (+1) | 2,158 (+1%) | 1mo | $360,000 | $167 | 76 |
| 95 Whittington Dr | 0.46mi | 3/2.0 | 2,160 (+2%) | 0mo | $349,900 | $162 | 76 |
| 3 Wilson Pl | 0.48mi | 3/2.0 | 1,989 (-6%) | 0mo | $312,000 | $157 | 67 |
| 17 White Hall Dr | 0.64mi | 3/3.0 | 2,121 (-0%) | 0mo | $449,000 | $212 | 65 |
| 1 Patchogue Ln | 0.56mi | 3/3.0 | 2,028 (-5%) | 2mo | $365,000 | $180 | 60 |
| 39 Prattwood Ln | 0.60mi | 4/2.0 (+1) | 1,862 (-12%) | 1mo | $356,945 | $192 | 45 |
| 60 Wynnfield Dr | 0.61mi | 4/2.0 (+1) | 2,405 (+13%) | 1mo | $410,000 | $170 | 44 |
| 30 Patuxent Ln | 0.70mi | 3/2.0 | 1,838 (-14%) | 0mo | $325,000 | $177 | 44 |
| 34 Pritchard Dr | 0.54mi | 4/3.0 (+1) | 2,437 (+14%) | 1mo | $468,000 | $192 | 40 |
| 4 White Hurst Ln | 0.72mi | 4/3.0 (+1) | 2,350 (+10%) | 1mo | $375,000 | $160 | 40 |
Match score weights: distance 35% · size 25% · config 20% · recency 20%. Top-matched comps best support the ARV.
Projected returns pro-forma
-3.0% appreciation · 1.18% rent growth · sell at horizon
- IRR
- -18.9%
- Equity multiple
- 0.35×
- Total profit
- $-41,983
- Equity at exit
- $34,294
- IRR
- -15.9%
- Equity multiple
- 0.18×
- Total profit
- $-52,637
- Equity at exit
- $19,886
Cash invested: $64,400 (down + closing). Projections, not guarantees.
Landlord ↔ Tenant lean methodology
- Overall (STATE)
- 87 Strongly Landlord-Friendly
- State Florida
- 87 Strongly Landlord-Friendly · R+3
- County
- — inherits STATE
- City
- — inherits STATE
ZIP-level market 32164
- Home prices YoY
- -6.3%
- Rents YoY
- 1.2%
- Active inventory
- 1380
- Price-to-rent
- 8.9×
Monthly cashflow live
- Estimated rent
- $2,148 high interval (Pro) →
- Mortgage (P&I)
- −$1,206
- Tax from tax record
- −$410 /mo · $4,918/yr
- Insurance
- −$96
- HOA
- −$0
- Vacancy / Maint / Mgmt
- −$451
- Net cashflow
- $-15
Break-even live
Sensitivity live
| Price | -10% $115 | -5% $50 | +0% $-15 | +5% $-80 | +10% $-145 |
|---|---|---|---|---|---|
| Rent | -10% $-185 | -5% $-100 | +0% $-15 | +5% $70 | +10% $155 |
| Rate | -1.0pp $101 | -0.5pp $43 | base $-15 | +0.5pp $-75 | +1.0pp $-135 |
UW: 25.0% down · 7.5% · 30yr · 1.5% tax · 5.0% vac · 8.0% maint · 8.0% mgmt
Financing live
Cash to close
- Down payment
- $57,500
- Closing costs
- $6,900
- Reserves months
- —
- Total cash needed
- —
Loan-product check · same deal, 3 products live
Conventional
25% down · 7.5% · 30yr
- Down + closing
- —
- Monthly P&I
- —
- Monthly cashflow
- —
- DSCR
- —
- Eligible?
- —
Personal DTI + credit; lowest rate.
DSCR
20% down · 8.5% · 30yr
- Down + closing
- —
- Monthly P&I
- —
- Monthly cashflow
- —
- DSCR
- —
- Eligible?
- —
No personal income docs; deal must DSCR.
Hard money
10% down · 12.0% · 12mo
- Down + closing
- —
- Monthly P&I
- —
- Monthly cashflow
- —
- DSCR
- —
- Eligible?
- —
Short-term bridge; refi at stabilization.
Rent comps 33 comps
| Address | Beds | Baths | Sqft | Rent | $/sqft | DOM | Units | Dist |
|---|---|---|---|---|---|---|---|---|
| 7 Walton Pl Palm Coast, FL | 3.0 | 2.0 | 1929 | $1,975 | $1.02 | 16d | 1 | 0.31mi |
| 25 Plainview Dr Unit A Palm Coast, FL | 4.0 | 2.0 | 1486 | $1,695 | $1.14 | 16d | 1 | 0.41mi |
| 10 Warner Pl Palm Coast, FL | 3.0 | 2.0 | 1481 | $1,850 | $1.25 | 25d | 1 | 0.44mi |
| 21 Prospect Ln Unit B Palm Coast, FL | 3.0 | 2.0 | 1500 | $1,690 | $1.13 | 25d | 1 | 0.45mi |
| 155 Plainview Dr Unit B Palm Coast, FL | 3.0 | 2.0 | 1672 | $1,650 | $0.99 | 4d | 1 | 0.52mi |
| 58 Whippoorwill Dr Palm Coast, FL | 3.0 | 2.0 | 1721 | $1,950 | $1.13 | 4d | 1 | 0.59mi |
| 124 Plainview Dr Unit B Palm Coast, FL | 3.0 | 2.0 | 1600 | $1,650 | $1.03 | 4d | 1 | 0.65mi |
| 67 Parkway Dr Palm Coast, FL | 4.0 | 2.0 | 2700 | $2,100 | $0.78 | 16d | 1 | 0.73mi |
| 87 Patric Dr Palm Coast, FL | 4.0 | 3.0 | 2900 | $2,300 | $0.79 | 4d | 1 | 0.77mi |
| 107 Whispering Pine Dr Palm Coast, FL | 3.0 | 3.0 | 2507 | $2,400 | $0.96 | 13d | 1 | 0.83mi |
| 9 White Hawk Pl Palm Coast, FL | 3.0 | 2.0 | 1608 | $1,900 | $1.18 | 4d | 1 | 0.83mi |
| 38 Pine Hill Ln Palm Coast, FL | 3.0 | 2.0 | 1400 | $1,750 | $1.25 | 16d | 1 | 0.97mi |
| 38 Pinelynn Dr Palm Coast, FL | 4.0 | 2.0 | 1617 | $1,985 | $1.23 | 25d | 1 | 0.97mi |
| 5 Pine Haven Dr Palm Coast, FL | 3.0 | 2.0 | 1635 | $1,850 | $1.13 | 16d | 1 | 1.00mi |
| 113 Whippoorwill Dr Unit NA Palm Coast, FL | 3.0 | 2.0 | 1580 | $2,100 | $1.33 | 25d | 1 | 1.00mi |
| 80 Westfield Ln Palm Coast, FL | 3.0 | 2.0 | 1945 | $1,951 | $1.00 | 23d | 1 | 1.07mi |
| 18 Preston Ln Palm Coast, FL | 3.0 | 2.0 | 1832 | $2,200 | $1.20 | 4d | 1 | 1.09mi |
| 12 Wheeler Ln Palm Coast, FL | 4.0 | 2.0 | 2958 | $3,000 | $1.01 | 4d | 1 | 1.10mi |
| 14 Pitt Ln Palm Coast, FL | 3.0 | 2.0 | 1481 | $1,750 | $1.18 | 25d | 1 | 1.12mi |
| 26 Pitt Ln Palm Coast, FL | 3.0 | 2.0 | 1502 | $1,995 | $1.33 | 16d | 1 | 1.13mi |
| 11 Wheatfield Dr Palm Coast, FL | 4.0 | 2.0 | 2242 | $2,195 | $0.98 | 25d | 1 | 1.15mi |
| 11 Wheeler Ln Unit 1261594P Palm Coast, FL | 4.0 | 2.0 | 2497 | $5,248 | $2.10 | 4d | 1 | 1.16mi |
| 44 Pinetree Dr Palm Coast, FL | 3.0 | 2.0 | 2357 | $2,000 | $0.85 | 25d | 1 | 1.21mi |
| 87 Rose Dr Palm Coast, FL | 3.0 | 2.0 | 2262 | $1,925 | $0.85 | 13d | 1 | 1.22mi |
| 87 Rose Dr Palm Coast, FL | 3.0 | 2.0 | 2262 | $1,925 | $0.85 | 16d | 1 | 1.22mi |
| 60 Westover Ln Unit 1261607P Palm Coast, FL | 3.0 | 2.0 | 1894 | $3,907 | $2.06 | 4d | 1 | 1.29mi |
| 37 Pine Croft Ln Palm Coast, FL | 3.0 | 2.0 | 1832 | $2,100 | $1.15 | 4d | 1 | 1.34mi |
| 43 Waverly Ln Palm Coast, FL | 3.0 | 2.0 | 1560 | $2,100 | $1.35 | 25d | 1 | 1.36mi |
| 131 Rae Dr Palm Coast, FL | 4.0 | 2.0 | 1738 | $2,150 | $1.24 | 4d | 1 | 1.40mi |
| 4 Pin Oak Dr Palm Coast, FL | 4.0 | 2.0 | 2236 | $2,200 | $0.98 | 25d | 1 | 1.41mi |
| 121 Raintree Cir Palm Coast, FL | 3.0 | 2.0 | 1939 | $1,900 | $0.98 | 16d | 1 | 1.42mi |
| 19 Rosecroft Ln Palm Coast, FL | 3.0 | 2.5 | 1719 | $1,979 | $1.15 | 23d | 1 | 1.43mi |
| 6 Pickcane Ln Palm Coast, FL | 4.0 | 2.0 | 1500 | $2,400 | $1.60 | 4d | 1 | 1.50mi |
Listing history 15 events
-
2026-06-16statusdays on market $230,000 Pending 18 DOM
-
2026-06-15days on market $230,000 Active 17 DOM
-
2026-06-14days on market $230,000 Active 15 DOM
-
2026-06-13days on market $230,000 Active 14 DOM
-
2026-06-10days on market $230,000 Active 12 DOM
-
2026-06-09days on market $230,000 Active 11 DOM
-
2026-06-08days on market $230,000 Active 10 DOM
-
2026-06-07remarks 341-char remark
-
2026-06-07days on market $230,000 Active 9 DOM
-
2026-06-03days on market $230,000 Active 5 DOM
-
2026-06-02days on market $230,000 Active 4 DOM
-
2026-06-01days on market $230,000 Active 3 DOM
-
2026-05-31days on market $230,000 Active 2 DOM
-
2026-05-31remarks 249-char remark
-
2026-05-31$230,000 Active 1 DOM
ⓘ Source: listings_history table (triggers on properties + properties_extension) + one-shot
backfill from property_details.listing_events for pre-trigger history.
Tax reassessment forecast FL · Resets to sale price
- Current annual tax
- $4,918 · $410/mo
- Projected year-2 tax
- $4,918 · $410/mo
- Expected delta
- $0/yr ($0/mo · 0.0%)
ⓘ Screening estimate from a state-policy table — verify with the county assessor before closing.
Climate risk First Street
- Flood 1/10 Low FEMA zone X (unshaded) · 0% chance over 30 yrs
- Wildfire 1/10 Low
- Heat 9/10 Extreme 7 d/yr ≥106°F today · 21 d/yr by 30 yrs out
- Wind 10/10 Extreme 99% chance of damaging wind over 30 yrs
- Air quality 2/10 Low 2 unhealthy d/yr today · 2 by 30 yrs out
Nearby sold comps map
Loading sold comps map…
Walkable amenities ~0.75 mi
Loading nearby amenities…
Taxation est. · year 1
- Rental income
- $25,773
- − Mortgage interest
- −$12,884
- − Property taxes
- −$4,918
- − Insurance
- −$1,150
- − Repairs & maintenance
- −$2,062
- − Management
- −$2,062
- − Depreciation
- −$6,691
- Taxable loss
- −$3,992
- Est. tax savings @ 24.0%
- +$958
- After-tax cash flow
- $778/yr
For passive investors: Depreciation is non-cash, so a rental often shows a tax loss while cash-flowing — sheltering income. Rental losses are passive: they offset passive income freely, and up to $25,000/yr can offset ordinary (W-2) income if you actively participate and your MAGI is under $100k (phasing out to $0 by $150k); unused losses carry forward. On sale, claimed depreciation is recaptured at up to 25%, and gains may owe capital-gains tax (a 1031 exchange can defer both). Figures are a year-1 estimate at your 24.0% rate — not tax advice; consult a CPA.
Schools (NCES district)
- District
- Flagler
- NCES district ID
- 1200540
- Math proficiency
- 53% ▼ -9.00%
- Reading proficiency
- 56% ▼ -4.00%
- Median HH income
- $48,354
- Composite
- 46.35/100
- National rank
- #2464
- State rank
- #20 of 73 in FL
Livability — Palm Coast
- Score
- 69/100
- State rank
- #478
- US rank
- #8721
Category grades
Schools grade is shown separately in the Schools card above.
Census & demographics
- Census place
- Palm Coast, FL
- County
- Flagler County · 113,412 people
- City population
- 105,049
- Metro
- Deltona-Daytona Beach-Ormond Beach, FL
- Population (ZIP)
- 56,658
- Household income
- $76,399
- Rent vs Own
- Severe rent burden
- 1291.0
Population outlook (Flagler County) Hauer SSP2
- Today (2025)
- 123,474 people
- By 2030
- 131,864 · +6.8%
- By 2040
- 146,176 · +18.4%
- By 2050
- 157,398 · +27.5%
- By 2075
- 177,990 · +44.2%
- By 2100
- 183,381 · +48.5%
Race, ethnicity, and origin ACS 2023
- Neighborhood character
- Predominantly White (65%)
- Race & ethnicity
- White 65% Hispanic / Latino 14% Black 13% Two or more races 8% Asian 2%
- Hispanic origin (detail)
- Mexican 4% Puerto Rican 4% Cuban 2%
- Common ancestry
- Romanian 3% Russian 2% Slovak 2%
- Foreign-born
- 16% · Canada, Jamaica
- Languages at home
- 81% English-only · Spanish 9% Russian/Polish/Slavic 3% Other Indo-European 3%
Political lean MEDSL · Flagler
- 2024 margin
- Strong R (+28.2) · D 35.6% · R 63.8%
- 2008→2024 swing
- -29.8pp toward R · 2008: 1.6pp · 2024: -28.2pp
- All cycles
- 2024: R+28.2 2020: R+20.8 2016: R+20.6 2012: R+7.4 2008: D+1.6
Not yet ingested
- Civics
- —
Market trends
- HPI YoY
- ▼ -19.89%
- Current HPI
- 297.4942
- Rent YoY
- ▲ 1.18%
- Metro
- Deltona-Daytona Beach-Ormond Beach, FL
- State GDP YoY
- ▲ 3.28%
- F500 in state
- 36
Industry mix (Fortune 500 HQ in FL)
| Industry | F500 HQs | Revenue |
|---|---|---|
| Industrial Technology | 2 | $29B |
|
||
| Insurance | 2 | $17B |
|
||
| Retail | 1 | $60B |
|
||
| Technology Distribution | 1 | $58B |
|
||
| Homebuilding | 1 | $35B |
|
||
| Technology Manufacturing | 1 | $35B |
|
||
Price history
+1433.3% since first listed5 events — show timeline
- 2026-05-29 Listed $230,000 Stellar MLS as Distributed by MLS Grid
- 2021-11-02 Sold (Public Records) $395,000 Public Records
- 2021-11-01 Sold (MLS) $395,000 Stellar MLS as Distributed by MLS Grid
- 2021-09-23 Listed $389,900 Stellar MLS as Distributed by MLS Grid
- 2002-08-15 Sold (Public Records) $15,000 Public Records
Property tax history
+7.9%/yrLatest (2025): $4,918 · +2.4% YoY. Source: county tax records.
Cash-flow waterfall
monthlySold comps — $/sqft
last 12 mo · ≤1 miLoading sold comps…