171 Ridley St · Marion, NC
Flood risk 1/10 · Minimal
- FEMA flood zone
- X (unshaded)
- Chance of flooding over 30 yrs
- 0.0%
- Est. flood insurance / yr
- $507 – $1,088
Fire risk 4/10 · Minor
- Est. fire insurance / yr
- $906 – $1,684
Heat risk 5/10 · Moderate
- Hot days now (above 102°F)
- 7 days/yr
- Hot days in 30 yrs
- 18 days/yr
Wind risk 2/10 · Minimal
- Chance of severe wind over 30 yrs
- —
Air-quality risk 3/10 · Minor
- Unhealthy air days now
- 3 days/yr
- Unhealthy air days in 30 yrs
- 4 days/yr
Risk factors via First Street. Map © Google.
Why this score? — see what drove the B- grade
The composite is a weighted blend of 9 inputs, each scored 0–100. Each bar is that input's sub-score; the figure is the points it added to the 100-point composite (weight × sub-score).
- Cash flow +30.0/30.0
- 1% rule +10.0/10.0
- DSCR +10.0/10.0
- ARV discount +7.5/15.0
- Livability +3.6/5.0
- Schools +3.4/10.0
- Rent growth +2.5/5.0
- Condition / age +1.0/5.0
- Appreciation +0.0/10.0
$45,000
🖨 Deal sheet (PDF) 📄 Offer letter ✓ Due diligence
Listing remarks
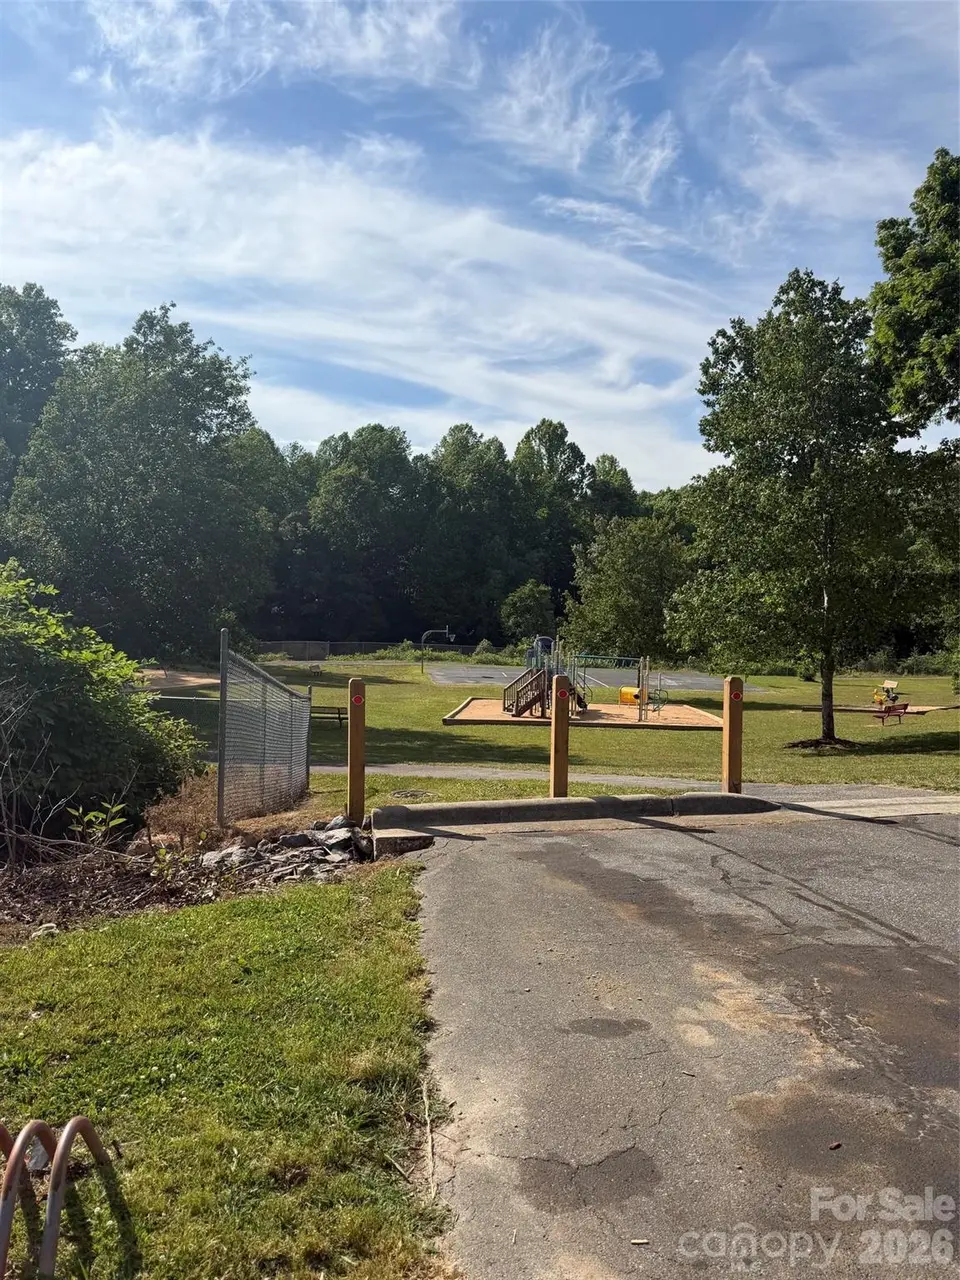
Attention investors. Cash transaction only. Convenient city location adjoining a community park and located at the end of private road. Property is level and has city water and city sewer and an older singlewide mobile home in need of repair. You also have a small outbuilding on the lot. You are close to town, shopping, medical facilities and only a short drive to I-40. Buyer may prefer to remove the singlewide and use the lot for another home. If you have been looking for a lot that has water/sewer check this 1+/-acre lot out.
Key facts
- Private road
- Community park
- City water
Tags
Property features AI
Finance
- HOA & community: No HOA
Exterior
- Parking: Driveway
- Utilities: City water; Public sewer; Electricity connected
- Home design: Manufactured singlewide home; Single-story; Pillar/post/pier foundation
- Construction: Aluminum exterior construction; Manufactured construction type
- Exterior features: Cleared, open lot; Gravel and paved road access; Publicly maintained road
Interior
- Kitchen: Electric range
- Bedrooms: Two bedrooms on the main level
- Bathrooms: Two full bathrooms on the main level
- Heating & cooling: Electric heating; Electric cooling
- Interior features: One main living room (1 room total); Electric water heater
- Laundry & utility: Electric dryer hookup
Neighborhood map
What this means for you Summary
Snapshot
- This is a 2-bed/2.0-bath single-family listed at $45k. Condition is rated poor.
Deal economics
- At list price, monthly cash flow is $533 ($6k/yr) — positive.
- The deal already cash-flows at list — no discount required.
- Meets the 1% rule at list price ($1k rent vs $45k).
- Cap rate 20.5% vs local median 3.3% in Marion — top-decile yield for the area; either an underpriced asset or a hidden risk that comps aren't pricing in. Stress-test before assuming the spread holds.
Location & tenants
- Location reads 72/100 on livability (#93 in NC) — a middle-class / working-renter tenant base. Strengths: cost of living A+, housing A+, health & safety A+; Watch: crime D+, amenities F, commute F.
- Mcdowell County Schools (rural): math 35% / reading 46% proficiency, ranked #115 of 178 in NC (top 65%) — families likely to look elsewhere, expect single-tenant / working-renter base with shorter leases.
- Zoned schools: Marion Elementary School (math 52% / reading 42%, grade D-, #497 of 1,410 statewide, top 38%, 355 students, 76% FRL); Mcdowell High School (math 50% / reading 57%, grade C-, #279 of 535 statewide, top 52%, 1,416 students, 60% FRL).
- Market conditions: 266 active listings in the ZIP; 2 comparable units currently listed for rent nearby; 175 units permitted in McDowell County in 2024 (0 in 5+ unit buildings).
Forward outlook
- Local home prices are declining (-3.0%/yr); year-one equity from $311 of loan paydown is wiped out by about $1k of value loss. Plan a longer hold.
- McDowell County population projected at -11% by 2050 — secular population decline; favor cash flow + early exit over multi-decade hold.
- At projected returns (-3.0% appreciation + 3.0% rent growth), your $13k cash investment doubles in ~3 years — after that, you're playing with house money.
Negotiation context
- Only 10 days on market — expect competitive offers; lowballing is unlikely to land.
Risks & watch-outs
- Watch-outs: built in 1900 — expect roof / HVAC / electrical / plumbing capex.
- Climate carrying-cost: extreme-heat days projected 7→18/yr by 2055 (HVAC capex compounding) — expect insurance premiums to compound above CPI over the hold.
Questions for the listing agent
- Have any recent inspections been done? Can we get a copy of the seller's disclosures and any deferred-maintenance estimates?
- Built in 1900 — when were the roof, HVAC, electrical panel, plumbing, and water heater last replaced?
- Is there a deadline driving the sale (1031 exchange, divorce, estate, relocation)? That informs how much negotiation room exists.
- Schools are D-rated, which usually means shorter tenancies and higher turnover. Who's the typical renter profile here, and what's been the actual vacancy rate?
- Crime grade is D in this area — have there been break-ins, vandalism, or insurance claims at this property in the last 3 years? What carrier currently insures it and at what premium?
- What's the average days-on-market for RENTAL listings here right now (not sales)? A rising rental-DOM trend means longer vacancies and softer asking-rent achievability than the comps imply.
- What's the recent tenant-quality profile in this submarket — average credit score on applications, eviction rate, late-payment / NSF rate, and stable-employment percentage? A property-management company in the area should have these aggregated.
- How much new for-sale + rental construction is in the pipeline within 1–3 miles? Heavy new supply typically softens prices + rents 12–24 months out; constrained supply supports both.
Investment metrics
- 1% rule
- 2.37% ✓
- Cap rate
- 20.51%
- Cash-on-cash
- 50.78%
- DSCR
- 3.26
- GRM
- 3.5
CMA / ARV
- ARV (on-the-fly)
- $133,980
- Comps found
- 9
Show comp detail 9 sales within ~0.75 mi
| Address | Dist | Beds/Ba | Sqft | Sold | Price | $/sf | Match |
|---|---|---|---|---|---|---|---|
| 61 W Woodlawn St | 0.15mi | 2/2.0 | 1,000 (+8%) | 8mo | $145,000 | $145 | 73 |
| 19 Thole St | 0.31mi | 2/1.0 | 970 (+5%) | 2mo | $128,000 | $132 | 72 |
| 1580 W Tate St | 0.32mi | 2/1.5 | 971 (+5%) | 7mo | $283,500 | $292 | 69 |
| 45 Gladden St | 0.47mi | 1/1.0 (-1) | 905 (-2%) | 6mo | $64,750 | $72 | 61 |
| 105 Summit St | 0.57mi | 2/1.0 | 912 (-1%) | 10mo | $80,000 | $88 | 59 |
| 20 W Cross St | 0.50mi | 2/1.0 | 962 (+4%) | 13mo | $245,000 | $255 | 55 |
| 129 Summit St | 0.56mi | 2/1.0 | 815 (-12%) | 10mo | $80,000 | $98 | 42 |
| 11 Beck St | 0.55mi | 2/1.0 | 864 (-6%) | 22mo | $140,000 | $162 | 41 |
| 188 California Ave | 0.42mi | 2/1.0 | 798 (-14%) | 23mo | $215,000 | $269 | 34 |
Match score weights: distance 35% · size 25% · config 20% · recency 20%. Top-matched comps best support the ARV.
Projected returns pro-forma
-3.0% appreciation · 3.0% rent growth · sell at horizon
- IRR
- 48.6%
- Equity multiple
- 3.12×
- Total profit
- $26,680
- Equity at exit
- $6,710
- IRR
- 54.2%
- Equity multiple
- 6.32×
- Total profit
- $67,022
- Equity at exit
- $3,891
Cash invested: $12,600 (down + closing). Projections, not guarantees.
Landlord ↔ Tenant lean methodology
- Overall (STATE)
- 85 Strongly Landlord-Friendly
- State North Carolina
- 85 Strongly Landlord-Friendly · R+3
- County
- — inherits STATE
- City
- — inherits STATE
ZIP-level market 28752
- Active inventory
- 266
- Price-to-rent
- 3.5×
Monthly cashflow live
- Estimated rent
- $1,069 medium interval (Pro) →
- Mortgage (P&I)
- −$236
- Tax est. 1.5%
- −$56 /mo · $675/yr
- Insurance
- −$19
- HOA
- −$0
- Vacancy / Maint / Mgmt
- −$224
- Net cashflow
- $533
Break-even live
Sensitivity live
| Price | -10% $564 | -5% $549 | +0% $533 | +5% $518 | +10% $502 |
|---|---|---|---|---|---|
| Rent | -10% $449 | -5% $491 | +0% $533 | +5% $575 | +10% $618 |
| Rate | -1.0pp $556 | -0.5pp $545 | base $533 | +0.5pp $521 | +1.0pp $510 |
UW: 25.0% down · 7.5% · 30yr · 1.5% tax · 5.0% vac · 8.0% maint · 8.0% mgmt
Financing live
Cash to close
- Down payment
- $11,250
- Closing costs
- $1,350
- Reserves months
- —
- Total cash needed
- —
Loan-product check · same deal, 3 products live
Conventional
25% down · 7.5% · 30yr
- Down + closing
- —
- Monthly P&I
- —
- Monthly cashflow
- —
- DSCR
- —
- Eligible?
- —
Personal DTI + credit; lowest rate.
DSCR
20% down · 8.5% · 30yr
- Down + closing
- —
- Monthly P&I
- —
- Monthly cashflow
- —
- DSCR
- —
- Eligible?
- —
No personal income docs; deal must DSCR.
Hard money
10% down · 12.0% · 12mo
- Down + closing
- —
- Monthly P&I
- —
- Monthly cashflow
- —
- DSCR
- —
- Eligible?
- —
Short-term bridge; refi at stabilization.
Rent comps 2 comps
| Address | Beds | Baths | Sqft | Rent | $/sqft | DOM | Units | Dist |
|---|---|---|---|---|---|---|---|---|
| 26 Reid St Unit 2 Marion, NC | 2.0 | 1.5 | 664 | $1,250 | $1.88 | 14d | 1 | 0.42mi |
| 838 Spaulding Rd Marion, NC | 2.0–3.0 | 2.0–3.0 | 1058 | $777 | $0.73 | 14d | 7 | 0.82mi |
Listing history 9 events
-
2026-06-19days on market $45,000 Active 10 DOM
-
2026-06-18days on market $45,000 Active 9 DOM
-
2026-06-17days on market $45,000 Active 8 DOM
-
2026-06-16days on market $45,000 Active 7 DOM
-
2026-06-15days on market $45,000 Active 6 DOM
-
2026-06-14days on market $45,000 Active 4 DOM
-
2026-06-13days on market $45,000 Active 3 DOM
-
2026-06-10remarks 533-char remark
-
2026-06-10$45,000 Active 1 DOM
ⓘ Source: listings_history table (triggers on properties + properties_extension) + one-shot
backfill from property_details.listing_events for pre-trigger history.
Climate risk First Street
- Flood 1/10 Low FEMA zone X (unshaded) · 0% chance over 30 yrs
- Wildfire 4/10 Moderate
- Heat 5/10 Major 7 d/yr ≥102°F today · 18 d/yr by 30 yrs out
- Wind 2/10 Low
- Air quality 3/10 Moderate 3 unhealthy d/yr today · 4 by 30 yrs out
Nearby sold comps map
Loading sold comps map…
Walkable amenities ~0.75 mi
Loading nearby amenities…
Taxation est. · year 1
- Rental income
- $12,822
- − Mortgage interest
- −$2,521
- − Property taxes
- −$675
- − Insurance
- −$225
- − Repairs & maintenance
- −$1,026
- − Management
- −$1,026
- − Depreciation
- −$1,309
- Taxable income
- $6,041
- Est. tax owed @ 24.0%
- −$1,450
- After-tax cash flow
- $4,948/yr
For passive investors: Depreciation is non-cash, so a rental often shows a tax loss while cash-flowing — sheltering income. Rental losses are passive: they offset passive income freely, and up to $25,000/yr can offset ordinary (W-2) income if you actively participate and your MAGI is under $100k (phasing out to $0 by $150k); unused losses carry forward. On sale, claimed depreciation is recaptured at up to 25%, and gains may owe capital-gains tax (a 1031 exchange can defer both). Figures are a year-1 estimate at your 24.0% rate — not tax advice; consult a CPA.
Condition & rehab AI · 10 photos
This property requires extensive repairs and maintenance, including roof replacement, exterior paint, and foundation repair. Landscaping and curb appeal improvements would significantly enhance its resale and rental value.
Repairs flagged
- Major Mobile home roof — Visible rust and wear
- Major Mobile home exterior — Visible rust and wear
- Major Mobile home foundation — Visible rust and wear
- Major Mobile home windows — Visible rust and wear
- Major Mobile home doors — Visible rust and wear
- Major Mobile home siding — Visible rust and wear
Value-add opportunities
- Both Mobile home roof replacement — Improves both resale and rental value
- Both Mobile home exterior paint — Improves both resale and rental value
- Both Mobile home windows and doors — Improves both resale and rental value
- Both Mobile home foundation repair — Improves both resale and rental value
- Both Mobile home siding repair — Improves both resale and rental value
- Both Landscaping and curb appeal — Improves both resale and rental value
Renovation cost estimate screening
| Repair item | Severity | Est. cost |
|---|---|---|
| Mobile home roof · Visible rust and wear | Major | $15,000–50,000 |
| Mobile home exterior · Visible rust and wear | Major | $15,000–50,000 |
| Mobile home foundation · Visible rust and wear | Major | $15,000–50,000 |
| Mobile home windows · Visible rust and wear | Major | $15,000–50,000 |
| Mobile home doors · Visible rust and wear | Major | $15,000–50,000 |
| Mobile home siding · Visible rust and wear | Major | $15,000–50,000 |
| Total estimated repair cost · 12 items | $180,000–600,000 |
Value-add ROI direction
- Both Mobile home roof replacement — Improves both resale and rental value ↑
- Both Mobile home exterior paint — Improves both resale and rental value ↑
- Both Mobile home windows and doors — Improves both resale and rental value ↑
- Both Mobile home foundation repair — Improves both resale and rental value ↑
- Both Mobile home siding repair — Improves both resale and rental value ↑
- Both Landscaping and curb appeal — Improves both resale and rental value ↑
ⓘ Cost ranges are severity-bucket heuristics (US national rule-of-thumb). Get contractor quotes + a written scope before underwriting a rehab budget.
Schools (NCES district)
- District
- Mcdowell County Schools
- NCES district ID
- 3702940
- Math proficiency
- 35% ▼ -3.00%
- Reading proficiency
- 46% ▬ 0.00%
- Median HH income
- $36,769
- Composite
- 33.6/100
- National rank
- #5413
- State rank
- #115 of 178 in NC
Livability — Marion
- Score
- 72/100
- State rank
- #93
- US rank
- #6157
Category grades
Schools grade is shown separately in the Schools card above.
Census & demographics
- Census place
- Marion, NC
- City population
- 30,602
- Population (ZIP)
- 30,602
Population outlook (McDowell County) Hauer SSP2
- Today (2025)
- 44,615 people
- By 2030
- 44,002 · -1.4%
- By 2040
- 42,285 · -5.2%
- By 2050
- 39,906 · -10.6%
- By 2075
- 34,396 · -22.9%
- By 2100
- 27,970 · -37.3%
Race, ethnicity, and origin ACS 2023
- Neighborhood character
- Predominantly White (83%)
- Race & ethnicity
- White 83% Hispanic / Latino 9% Two or more races 5% Black 5% Asian 2%
- Hispanic origin (detail)
- Mexican 6%
- Common ancestry
- Serbian 4% Slovak 2% Iranian 1%
- Foreign-born
- 5% · Canada, Vietnam
- Languages at home
- 90% English-only · Spanish 8% German/W. Germanic 1% Vietnamese 1%
Political lean MEDSL · McDowell
- 2024 margin
- Solid R (+49.2) · D 25.1% · R 74.2%
- 2008→2024 swing
- -22.2pp toward R · 2008: -27.0pp · 2024: -49.2pp
- All cycles
- 2024: R+49.2 2020: R+48.0 2016: R+50.5 2012: R+31.9 2008: R+27.0
Not yet ingested
- Civics
- —
Market trends
- HPI YoY
- ▼ -108.41%
- Current HPI
- 182.9225
- Rent YoY
- —
- Metro
- —
- State GDP YoY
- ▲ 3.28%
- F500 in state
- 26
Industry mix (Fortune 500 HQ in NC)
| Industry | F500 HQs | Revenue |
|---|---|---|
| Financial Services | 2 | $213B |
|
||
| Retail | 2 | $95B |
|
||
| Industrial Conglomerate | 1 | $38B |
|
||
| Metals / Steel | 1 | $35B |
|
||
| Utilities | 1 | $30B |
|
||
| Industrial Machinery | 1 | $19B |
|
||
Price history
1 event — show timeline
- 2026-06-09 Listed $45,000 CANOPYMLS as Distributed by MLS Grid
Cash-flow waterfall
monthlySold comps — $/sqft
last 12 mo · ≤1 miLoading sold comps…