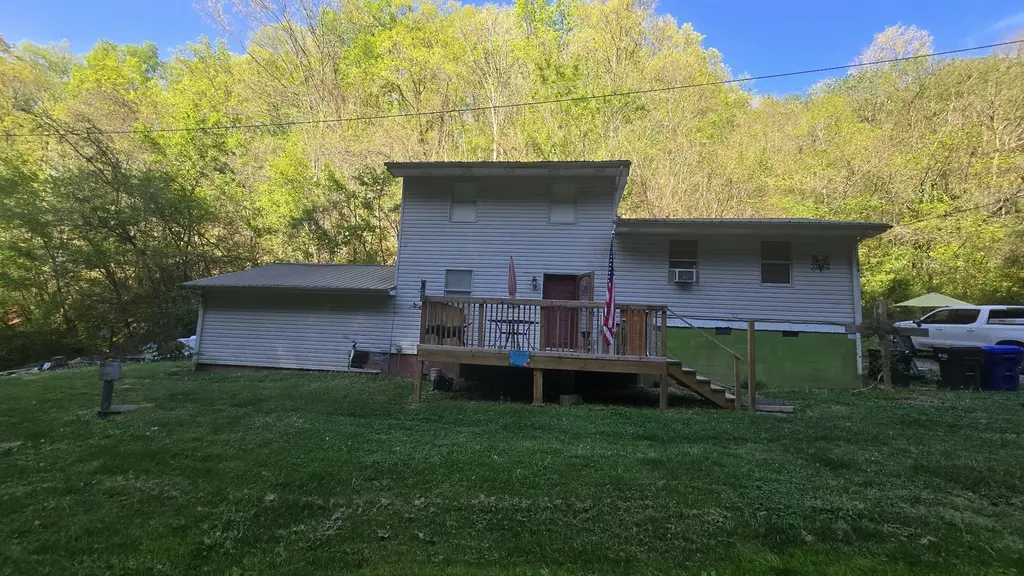
394 Jim Town Rd · Luttrell, TN
Flood risk 10/10 · Severe
- FEMA flood zone
- X (unshaded)
- Chance of flooding over 30 yrs
- 1.0%
- Est. flood insurance / yr
- $473 – $860
Fire risk 6/10 · Moderate
- Est. fire insurance / yr
- $949 – $1,763
Heat risk 4/10 · Minor
- Hot days now (above 101°F)
- 7 days/yr
- Hot days in 30 yrs
- 19 days/yr
Wind risk 2/10 · Minimal
- Chance of severe wind over 30 yrs
- 1.0%
Air-quality risk 4/10 · Minor
- Unhealthy air days now
- 3 days/yr
- Unhealthy air days in 30 yrs
- 5 days/yr
Risk factors via First Street. Map © Google.
Why this score? — see what drove the C+ grade
The composite is a weighted blend of 9 inputs, each scored 0–100. Each bar is that input's sub-score; the figure is the points it added to the 100-point composite (weight × sub-score).
- Cash flow +28.4/30.0
- DSCR +10.0/10.0
- 1% rule +6.6/10.0
- Appreciation +6.5/10.0
- Livability +2.8/5.0
- Rent growth +2.5/5.0
- Condition / age +2.5/5.0
- ARV discount +1.9/15.0
- Schools +1.4/10.0
$160,000
🖨 Deal sheet (PDF) 📄 Offer letter ✓ Due diligence
Listing remarks
Great opportunity in Luttrell! This property offers room to update and add value. Situated on a spacious, wooded lot, it’s ideal for investors or buyers looking to customize. Includes a 3-bedroom, 2 full bath trailer with wheelchair access—great for rental income or multi-generational living. Convenient yet private rural setting. SOLD AS-IS. ALL MEASUREMENTS ARE ESTIMATES AND MUST BE VERIFIED.
Key facts
- Wheelchair access
- Wooded lot
- Rural setting
Tags
Neighborhood map
What this means for you Summary
Snapshot
- This is a 3-bed/1.0-bath single-family listed at $160k.
Deal economics
- At list price, monthly cash flow is $464 ($6k/yr) — positive.
- The deal already cash-flows at list — no discount required.
- Meets the 1% rule at list price ($2k rent vs $160k).
Location & tenants
- Location reads 56/100 on livability (#344 in TN) — a working-class tenant base; expect higher turnover. Strengths: cost of living A+, housing A+, crime B+; Watch: amenities F, commute F, employment F.
- Union County (rural): math 14% / reading 19% proficiency, ranked #127 of 139 in TN (top 91%) — low school quality limits family demand, transient renter base, plan for 1-2y turnover.
- Zoned schools: Luttrell Elementary (math 12% / reading 17%, grade F, #753 of 952 statewide, top 81%, 295 students, 0% FRL); H Maynard Middle School (math 14% / reading 18%, grade F, #223 of 333 statewide, top 68%, 656 students, 0% FRL); Union County High School (math 12% / reading 27%, grade F, #197 of 332 statewide, top 60%, 819 students, 0% FRL) — zoned schools average 0% FRL vs 54% district-wide (54 pts lower); this property's tenant base skews higher-income than the district average.
- Market conditions: 22 active listings in the ZIP; 1 comparable units currently listed for rent nearby; 134 units permitted in Union County in 2024 (0 in 5+ unit buildings).
Forward outlook
- In year one you build about $6k of equity ($1k loan paydown + $5k appreciation (3.1% local appreciation)).
- Union County population projected at -12% by 2050 — secular population decline; favor cash flow + early exit over multi-decade hold.
- At projected returns (3.1% appreciation + 3.0% rent growth), your $45k cash investment doubles in ~4 years — after that, you're playing with house money.
- By year 6, paydown + projected appreciation supports a ~$32k cash-out refi (75% LTV) — recoverable capital for the next deal without selling this one.
Negotiation context
- Only 9 days on market — expect competitive offers; lowballing is unlikely to land.
- Current owner paid $30k; list at $160k implies a 433% gain — meaningful room to come down on a strong offer.
Risks & watch-outs
- Watch-outs: flood insurance adds $56/mo.
- Climate carrying-cost: severe flood risk; major wildfire risk — expect insurance premiums to compound above CPI over the hold.
Questions for the listing agent
- What's the actual annual flood-insurance premium (NFIP or private), and is the property in a SFHA with mandatory coverage?
- Is there a deadline driving the sale (1031 exchange, divorce, estate, relocation)? That informs how much negotiation room exists.
- Schools are F-rated, which usually means shorter tenancies and higher turnover. Who's the typical renter profile here, and what's been the actual vacancy rate?
- What's the average days-on-market for RENTAL listings here right now (not sales)? A rising rental-DOM trend means longer vacancies and softer asking-rent achievability than the comps imply.
- What's the recent tenant-quality profile in this submarket — average credit score on applications, eviction rate, late-payment / NSF rate, and stable-employment percentage? A property-management company in the area should have these aggregated.
- How much new for-sale + rental construction is in the pipeline within 1–3 miles? Heavy new supply typically softens prices + rents 12–24 months out; constrained supply supports both.
Investment metrics
- 1% rule
- 1.16% ✓
- Cap rate
- 10.19%
- Cash-on-cash
- 13.91%
- DSCR
- 1.62
- GRM
- 7.2
CMA / ARV
- ARV (on-the-fly)
- $142,362
- Comps found
- 1
Show comp detail 1 sale within ~0.75 mi
| Address | Dist | Beds/Ba | Sqft | Sold | Price | $/sf | Match |
|---|---|---|---|---|---|---|---|
| 216 Grace Ave | 0.56mi | 3/2.0 | 1,568 (+9%) | 24mo | $156,000 | $99 | 35 |
Match score weights: distance 35% · size 25% · config 20% · recency 20%. Top-matched comps best support the ARV.
Projected returns pro-forma
3.08% appreciation · 3.0% rent growth · sell at horizon
- IRR
- 19.3%
- Equity multiple
- 2.10×
- Total profit
- $49,478
- Equity at exit
- $72,701
- IRR
- 20.5%
- Equity multiple
- 3.99×
- Total profit
- $133,844
- Equity at exit
- $112,633
Cash invested: $44,800 (down + closing). Projections, not guarantees.
Landlord ↔ Tenant lean methodology
- Overall (STATE)
- 87 Strongly Landlord-Friendly
- State Tennessee
- 87 Strongly Landlord-Friendly · R+13
- County
- — inherits STATE
- City
- — inherits STATE
ZIP-level market 37779
- Home prices YoY
- 0.8%
- Active inventory
- 22
- Price-to-rent
- 7.2×
Monthly cashflow live
- Estimated rent
- $1,850 medium interval (Pro) →
- Mortgage (P&I)
- −$839
- Tax from tax record
- −$37 /mo · $439/yr
- Insurance
- −$67
- Flood insurance flood zone
- −$56 /mo · $666/yr
- HOA
- −$0
- Vacancy / Maint / Mgmt
- −$388
- Net cashflow
- $464
Break-even live
Sensitivity live
| Price | -10% $554 | -5% $509 | +0% $464 | +5% $418 | +10% $373 |
|---|---|---|---|---|---|
| Rent | -10% $318 | -5% $391 | +0% $464 | +5% $537 | +10% $610 |
| Rate | -1.0pp $544 | -0.5pp $504 | base $464 | +0.5pp $422 | +1.0pp $380 |
UW: 25.0% down · 7.5% · 30yr · 1.5% tax · 5.0% vac · 8.0% maint · 8.0% mgmt
Financing live
Cash to close
- Down payment
- $40,000
- Closing costs
- $4,800
- Reserves months
- —
- Total cash needed
- —
Loan-product check · same deal, 3 products live
Conventional
25% down · 7.5% · 30yr
- Down + closing
- —
- Monthly P&I
- —
- Monthly cashflow
- —
- DSCR
- —
- Eligible?
- —
Personal DTI + credit; lowest rate.
DSCR
20% down · 8.5% · 30yr
- Down + closing
- —
- Monthly P&I
- —
- Monthly cashflow
- —
- DSCR
- —
- Eligible?
- —
No personal income docs; deal must DSCR.
Hard money
10% down · 12.0% · 12mo
- Down + closing
- —
- Monthly P&I
- —
- Monthly cashflow
- —
- DSCR
- —
- Eligible?
- —
Short-term bridge; refi at stabilization.
Rent comps 1 comps
| Address | Beds | Baths | Sqft | Rent | $/sqft | DOM | Units | Dist |
|---|---|---|---|---|---|---|---|---|
| 3135 Tennessee 61 Luttrell, TN | 3.0 | 1.0 | 1120 | $1,850 | $1.65 | 16d | 1 | 1.04mi |
Listing history 4 events
-
2026-04-27status Pending
-
2026-04-18$160,000 Active
-
1994-01-17soldstatus $30,000
-
1988-05-24soldstatus $20,000
ⓘ Source: listings_history table (triggers on properties + properties_extension) + one-shot
backfill from property_details.listing_events for pre-trigger history.
Tax reassessment forecast TN · Resets to sale price
- Current annual tax
- $439 · $37/mo
- Projected year-2 tax
- $1,136 · $95/mo
- Expected delta
- +$697/yr (+$58/mo · 158.8%)
ⓘ Screening estimate from a state-policy table — verify with the county assessor before closing.
Climate risk First Street
- Flood 10/10 Extreme FEMA zone X (unshaded) · 100% chance over 30 yrs
- Wildfire 6/10 Major
- Heat 4/10 Moderate 7 d/yr ≥101°F today · 19 d/yr by 30 yrs out
- Wind 2/10 Low 100% chance of damaging wind over 30 yrs
- Air quality 4/10 Moderate 3 unhealthy d/yr today · 5 by 30 yrs out
Nearby sold comps map
Loading sold comps map…
Walkable amenities ~0.75 mi
Loading nearby amenities…
Taxation est. · year 1
- Rental income
- $22,200
- − Mortgage interest
- −$8,962
- − Property taxes
- −$439
- − Insurance
- −$1,466
- − Repairs & maintenance
- −$1,776
- − Management
- −$1,776
- − Depreciation
- −$4,655
- Taxable income
- $3,125
- Est. tax owed @ 24.0%
- −$750
- After-tax cash flow
- $4,814/yr
For passive investors: Depreciation is non-cash, so a rental often shows a tax loss while cash-flowing — sheltering income. Rental losses are passive: they offset passive income freely, and up to $25,000/yr can offset ordinary (W-2) income if you actively participate and your MAGI is under $100k (phasing out to $0 by $150k); unused losses carry forward. On sale, claimed depreciation is recaptured at up to 25%, and gains may owe capital-gains tax (a 1031 exchange can defer both). Figures are a year-1 estimate at your 24.0% rate — not tax advice; consult a CPA.
Schools (NCES district)
- District
- Union County
- NCES district ID
- 4704290
- Math proficiency
- 14% ▼ -7.00%
- Reading proficiency
- 19% ▼ -5.00%
- Median HH income
- $35,598
- Composite
- 13.62/100
- National rank
- #9507
- State rank
- #127 of 139 in TN
Livability — Luttrell
- Score
- 56/100
- State rank
- #344
- US rank
- #22797
Category grades
Schools grade is shown separately in the Schools card above.
Census & demographics
- Census place
- Luttrell, TN
- City population
- 3,443
- Population (ZIP)
- 3,443
Population outlook (Union County) Hauer SSP2
- Today (2025)
- 19,073 people
- By 2030
- 18,888 · -1.0%
- By 2040
- 18,090 · -5.2%
- By 2050
- 16,693 · -12.5%
- By 2075
- 12,894 · -32.4%
- By 2100
- 8,564 · -55.1%
Race, ethnicity, and origin ACS 2023
- Neighborhood character
- Predominantly White (94%)
- Race & ethnicity
- White 94% Hispanic / Latino 4% Two or more races 2%
- Common ancestry
- Portuguese 3% Iranian 2% Slovak 2%
- Foreign-born
- 0% · Canada
- Languages at home
- 99% English-only · Spanish 1%
Political lean MEDSL · Union
- 2024 margin
- Solid R (+71.2) · D 14.0% · R 85.2%
- 2008→2024 swing
- -29.9pp toward R · 2008: -41.2pp · 2024: -71.2pp
- All cycles
- 2024: R+71.2 2020: R+68.4 2016: R+64.7 2012: R+48.2 2008: R+41.2
Not yet ingested
- Civics
- —
Market trends
- HPI YoY
- ▲ 3.08%
- Current HPI
- 414.9524
- Rent YoY
- —
- Metro
- —
- State GDP YoY
- ▲ 2.78%
- F500 in state
- 22
Industry mix (Fortune 500 HQ in TN)
| Industry | F500 HQs | Revenue |
|---|---|---|
| Healthcare | 3 | $91B |
|
||
| Retail | 3 | $72B |
|
||
| Transportation / Logistics | 1 | $88B |
|
||
| Paper / Packaging | 1 | $19B |
|
||
| Insurance | 1 | $13B |
|
||
| Energy | 1 | $12B |
|
||
Price history
+700.0% since first listed4 events — show timeline
- 2026-04-27 Pending — REALTRACS as Distributed by MLS Grid
- 2026-04-18 Listed $160,000 REALTRACS as Distributed by MLS Grid
- 1994-01-17 Sold (Public Records) $30,000 Public Records
- 1988-05-24 Sold (Public Records) $20,000 Public Records
Property tax history
-2.7%/yrLatest (2025): $439 · +0.0% YoY. Source: county tax records.
Cash-flow waterfall
monthlySold comps — $/sqft
last 12 mo · ≤1 miLoading sold comps…