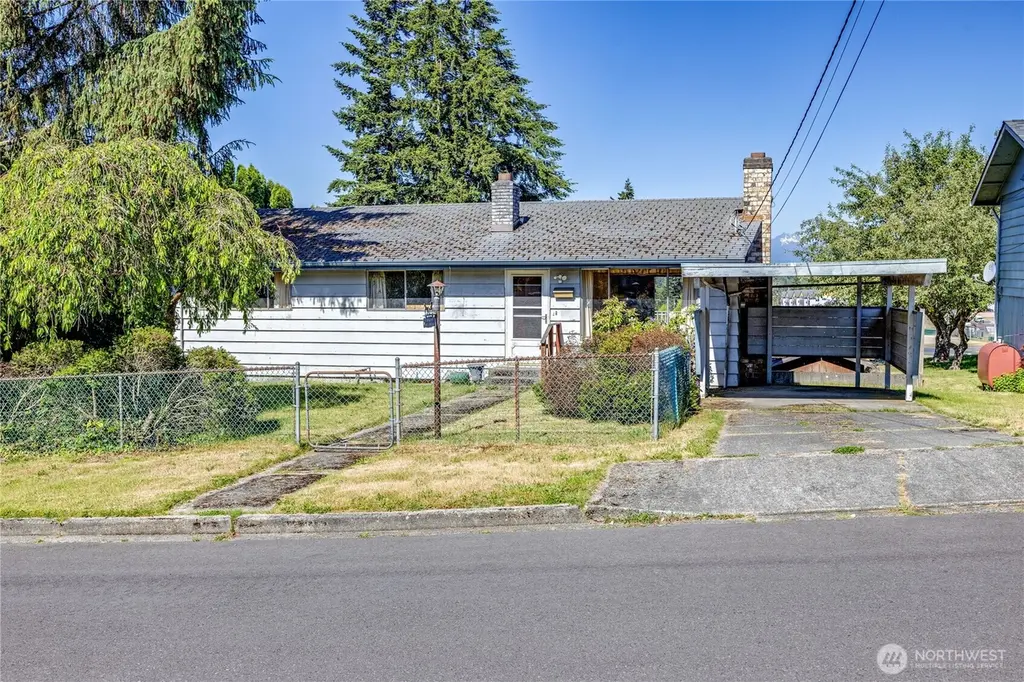
3245 Almira Dr · Bremerton, WA
Flood risk 1/10 · Minimal
- FEMA flood zone
- X (unshaded)
- Chance of flooding over 30 yrs
- 0.0%
- Est. flood insurance / yr
- $473 – $860
Fire risk 1/10 · Minimal
- Est. fire insurance / yr
- $604 – $1,122
Heat risk 3/10 · Minor
- Hot days now (above 86°F)
- 7 days/yr
- Hot days in 30 yrs
- 15 days/yr
Wind risk 1/10 · Minimal
- Chance of severe wind over 30 yrs
- —
Air-quality risk 7/10 · Major
- Unhealthy air days now
- 9 days/yr
- Unhealthy air days in 30 yrs
- 10 days/yr
Risk factors via First Street. Map © Google.
Why this score? — see what drove the D- grade
The composite is a weighted blend of 9 inputs, each scored 0–100. Each bar is that input's sub-score; the figure is the points it added to the 100-point composite (weight × sub-score).
- ARV discount +15.0/15.0
- Cash flow +6.7/30.0
- Livability +4.3/5.0
- Schools +3.9/10.0
- Rent growth +2.6/5.0
- Condition / age +2.5/5.0
- 1% rule +1.4/10.0
- DSCR +1.0/10.0
- Appreciation +0.0/10.0
$319,000
🖨 Deal sheet (PDF) 📄 Offer letter ✓ Due diligence
Listing remarks
Opportunity awaits: Olympic Mt views on a quiet residential street surrounded by great neighbors! Rare unobstructed views! With over 2200+ square feet, 3+ bedrooms and 2 baths, this property offers the space & upside investors are looking for. Hardwood floors add character and provide a solid starting point for renovation. The home needs remodeling and is being sold as-is, making it an excellent candidate for a fix-and-flip, rental investment, or value-add project. Bring your vision and unlock the potential of this generously sized home in a desirable location. Properties with this combination of square footage, views, and upside don't come along often. Cash only, this property won't
Key facts
- Olympic mt views
- Desirable location
- Unobstructed views
Tags
Property features AI
Finance
- Other: Lot includes alley and paved access; Garden space; Lot approx. 0.19 acres; Site features recorded from public records
- Financial info: Listing terms: Cash
Exterior
- Parking: Attached carport (1 covered space)
- Security: Partially fenced
- Utilities: Electric energy source; Public water; Sewer connected; PSE power
- Home design: Single-family residence; One story with basement; Main entry; Has a view
- Construction: Built in 1980 (effective year); Wood construction; Composition roof; Partially finished basement
- Exterior features: Deck; Partially fenced yard; Outbuildings; High-speed internet available; Wood exterior (see remarks)
Interior
- Kitchen: Stove/Range
- Bedrooms: 3 bedrooms (all on main level)
- Flooring: Hardwood; Vinyl
- Bathrooms: 2 full bathrooms (1 on main level, 1 on lower level); 2 bathtubs, 2 showers
- Heating & cooling: Baseboard heating; No central cooling
- Interior features: Dining room; Fireplace
- Laundry & utility: Washer; Dryer
Neighborhood map
What this means for you Summary
Snapshot
- This is a 3-bed/1.5-bath single-family listed at $319k.
Deal economics
- At list price, monthly cash flow is $-506 ($-6k/yr) — negative.
- To cash-flow at today's rent, offer at most $230k (28.0% below list).
- To meet the 1% rule (rent ≥ 1% of price), the offer needs to be $203k (36.3% below list).
- Recommended offer: $203k (36.3% below list) — sets the bar for 1% rule.
- Cap rate 4.4% vs local median 3.5% in Bremerton — meaningfully above typical; check what's discounted (condition, days-on-market, listing class) to confirm the premium yield is real.
Location & tenants
- Location reads 86/100 on livability (#22 in WA, #431 nationally) — a professional / high-income tenant draw. Strengths: amenities A+, commute A+, housing A+; Watch: crime F.
- Bremerton School District (urban): math 36% / reading 51% proficiency, ranked #194 of 291 in WA (top 67%) — families likely to look elsewhere, expect single-tenant / working-renter base with shorter leases.
- Zoned schools: View Ridge Elementary Arts Academy (398 students, 68% FRL); Mountain View Middle School (844 students, 71% FRL); Bremerton High School (1,221 students, 66% FRL).
- Market conditions: Rents flat; 97 active listings in the ZIP; 29 comparable units currently listed for rent nearby; rentals at typical pace (median 23d on market — plan ~3-4 weeks tenant-placement turnaround); solid renter incomes; 1,294 units permitted in Kitsap County in 2024 (302 in 5+ unit buildings).
- This rent runs 32% of the median local income ($76k/yr) — at the standard rent-burdened threshold; future hikes will face affordability resistance.
Forward outlook
- Local home prices are declining (-3.0%/yr); year-one equity from $2k of loan paydown is wiped out by about $10k of value loss. Plan a longer hold.
- Kitsap County population projected at +8% by 2050 — modest demand growth; plan on rents tracking national, not racing it.
Negotiation context
- Only 2 days on market — expect competitive offers; lowballing is unlikely to land.
Questions for the listing agent
- What do current leases actually rent for vs. the listed asking? Can we see a recent rent roll and the last 12 months of T-12 income?
- Built in 1965 — when were the roof, HVAC, electrical panel, plumbing, and water heater last replaced?
- Is there a deadline driving the sale (1031 exchange, divorce, estate, relocation)? That informs how much negotiation room exists.
- Schools are B-rated — typically a magnet for longer-tenancy family renters. What's the average tenant stay here, and is there a school-zone premium baked into asking?
- Crime grade is F in this area — have there been break-ins, vandalism, or insurance claims at this property in the last 3 years? What carrier currently insures it and at what premium?
- The area grade is low — what's the realistic commute time and amenity access for the typical tenant pool here? Any planned neighborhood developments (good or bad) we should know about?
- What's the average days-on-market for RENTAL listings here right now (not sales)? A rising rental-DOM trend means longer vacancies and softer asking-rent achievability than the comps imply.
- What's the recent tenant-quality profile in this submarket — average credit score on applications, eviction rate, late-payment / NSF rate, and stable-employment percentage? A property-management company in the area should have these aggregated.
- How much new for-sale + rental construction is in the pipeline within 1–3 miles? Heavy new supply typically softens prices + rents 12–24 months out; constrained supply supports both.
Investment metrics
- 1% rule
- 0.64% ✗
- Cap rate
- 4.39%
- Cash-on-cash
- -6.80%
- DSCR
- 0.70
- GRM
- 13.1
CMA / ARV
- ARV (on-the-fly)
- $394,654
- Comps found
- 12
Show comp detail 12 sales within ~0.75 mi
| Address | Dist | Beds/Ba | Sqft | Sold | Price | $/sf | Match |
|---|---|---|---|---|---|---|---|
| 1104 E 31st St | 0.35mi | 3/1.0 | 1,030 (-8%) | 5mo | $375,000 | $364 | 64 |
| 1104 Walnut St | 0.50mi | 3/1.0 | 1,176 (+5%) | 4mo | $385,550 | $328 | 63 |
| 3221 Solie Ave | 0.39mi | 3/1.0 | 1,010 (-10%) | 6mo | $430,000 | $426 | 58 |
| 2098 NE Sunrise Dr | 0.39mi | 2/1.0 (-1) | 1,222 (+9%) | 1mo | $375,420 | $307 | 58 |
| 2604 Strassburg St NE | 0.69mi | 3/1.0 | 1,125 (+1%) | 8mo | $377,000 | $335 | 58 |
| 944 E 30th St | 0.47mi | 3/1.0 | 1,033 (-8%) | 8mo | $395,000 | $382 | 57 |
| 534 Juniper St | 0.73mi | 3/1.0 | 1,070 (-4%) | 3mo | $405,000 | $379 | 54 |
| 4114 Bledsoe Ave | 0.65mi | 3/1.0 | 1,225 (+10%) | 1mo | $432,000 | $353 | 51 |
| 944 E 31st St | 0.44mi | 3/1.0 | 962 (-14%) | 5mo | $399,950 | $416 | 50 |
| 2108 NE Bellpark Dr | 0.38mi | 2/1.0 (-1) | 1,274 (+14%) | 5mo | $210,000 | $165 | 48 |
| 3514 Parker Ln | 0.62mi | 3/2.0 | 1,274 (+14%) | 2mo | $442,000 | $347 | 44 |
| 4201 Robinson Rd NE | 0.74mi | 2/1.0 (-1) | 1,248 (+12%) | 3mo | $435,000 | $349 | 37 |
Match score weights: distance 35% · size 25% · config 20% · recency 20%. Top-matched comps best support the ARV.
Projected returns pro-forma
-3.0% appreciation · 0.55% rent growth · sell at horizon
- IRR
- -30.7%
- Equity multiple
- 0.01×
- Total profit
- $-88,866
- Equity at exit
- $47,564
- IRR
- -47.7%
- Equity multiple
- -0.55×
- Total profit
- $-138,138
- Equity at exit
- $27,581
Cash invested: $89,320 (down + closing). Projections, not guarantees.
Landlord ↔ Tenant lean methodology
- Overall (STATE)
- 28 Tenant-Leaning
- State Washington
- 28 Tenant-Leaning · D+8
- County
- — inherits STATE
- City
- — inherits STATE
ZIP-level market 98310
- Rents YoY
- 0.6%
- Active inventory
- 97
- Price-to-rent
- 13.1×
Monthly cashflow live
- Estimated rent
- $2,033 high interval (Pro) →
- Mortgage (P&I)
- −$1,673
- Tax from tax record
- −$307 /mo · $3,685/yr
- Insurance
- −$133
- HOA
- −$0
- Vacancy / Maint / Mgmt
- −$427
- Net cashflow
- $-506
Break-even live
Sensitivity live
| Price | -10% $-326 | -5% $-416 | +0% $-506 | +5% $-597 | +10% $-687 |
|---|---|---|---|---|---|
| Rent | -10% $-667 | -5% $-587 | +0% $-506 | +5% $-426 | +10% $-346 |
| Rate | -1.0pp $-346 | -0.5pp $-425 | base $-506 | +0.5pp $-589 | +1.0pp $-673 |
UW: 25.0% down · 7.5% · 30yr · 1.5% tax · 5.0% vac · 8.0% maint · 8.0% mgmt
Financing live
Cash to close
- Down payment
- $79,750
- Closing costs
- $9,570
- Reserves months
- —
- Total cash needed
- —
Loan-product check · same deal, 3 products live
Conventional
25% down · 7.5% · 30yr
- Down + closing
- —
- Monthly P&I
- —
- Monthly cashflow
- —
- DSCR
- —
- Eligible?
- —
Personal DTI + credit; lowest rate.
DSCR
20% down · 8.5% · 30yr
- Down + closing
- —
- Monthly P&I
- —
- Monthly cashflow
- —
- DSCR
- —
- Eligible?
- —
No personal income docs; deal must DSCR.
Hard money
10% down · 12.0% · 12mo
- Down + closing
- —
- Monthly P&I
- —
- Monthly cashflow
- —
- DSCR
- —
- Eligible?
- —
Short-term bridge; refi at stabilization.
Rent comps 29 comps
| Address | Beds | Baths | Sqft | Rent | $/sqft | DOM | Units | Dist |
|---|---|---|---|---|---|---|---|---|
| 1610 E 31st St Bremerton, WA | 2.0 | 1.0 | 750 | $1,445 | $1.93 | 22d | 1 | 0.16mi |
| 3831 Maple Ave Unit A Bremerton, WA | 2.0 | 1.0 | 1100 | $2,500 | $2.27 | 45d | 1 | 0.47mi |
| 1925 Barnett St Bremerton, WA | 2.0 | 1.0 | 850 | $2,100 | $2.47 | 45d | 1 | 0.47mi |
| 4020 Bledsoe Ave Bremerton, WA | 1.0–2.0 | 1.0–2.0 | 744 | $1,875 | $2.52 | 15d | 4 | 0.53mi |
| 3280 Pine Rd Bremerton, WA | 2.0 | 1.0 | 810 | $1,671 | $2.06 | 15d | 5 | 0.65mi |
| 685 Sylvan Way Bremerton, WA | 2.0 | 2.0 | 1040 | $2,100 | $2.02 | 15d | 2 | 0.65mi |
| 2732 Callahan Dr Unit B Bremerton, WA | 2.0 | 1.0 | 864 | $1,800 | $2.08 | 22d | 1 | 0.66mi |
| 2517 NE Franklin St Bremerton, WA | 3.0 | 2.0 | 1350 | $2,650 | $1.96 | 45d | 1 | 0.68mi |
| 2533 Strassburg St NE Bremerton, WA | 3.0 | 2.0 | 1068 | $2,500 | $2.34 | 45d | 1 | 0.68mi |
| 3232 Pine Rd Bremerton, WA | 2.0–3.0 | 2.0 | 980 | $2,375 | $2.42 | 15d | 9 | 0.69mi |
| 2700 Maple St Bremerton, WA | 1.0–2.0 | 1.0 | 780 | $1,875 | $2.40 | 15d | 6 | 0.74mi |
| 3850 Constellation Loop Bremerton, WA | 2.0 | 2.5 | 1363 | $2,600 | $1.91 | 22d | 1 | 0.74mi |
| 2596 Fir Ave Unit C Bremerton, WA | 2.0 | 1.0 | 960 | $1,550 | $1.61 | 45d | 1 | 0.81mi |
| 2001 Magnuson Way Bremerton, WA | 2.0 | 1.0 | 800 | $1,600 | $2.00 | 15d | 1 | 0.82mi |
| 2001 Magnuson Way Bremerton, WA | 2.0 | 1.0 | 800 | $1,500 | $1.88 | 45d | 1 | 0.82mi |
| 2009 Magnuson Way Unit 2 Bremerton, WA | 2.0 | 1.0 | 800 | $1,500 | $1.88 | 45d | 1 | 0.83mi |
| 2501 Fir Ave Bremerton, WA | 3.0 | 1.0 | 1000 | $2,150 | $2.15 | 22d | 1 | 0.85mi |
| 1911 NE Riddell Rd Bremerton, WA | 2.0 | 1.0–2.0 | 858 | $1,980 | $2.31 | 15d | 10 | 0.87mi |
| 500 Lebo Blvd Unit 304 Bremerton, WA | 2.0 | 1.0 | 917 | $1,600 | $1.74 | 22d | 1 | 0.90mi |
| 2733 Hefner Ave Unit 2733 Bremerton, WA | 3.0 | 1.0 | 874 | $1,900 | $2.17 | 15d | 1 | 0.97mi |
| 2172 Seringa Ave Bremerton, WA | 1.0–2.0 | 1.0–2.0 | 787 | $2,295 | $2.92 | 15d | 6 | 1.00mi |
| 2831 NE Center St Unit 1 Bremerton, WA | 2.0 | 1.0 | 704 | $1,550 | $2.20 | 45d | 1 | 1.06mi |
| 778 NE Mesa Ln Bremerton, WA | 1.0–3.0 | 1.0–2.0 | 877 | $2,150 | $2.45 | 15d | 3 | 1.13mi |
| 5163 NE Mariah Ln Bremerton, WA | 1.0–2.0 | 1.0 | 821 | $1,895 | $2.31 | 15d | 2 | 1.13mi |
| 820 NE Riddell Rd Unit D Bremerton, WA | 2.0 | 1.0 | 974 | $1,650 | $1.69 | 22d | 1 | 1.14mi |
| 2638 Cascade Trl Unit A Bremerton, WA | 2.0 | 1.0 | 906 | $1,600 | $1.77 | 15d | 1 | 1.26mi |
| 1619 Wheaton Way Bremerton, WA | 1.0–2.0 | 1.0 | 875 | $2,002 | $2.29 | 15d | 10 | 1.35mi |
| 1970 NE Fuson Rd Bremerton, WA | 1.0–2.0 | 1.0–2.0 | 676 | $2,297 | $3.40 | 15d | 12 | 1.42mi |
| 1303 NE Jasmine Ln Bremerton, WA | 2.0 | 1.5 | 1152 | $2,600 | $2.26 | 45d | 1 | 1.46mi |
Listing history 2 events
-
2026-06-07remarks 695-char remark
-
2026-06-07$319,000 Pending 2 DOM
ⓘ Source: listings_history table (triggers on properties + properties_extension) + one-shot
backfill from property_details.listing_events for pre-trigger history.
Tax reassessment forecast WA · Resets to sale price
- Current annual tax
- $3,685 · $307/mo
- Projected year-2 tax
- $3,685 · $307/mo
- Expected delta
- $0/yr ($0/mo · 0.0%)
ⓘ Screening estimate from a state-policy table — verify with the county assessor before closing.
Climate risk First Street
- Flood 1/10 Low FEMA zone X (unshaded) · 0% chance over 30 yrs
- Wildfire 1/10 Low
- Heat 3/10 Moderate 7 d/yr ≥86°F today · 15 d/yr by 30 yrs out
- Wind 1/10 Low
- Air quality 7/10 Severe 9 unhealthy d/yr today · 10 by 30 yrs out
Nearby sold comps map
Loading sold comps map…
Walkable amenities ~0.75 mi
Loading nearby amenities…
Taxation est. · year 1
- Rental income
- $24,402
- − Mortgage interest
- −$17,869
- − Property taxes
- −$3,685
- − Insurance
- −$1,595
- − Repairs & maintenance
- −$1,952
- − Management
- −$1,952
- − Depreciation
- −$9,280
- Taxable loss
- −$11,932
- Est. tax savings @ 24.0%
- +$2,864
- After-tax cash flow
- $-3,214/yr
For passive investors: Depreciation is non-cash, so a rental often shows a tax loss while cash-flowing — sheltering income. Rental losses are passive: they offset passive income freely, and up to $25,000/yr can offset ordinary (W-2) income if you actively participate and your MAGI is under $100k (phasing out to $0 by $150k); unused losses carry forward. On sale, claimed depreciation is recaptured at up to 25%, and gains may owe capital-gains tax (a 1031 exchange can defer both). Figures are a year-1 estimate at your 24.0% rate — not tax advice; consult a CPA.
Schools (NCES district)
- District
- Bremerton School District
- NCES district ID
- 5300660
- Math proficiency
- 36% ▼ -3.00%
- Reading proficiency
- 51% ▲ 1.00%
- Median HH income
- $46,765
- Composite
- 39.34/100
- National rank
- #8163
- State rank
- #194 of 291 in WA
Livability — Bremerton
- Score
- 86/100
- State rank
- #22
- US rank
- #431
Category grades
Schools grade is shown separately in the Schools card above.
Census & demographics
- Census place
- Bremerton, WA
- County
- Kitsap County · 243,099 people
- City population
- 94,488
- Metro
- Bremerton-Silverdale-Port Orchard, WA
- Population (ZIP)
- 22,643
- Household income
- $75,878
- Rent vs Own
- Severe rent burden
- 1418.0
Population outlook (Kitsap County) Hauer SSP2
- Today (2025)
- 277,525 people
- By 2030
- 285,040 · +2.7%
- By 2040
- 294,957 · +6.3%
- By 2050
- 300,622 · +8.3%
- By 2075
- 315,580 · +13.7%
- By 2100
- 304,340 · +9.7%
Race, ethnicity, and origin ACS 2023
- Neighborhood character
- Diverse neighborhood (Simpson 0.60)
- Race & ethnicity
- White 61% Hispanic / Latino 15% Two or more races 13% Asian 6% Black 5% Pacific Islander 4%
- Hispanic origin (detail)
- Mexican 7%
- Common ancestry
- Italian 4% Portuguese 4% Lithuanian 3%
- Foreign-born
- 11% · Canada, China
- Languages at home
- 84% English-only · Spanish 6% Other Asian/Pacific 3% Tagalog/Filipino 3%
Political lean MEDSL · Kitsap
- 2024 margin
- Strong D (+20.9) · D 58.8% · R 37.9% · Other 3.3%
- 2008→2024 swing
- +8.6pp toward D · 2008: 12.3pp · 2024: 20.9pp
- All cycles
- 2024: D+20.9 2020: D+18.1 2016: D+11.6 2012: D+11.1 2008: D+12.3
Not yet ingested
- Civics
- —
Market trends
- HPI YoY
- ▼ -533.38%
- Current HPI
- 374.6915
- Rent YoY
- ▲ 0.55%
- Metro
- Bremerton-Silverdale-Port Orchard, WA
- State GDP YoY
- ▲ 4.65%
- F500 in state
- 22
Industry mix (Fortune 500 HQ in WA)
| Industry | F500 HQs | Revenue |
|---|---|---|
| Retail | 2 | $269B |
|
||
| Technology / Retail | 1 | $638B |
|
||
| Technology | 1 | $245B |
|
||
| Telecommunications | 1 | $38B |
|
||
| Food / Beverage | 1 | $36B |
|
||
| Automotive / Trucks | 1 | $34B |
|
||
Price history
2 events — show timeline
- 2026-06-06 Pending — NWMLS as Distributed by MLS Grid
- 2026-06-04 Listed $319,000 NWMLS as Distributed by MLS Grid
Property tax history
+3.4%/yrLatest (2026): $3,685 · +0.5% YoY. Source: county tax records.
Cash-flow waterfall
monthlySold comps — $/sqft
last 12 mo · ≤1 miLoading sold comps…