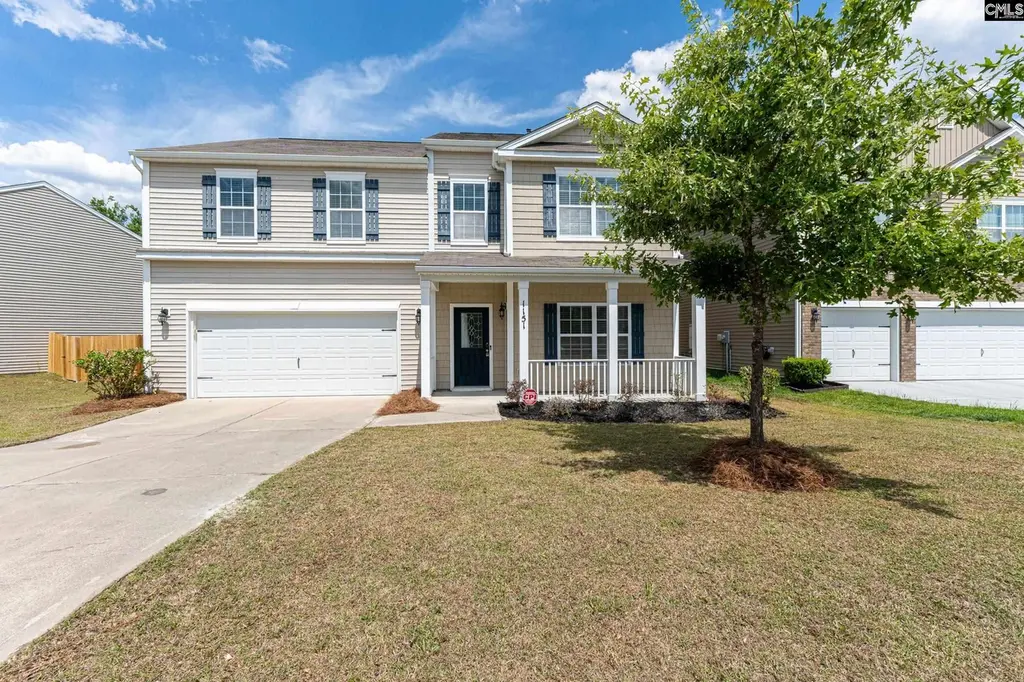
1151 Campbell Ridge Dr · Columbia, SC
Flood risk 1/10 · Minimal
- FEMA flood zone
- X (unshaded)
- Chance of flooding over 30 yrs
- 0.0%
- Est. flood insurance / yr
- $507 – $1,088
Fire risk 5/10 · Moderate
- Est. fire insurance / yr
- $783 – $1,453
Heat risk 6/10 · Moderate
- Hot days now (above 107°F)
- 7 days/yr
- Hot days in 30 yrs
- 16 days/yr
Wind risk 6/10 · Moderate
- Chance of severe wind over 30 yrs
- 65.0%
Air-quality risk 3/10 · Minor
- Unhealthy air days now
- 2 days/yr
- Unhealthy air days in 30 yrs
- 3 days/yr
Risk factors via First Street. Map © Google.
Why this score? — see what drove the D- grade
The composite is a weighted blend of 9 inputs, each scored 0–100. Each bar is that input's sub-score; the figure is the points it added to the 100-point composite (weight × sub-score).
- Cash flow +12.1/30.0
- ARV discount +7.5/15.0
- Livability +3.9/5.0
- DSCR +3.6/10.0
- Schools +3.6/10.0
- Rent growth +3.2/5.0
- 1% rule +2.7/10.0
- Condition / age +2.5/5.0
- Appreciation +0.0/10.0
$350,000
🖨 Deal sheet 📄 Offer letter ✓ Due diligence
Listing remarks
Situated on a quiet private cul de sac, this spacious and thoughtfully designed home offers the room, flexibility, and everyday comfort today’s buyers are looking for. With over 3,000 square feet, 4 bedrooms, and 3.5 baths, this home was built to accommodate both daily living and effortless entertaining. The main level features multiple gathering spaces including a formal dining room, an inviting great room with fireplace, and a versatile front room behind French doors perfect for a home office, playroom, or additional sitting area. The open concept kitchen serves as the heart of the home with granite countertops, stainless steel appliances, gas cooking, abundant cabinetry, a center i
Key facts
- Oversized loft
- Open concept kitchen
- Spacious backyard
Tags
Property features AI
Exterior
- Parking: Attached garage with 2 spaces
- Utilities: Public water; Public sewer
- Home design: Single-family property
- Construction: Slab foundation
- Exterior features: Vinyl exterior; Paved road access; Approximately 0.201 acres
Interior
- Bedrooms: Master bedroom on the second floor
- Bathrooms: Three full bathrooms; One half bathroom; Three second full bathrooms
- Interior features: One fireplace; Central air conditioning; Gas pack heating
Neighborhood map
What this means for you Summary
Snapshot
- This is a 4-bed/4.0-bath single-family listed at $350k.
Deal economics
- At list price, monthly cash flow is $-79 ($-943/yr) — negative.
- To cash-flow at today's rent, offer at most $336k (4.0% below list).
- To meet the 1% rule (rent ≥ 1% of price), the offer needs to be $269k (23.2% below list).
- Recommended offer: $269k (23.2% below list) — sets the bar for 1% rule.
Location & tenants
- Location reads 78/100 on livability (#18 in SC, #2,436 nationally) — a middle-class / working-renter tenant base. Strengths: amenities A+, commute A+, cost of living A+; Watch: employment D, crime F.
- Richland 02 (suburban): math 35% / reading 47% proficiency, ranked #29 of 80 in SC (top 36%) — families likely to look elsewhere, expect single-tenant / working-renter base with shorter leases.
- Zoned schools: Catawba Trail Elementary (math 43% / reading 41%, grade F, #256 of 597 statewide, top 45%, 591 students, 59% FRL); Spring Valley High (math 53% / reading 92%, grade B+, #46 of 196 statewide, top 24%, 2,187 students, 49% FRL) — zoned schools average 54% FRL vs 38% district-wide (16 pts higher); higher-poverty schools than district average — tighter screening recommended.
- Zoned-school proficiency averages 57% at this address vs 41% district-wide (+16 pts) — the actual schools serving this property are materially stronger than the Richland 02 average implies; a family-tenant draw the district grade alone would hide.
- Market conditions: Rents rising (+2.7%/yr); 334 active listings in the ZIP; 3 comparable units currently listed for rent nearby; rentals leasing fast (median 11d on market — plan ~1-2 weeks tenant-placement turnaround); solid renter incomes; 3,472 units permitted in Richland County in 2024 (1,096 in 5+ unit buildings).
- This rent runs 37% of the median local income ($87k/yr) — at the standard rent-burdened threshold; future hikes will face affordability resistance.
Forward outlook
- Local home prices are declining (-3.0%/yr); year-one equity from $2k of loan paydown is wiped out by about $10k of value loss. Plan a longer hold.
- Richland County population projected at +30% by 2050 — long-run rental-demand tailwind backs the buy-and-hold thesis.
Negotiation context
- It's been on market 32 days — a 3% lower offer ($340k) is reasonable based on typical stale-listing flexibility.
- 4 sale attempts since 8y ago with the ask held roughly flat each time — persistent listings suggest the price (not the market) is what's stuck; bring a comps-based counter.
Risks & watch-outs
- Climate carrying-cost: major wind risk, 65% chance of damaging wind over 30y; moderate wildfire risk; extreme-heat days projected 7→16/yr by 2055 (HVAC capex compounding) — expect insurance premiums to compound above CPI over the hold.
Questions for the listing agent
- What do current leases actually rent for vs. the listed asking? Can we see a recent rent roll and the last 12 months of T-12 income?
- It's been on market 32 days. Have you received any prior offers? Is the seller open to a 23% concession, seller financing, or rate buy-down credit?
- Is there a deadline driving the sale (1031 exchange, divorce, estate, relocation)? That informs how much negotiation room exists.
- Schools are D-rated, which usually means shorter tenancies and higher turnover. Who's the typical renter profile here, and what's been the actual vacancy rate?
- Crime grade is F in this area — have there been break-ins, vandalism, or insurance claims at this property in the last 3 years? What carrier currently insures it and at what premium?
- The area grade is low — what's the realistic commute time and amenity access for the typical tenant pool here? Any planned neighborhood developments (good or bad) we should know about?
- What's the average days-on-market for RENTAL listings here right now (not sales)? A rising rental-DOM trend means longer vacancies and softer asking-rent achievability than the comps imply.
- What's the recent tenant-quality profile in this submarket — average credit score on applications, eviction rate, late-payment / NSF rate, and stable-employment percentage? A property-management company in the area should have these aggregated.
- How much new for-sale + rental construction is in the pipeline within 1–3 miles? Heavy new supply typically softens prices + rents 12–24 months out; constrained supply supports both.
Investment metrics
- 1% rule
- 0.77% ✗
- Cap rate
- 6.02%
- Cash-on-cash
- -0.96%
- DSCR
- 0.96
- GRM
- 10.9
CMA / ARV
No comps found within radius.
Projected returns pro-forma
-3.0% appreciation · 2.7% rent growth · sell at horizon
- IRR
- -18.2%
- Equity multiple
- 0.36×
- Total profit
- $-62,620
- Equity at exit
- $52,186
- IRR
- -11.1%
- Equity multiple
- 0.34×
- Total profit
- $-64,646
- Equity at exit
- $30,262
Cash invested: $98,000 (down + closing). Projections, not guarantees.
Landlord ↔ Tenant lean methodology
- Overall (STATE)
- 90 Strongly Landlord-Friendly
- State South Carolina
- 90 Strongly Landlord-Friendly · R+6
- County
- — inherits STATE
- City
- — inherits STATE
ZIP-level market 29045
- Home prices YoY
- -17.9%
- Rents YoY
- 2.7%
- Active inventory
- 334
- Price-to-rent
- 10.9×
Monthly cashflow live
- Estimated rent
- $2,688 medium interval (Pro) →
- Mortgage (P&I)
- −$1,835
- Tax from tax record
- −$221 /mo · $2,650/yr
- Insurance
- −$146
- HOA
- −$0
- Vacancy / Maint / Mgmt
- −$564
- Net cashflow
- $-79
Break-even live
UW: 25.0% down · 7.5% · 30yr · 1.5% tax · 5.0% vac · 8.0% maint · 8.0% mgmt
Financing live
Cash to close
- Down payment
- $87,500
- Closing costs
- $10,500
- Reserves months
- —
- Total cash needed
- —
Loan-product check · same deal, 3 products live
Conventional
25% down · 7.5% · 30yr
- Down + closing
- —
- Monthly P&I
- —
- Monthly cashflow
- —
- DSCR
- —
- Eligible?
- —
Personal DTI + credit; lowest rate.
DSCR
20% down · 8.5% · 30yr
- Down + closing
- —
- Monthly P&I
- —
- Monthly cashflow
- —
- DSCR
- —
- Eligible?
- —
No personal income docs; deal must DSCR.
Hard money
10% down · 12.0% · 12mo
- Down + closing
- —
- Monthly P&I
- —
- Monthly cashflow
- —
- DSCR
- —
- Eligible?
- —
Short-term bridge; refi at stabilization.
Rent comps 3 comps
| Address | Beds | Baths | Sqft | Rent | $/sqft | DOM | Units | Dist |
|---|---|---|---|---|---|---|---|---|
| 1009 Campbell Ridge Dr Elgin, SC | 5.0 | 4.5 | 3500 | $2,986 | $0.85 | 11d | 1 | 0.35mi |
| 305 Ollivander Ln Elgin, SC | 4.0 | 2.5 | 2440 | $2,400 | $0.98 | 23d | 1 | 0.54mi |
| 225 Bails Rd Elgin, SC | 3.0 | 2.0 | 2176 | $2,350 | $1.08 | 2d | 1 | 1.07mi |
Listing history 20 events
-
2026-06-09status $350,000 Pending 32 DOM
-
2026-06-08days on market $350,000 Active - Contingent 32 DOM
-
2026-06-07days on market $350,000 Active - Contingent 31 DOM
-
2026-06-05days on market $350,000 Active - Contingent 28 DOM
-
2026-06-03days on market $350,000 Active - Contingent 27 DOM
-
2026-06-03days on market $350,000 Active - Contingent 26 DOM
-
2026-06-01days on market $350,000 Active - Contingent 25 DOM
-
2026-05-31days on market $350,000 Active - Contingent 24 DOM
-
2026-05-07$350,000 Active
-
2026-04-22historical
-
2025-09-05price $370,000
-
2025-07-01$380,000 Active
-
2019-02-09historical
-
2019-01-22status Active
-
2019-01-20historical
-
2018-08-16price $237,990
-
2018-08-16price $236,990
-
2018-08-16price $235,000
-
2018-07-14price $241,990
-
2018-05-17$240,500 Active
ⓘ Source: listings_history table (triggers on properties + properties_extension) + one-shot
backfill from property_details.listing_events for pre-trigger history.
Tax reassessment forecast SC · Resets to sale price
- Current annual tax
- $2,650 · $221/mo
- Projected year-2 tax
- $2,650 · $221/mo
- Expected delta
- $0/yr ($0/mo · 0.0%)
ⓘ Screening estimate from a state-policy table — verify with the county assessor before closing.
Climate risk First Street
- Flood 1/10 Low FEMA zone X (unshaded) · 0% chance over 30 yrs
- Wildfire 5/10 Major
- Heat 6/10 Major 7 d/yr ≥107°F today · 16 d/yr by 30 yrs out
- Wind 6/10 Major 65% chance of damaging wind over 30 yrs
- Air quality 3/10 Moderate 2 unhealthy d/yr today · 3 by 30 yrs out
Nearby sold comps map
Loading sold comps map…
Walkable amenities ~0.75 mi
Loading nearby amenities…
Taxation est. · year 1
- Rental income
- $32,256
- − Mortgage interest
- −$19,605
- − Property taxes
- −$2,650
- − Insurance
- −$1,750
- − Repairs & maintenance
- −$2,581
- − Management
- −$2,581
- − Depreciation
- −$10,182
- Taxable loss
- −$7,092
- Est. tax savings @ 24.0%
- +$1,702
- After-tax cash flow
- $759/yr
For passive investors: Depreciation is non-cash, so a rental often shows a tax loss while cash-flowing — sheltering income. Rental losses are passive: they offset passive income freely, and up to $25,000/yr can offset ordinary (W-2) income if you actively participate and your MAGI is under $100k (phasing out to $0 by $150k); unused losses carry forward. On sale, claimed depreciation is recaptured at up to 25%, and gains may owe capital-gains tax (a 1031 exchange can defer both). Figures are a year-1 estimate at your 24.0% rate — not tax advice; consult a CPA.
Schools (NCES district)
- District
- Richland 02
- NCES district ID
- 4503390
- Math proficiency
- 35% ▼ -15.00%
- Reading proficiency
- 47% ▼ -5.00%
- Median HH income
- $59,684
- Composite
- 36.2/100
- National rank
- #4730
- State rank
- #29 of 80 in SC
Livability — Columbia
- Score
- 78/100
- State rank
- #18
- US rank
- #2436
Category grades
Schools grade is shown separately in the Schools card above.
Census & demographics
- County
- Kershaw County · 47,655 people
- City population
- 31,372
- Metro
- Columbia, SC
- Population (ZIP)
- 31,372
- Household income
- $87,366
- Rent vs Own
- Severe rent burden
- 204.0
Population outlook (Richland County) Hauer SSP2
- Today (2025)
- 459,667 people
- By 2030
- 487,524 · +6.1%
- By 2040
- 542,035 · +17.9%
- By 2050
- 595,371 · +29.5%
- By 2075
- 732,998 · +59.5%
- By 2100
- 820,415 · +78.5%
Race, ethnicity, and origin ACS 2023
- Neighborhood character
- Diverse neighborhood (Simpson 0.62)
- Race & ethnicity
- White 53% Black 31% Hispanic / Latino 9% Two or more races 5% Asian 3%
- Hispanic origin (detail)
- Mexican 5% Puerto Rican 2%
- Common ancestry
- Serbian 1% Slovak 1% Lithuanian 1%
- Foreign-born
- 7% · Canada, South Korea
- Languages at home
- 90% English-only · Spanish 6% Other Indo-European 1% Korean 1%
Political lean MEDSL · Richland
- 2024 margin
- Solid D (+34.6) · D 66.4% · R 31.8% · Other 1.8%
- 2008→2024 swing
- +5.7pp toward D · 2008: 28.9pp · 2024: 34.6pp
- All cycles
- 2024: D+34.6 2020: D+38.3 2016: D+32.9 2012: D+33.3 2008: D+28.9
Not yet ingested
- Civics
- —
Market trends
- HPI YoY
- ▼ -45.60%
- Current HPI
- 209.2469
- Rent YoY
- ▲ 2.70%
- Metro
- Columbia, SC
- State GDP YoY
- ▲ 4.51%
- F500 in state
- 2
Industry mix (Fortune 500 HQ in SC)
| Industry | F500 HQs | Revenue |
|---|---|---|
| Packaging | 1 | $7B |
|
||
Price history
+45.5% since first listed12 events — show timeline
- 2026-05-07 Listed $350,000 Consolidated MLS
- 2026-04-22 Delisted — Consolidated MLS
- 2025-09-05 Price Changed $370,000 Consolidated MLS
- 2025-07-01 Listed $380,000 Consolidated MLS
- 2019-02-09 Delisted — Consolidated MLS
- 2019-01-22 Relisted — Consolidated MLS
- 2019-01-20 Delisted — Consolidated MLS
- 2018-08-16 Price Changed $237,990 Consolidated MLS
- 2018-08-16 Price Changed $236,990 Consolidated MLS
- 2018-08-16 Price Changed $235,000 Consolidated MLS
- 2018-07-14 Price Changed $241,990 Consolidated MLS
- 2018-05-17 Listed $240,500 Consolidated MLS
Property tax history
+12.2%/yrLatest (2025): $2,650 · -70.5% YoY. Source: county tax records.
Cash-flow waterfall
monthlySold comps — $/sqft
last 12 mo · ≤1 miLoading sold comps…