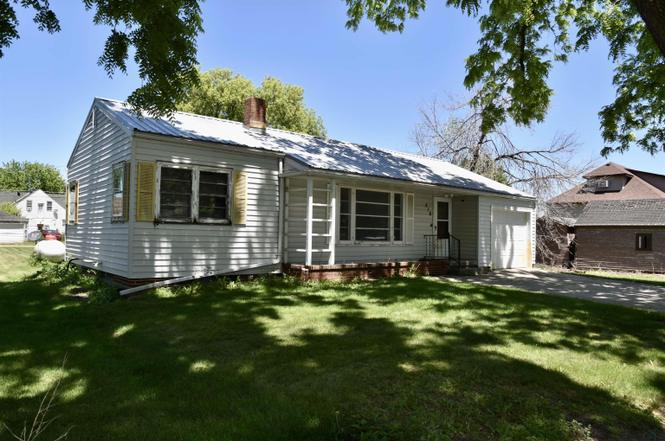
416 Grove St · Melvin, IA
Flood risk 1/10 · Minimal
- FEMA flood zone
- X (unshaded)
- Chance of flooding over 30 yrs
- 0.0%
- Est. flood insurance / yr
- $473 – $860
Fire risk 1/10 · Minimal
- Est. fire insurance / yr
- $902 – $1,676
Heat risk 2/10 · Minimal
- Hot days now (above 99°F)
- 7 days/yr
- Hot days in 30 yrs
- 15 days/yr
Wind risk 2/10 · Minimal
- Chance of severe wind over 30 yrs
- —
Air-quality risk 1/10 · Minimal
- Unhealthy air days now
- 0 days/yr
- Unhealthy air days in 30 yrs
- 0 days/yr
Risk factors via First Street. Map © Google.
Why this score? — see what drove the B+ grade
The composite is a weighted blend of 9 inputs, each scored 0–100. Each bar is that input's sub-score; the figure is the points it added to the 100-point composite (weight × sub-score).
- Cash flow +30.0/30.0
- 1% rule +10.0/10.0
- DSCR +10.0/10.0
- ARV discount +7.5/15.0
- Schools +6.1/10.0
- Appreciation +5.7/10.0
- Livability +3.2/5.0
- Rent growth +2.5/5.0
- Condition / age +2.5/5.0
$55,000
🖨 Deal sheet 📄 Offer letter ✓ Due diligence
Listing remarks MLS
Cozy Fixer-Upper with Open-Concept Layout & Expansive Yard – Selling AS-IS Bring your toolbelt and your vision! This 2-bedroom, 2-bathroom property is the perfect opportunity for investors, flippers, or anyone looking to build immediate sweat equity. The smart, smaller square footage makes it incredibly easy to maintain and will make for an exceptionally warm and cozy home once completed. Key Features: Open-Concept Living: Features a spacious family room and kitchen area with a highly desirable open layout—maximizing the footprint for modern living and entertaining. Mechanical Update: Enjoy peace of mind with a newer furnace already in place, taking a major checklist item off your worry list. Character & Charm: Beautiful natural wood floors run through both bedrooms, waiting to be shined up to their original glory. Generous Lot: The efficient indoor footprint is perfectly balanced by a large back yard with endless possibilities for gardening, entertaining, or pets. The property is being sold strictly AS-IS. Whether you are looking for an affordable entry into homeownership, a manageable rental addition, or a high-potential flip project, this cozy home is ready to shine. Schedule your tour today and see the possibilities for yourself!
Key facts
- Natural wood floors
- Newer furnace
- Large back yard
Tags
Property features AI
Exterior
- Parking: Attached garage (1 car), approximately 12 x 20
- Utilities: City water connected; City sewer connected; Propane fuel
- Home design: Residential property; One story
- Construction: Block foundation; Foundation dimensions approximately 22 x 36; Building area total approximately 1,584
- Exterior features: Vinyl exterior; Lot approximately 0.25 acres (75 x 142)
Interior
- Bedrooms: 2 bedrooms
- Bathrooms: 1 full bath; 1 half bath
- Heating & cooling: Forced air heating; Central air conditioning
- Interior features: Block foundation basement, unfinished; One-level living
Neighborhood map
What this means for you Summary
Snapshot
- This is a 2-bed/1.5-bath single-family listed at $55k.
Deal economics
- At list price, monthly cash flow is $336 ($4k/yr) — positive.
- The deal already cash-flows at list — no discount required.
- Meets the 1% rule at list price ($845 rent vs $55k).
Location & tenants
- Location reads 63/100 on livability (#662 in IA) — a middle-class / working-renter tenant base. Strengths: cost of living A+, housing A+; Watch: crime C-, schools F, amenities F.
- Hartley-Melvin-Sanborn Community School District (rural): math 72% / reading 73% proficiency, ranked #111 of 289 in IA (top 38%) — strong family-tenant draw, lease renewals of 3-5y typical.
- Market conditions: 4 active listings in the ZIP; 8 units permitted in Osceola County in 2024 (0 in 5+ unit buildings).
Forward outlook
- In year one you build about $1k of equity ($380 loan paydown + $727 appreciation (1.3% local appreciation)).
- Osceola County population projected at -32% by 2050 — secular population decline; favor cash flow + early exit over multi-decade hold.
- At projected returns (1.3% appreciation + 3.0% rent growth), your $15k cash investment doubles in ~3 years — after that, you're playing with house money.
Negotiation context
- Only 3 days on market — expect competitive offers; lowballing is unlikely to land.
- 3 sale attempts with the ask held roughly flat each time — persistent listings suggest the price (not the market) is what's stuck; bring a comps-based counter.
- Current owner paid $16k; list at $55k implies a 255% gain — meaningful room to come down on a strong offer.
Risks & watch-outs
- Watch-outs: built in 1951 — expect roof / HVAC / electrical / plumbing capex.
Questions for the listing agent
- Built in 1951 — when were the roof, HVAC, electrical panel, plumbing, and water heater last replaced?
- Is there a deadline driving the sale (1031 exchange, divorce, estate, relocation)? That informs how much negotiation room exists.
- Schools are F-rated, which usually means shorter tenancies and higher turnover. Who's the typical renter profile here, and what's been the actual vacancy rate?
- What's the average days-on-market for RENTAL listings here right now (not sales)? A rising rental-DOM trend means longer vacancies and softer asking-rent achievability than the comps imply.
- What's the recent tenant-quality profile in this submarket — average credit score on applications, eviction rate, late-payment / NSF rate, and stable-employment percentage? A property-management company in the area should have these aggregated.
- How much new for-sale + rental construction is in the pipeline within 1–3 miles? Heavy new supply typically softens prices + rents 12–24 months out; constrained supply supports both.
Investment metrics
- 1% rule
- 1.54% ✓
- Cap rate
- 13.62%
- Cash-on-cash
- 26.15%
- DSCR
- 2.16
- GRM
- 5.4
CMA / ARV
No comps found within radius.
Projected returns pro-forma
1.32% appreciation · 3.0% rent growth · sell at horizon
- IRR
- 29.0%
- Equity multiple
- 2.51×
- Total profit
- $23,256
- Equity at exit
- $19,701
- IRR
- 31.2%
- Equity multiple
- 4.84×
- Total profit
- $59,119
- Equity at exit
- $26,911
Cash invested: $15,400 (down + closing). Projections, not guarantees.
Landlord ↔ Tenant lean methodology
- Overall (STATE)
- 83 Strongly Landlord-Friendly
- State Iowa
- 83 Strongly Landlord-Friendly · R+6
- County
- — inherits STATE
- City
- — inherits STATE
ZIP-level market 51350
- Home prices YoY
- 1.2%
- Active inventory
- 4
- Price-to-rent
- 5.4×
Monthly cashflow live
- Estimated rent
- $845 medium interval (Pro) →
- Mortgage (P&I)
- −$288
- Tax from tax record
- −$20 /mo · $245/yr
- Insurance
- −$23
- HOA
- −$0
- Vacancy / Maint / Mgmt
- −$177
- Net cashflow
- $336
Break-even live
UW: 25.0% down · 7.5% · 30yr · 1.5% tax · 5.0% vac · 8.0% maint · 8.0% mgmt
Financing live
Cash to close
- Down payment
- $13,750
- Closing costs
- $1,650
- Reserves months
- —
- Total cash needed
- —
Loan-product check · same deal, 3 products live
Conventional
25% down · 7.5% · 30yr
- Down + closing
- —
- Monthly P&I
- —
- Monthly cashflow
- —
- DSCR
- —
- Eligible?
- —
Personal DTI + credit; lowest rate.
DSCR
20% down · 8.5% · 30yr
- Down + closing
- —
- Monthly P&I
- —
- Monthly cashflow
- —
- DSCR
- —
- Eligible?
- —
No personal income docs; deal must DSCR.
Hard money
10% down · 12.0% · 12mo
- Down + closing
- —
- Monthly P&I
- —
- Monthly cashflow
- —
- DSCR
- —
- Eligible?
- —
Short-term bridge; refi at stabilization.
Listing history 4 events
-
2026-06-18days on market $55,000 Active 3 DOM
-
2026-06-17days on market $55,000 Active 2 DOM
-
2026-06-16remarks 683-char remark
-
2026-06-16$55,000 Active 1 DOM
ⓘ Source: listings_history table (triggers on properties + properties_extension) + one-shot
backfill from property_details.listing_events for pre-trigger history.
Tax reassessment forecast IA · Partial reset (capped growth)
- Current annual tax
- $245 · $20/mo
- Projected year-2 tax
- $554 · $46/mo
- Expected delta
- +$309/yr (+$26/mo · 126.2%)
ⓘ Screening estimate from a state-policy table — verify with the county assessor before closing.
Climate risk First Street
- Flood 1/10 Low FEMA zone X (unshaded) · 0% chance over 30 yrs
- Wildfire 1/10 Low
- Heat 2/10 Low 7 d/yr ≥99°F today · 15 d/yr by 30 yrs out
- Wind 2/10 Low
- Air quality 1/10 Low 0 unhealthy d/yr today · 0 by 30 yrs out
Nearby sold comps map
Loading sold comps map…
Walkable amenities ~0.75 mi
Loading nearby amenities…
Taxation est. · year 1
- Rental income
- $10,137
- − Mortgage interest
- −$3,081
- − Property taxes
- −$245
- − Insurance
- −$275
- − Repairs & maintenance
- −$811
- − Management
- −$811
- − Depreciation
- −$1,600
- Taxable income
- $3,314
- Est. tax owed @ 24.0%
- −$795
- After-tax cash flow
- $3,232/yr
For passive investors: Depreciation is non-cash, so a rental often shows a tax loss while cash-flowing — sheltering income. Rental losses are passive: they offset passive income freely, and up to $25,000/yr can offset ordinary (W-2) income if you actively participate and your MAGI is under $100k (phasing out to $0 by $150k); unused losses carry forward. On sale, claimed depreciation is recaptured at up to 25%, and gains may owe capital-gains tax (a 1031 exchange can defer both). Figures are a year-1 estimate at your 24.0% rate — not tax advice; consult a CPA.
Schools (NCES district)
- District
- Hartley-Melvin-Sanborn Community School District
- NCES district ID
- 1913660
- Math proficiency
- 72% ▲ 1.00%
- Reading proficiency
- 73% ▲ 4.00%
- Median HH income
- $46,177
- Composite
- 61.08/100
- National rank
- #790
- State rank
- #111 of 289 in IA
Livability — Melvin
- Score
- 63/100
- State rank
- #662
- US rank
- #15302
Category grades
Schools grade is shown separately in the Schools card above.
Census & demographics
- Census place
- Melvin, IA
- Population (ZIP)
- 417
Population outlook (Osceola County) Hauer SSP2
- Today (2025)
- 5,434 people
- By 2030
- 5,046 · -7.1%
- By 2040
- 4,339 · -20.2%
- By 2050
- 3,711 · -31.7%
- By 2075
- 2,649 · -51.3%
- By 2100
- 1,975 · -63.7%
Race, ethnicity, and origin ACS 2023
- Neighborhood character
- Predominantly White (72%)
- Race & ethnicity
- White 72% Hispanic / Latino 27% Two or more races 5%
- Hispanic origin (detail)
- Mexican 23%
- Common ancestry
- Iranian 24% Portuguese 2% Lithuanian 1%
- Foreign-born
- 6% · Canada
- Languages at home
- 76% English-only · Spanish 24%
Political lean MEDSL · Osceola
- 2024 margin
- Solid R (+64.2) · D 17.2% · R 81.5% · Other 1.3%
- 2008→2024 swing
- -32.6pp toward R · 2008: -31.7pp · 2024: -64.2pp
- All cycles
- 2024: R+64.2 2020: R+62.8 2016: R+61.8 2012: R+41.4 2008: R+31.7
Not yet ingested
- Civics
- —
Market trends
- HPI YoY
- ▲ 1.32%
- Current HPI
- 108.3892
- Rent YoY
- —
- Metro
- —
- State GDP YoY
- ▲ 2.48%
- F500 in state
- 4
Industry mix (Fortune 500 HQ in IA)
| Industry | F500 HQs | Revenue |
|---|---|---|
| Financial Services | 1 | $16B |
|
||
| Retail / Convenience | 1 | $15B |
|
||
Price history
+254.8% since first listed4 events — show timeline
- 2026-06-15 Listed $55,000 NWIA
- 2026-06-15 Listed $55,000 Iowa Great Lakes BOR
- 2026-06-15 Listed $55,000 NORTHSTARMLS as Distributed by MLS Grid
- 2010-08-18 Sold (Public Records) $15,500 Public Records
Property tax history
+2.2%/yrLatest (2025): $245 · +9.4% YoY. Source: county tax records.
Cash-flow waterfall
monthlySold comps — $/sqft
last 12 mo · ≤1 miLoading sold comps…