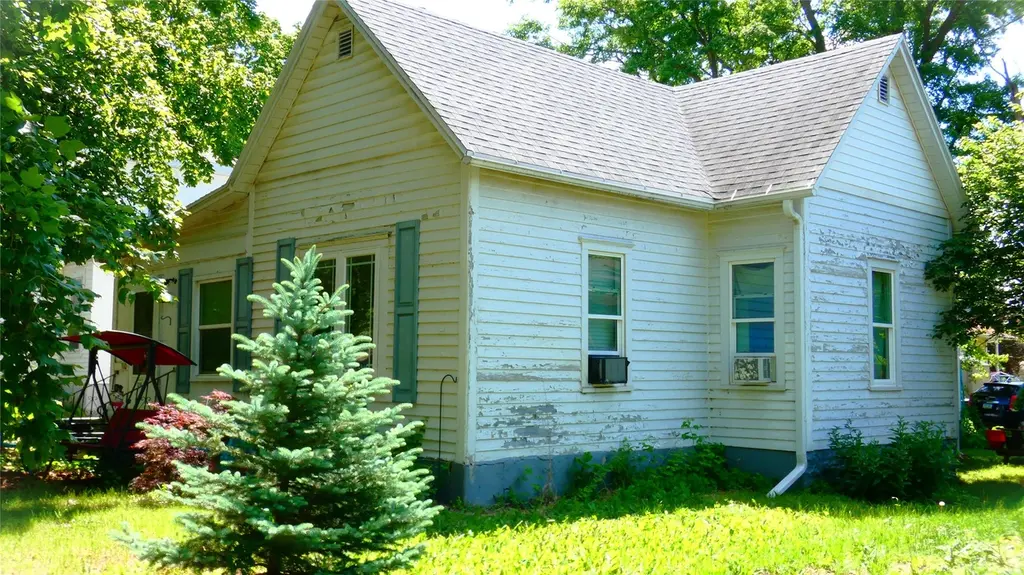
310 W Robinson St · Knoxville, IA
Flood risk 1/10 · Minimal
- FEMA flood zone
- X (unshaded)
- Chance of flooding over 30 yrs
- 0.0%
- Est. flood insurance / yr
- $473 – $860
Fire risk 3/10 · Minor
- Est. fire insurance / yr
- $902 – $1,676
Heat risk 3/10 · Minor
- Hot days now (above 105°F)
- 7 days/yr
- Hot days in 30 yrs
- 16 days/yr
Wind risk 2/10 · Minimal
- Chance of severe wind over 30 yrs
- —
Air-quality risk 2/10 · Minimal
- Unhealthy air days now
- 0 days/yr
- Unhealthy air days in 30 yrs
- 1 days/yr
Risk factors via First Street. Map © Google.
Why this score? — see what drove the B grade
The composite is a weighted blend of 9 inputs, each scored 0–100. Each bar is that input's sub-score; the figure is the points it added to the 100-point composite (weight × sub-score).
- Cash flow +30.0/30.0
- 1% rule +10.0/10.0
- DSCR +10.0/10.0
- ARV discount +7.5/15.0
- Schools +5.3/10.0
- Livability +3.5/5.0
- Rent growth +2.5/5.0
- Condition / age +2.5/5.0
- Appreciation +0.0/10.0
$59,900
🖨 Deal sheet 📄 Offer letter ✓ Due diligence
Listing remarks MLS
Solid home at an affordable price! This 2 bedroom 1 bath home has a spacious dining and living room with large windows, hardwood floors throughout and a large enclosed porch that has many possibilities. The two car detached garage/shed has plenty of room for extra storage. Schedule your appointment today!
Key facts
- 7,200 sq ft lot
- Garage
- Built 1910
Property features AI
Exterior
- Parking: Detached 1-car garage
- Utilities: Public water; Public sewer
- Home design: Entry includes main-level living (bedrooms on main level)
- Construction: Asphalt/rolled/shingle roof
- Exterior features: Concrete road frontage; Zoned residential
Interior
- Kitchen: Stove; Microwave; Refrigerator
- Bedrooms: 3 main-level bedrooms
- Bathrooms: 1 full bathroom
- Heating & cooling: Hot water heat (natural gas); Window air conditioning unit(s)
- Interior features: Dining area; Partial basement
- Laundry & utility: Laundry on main level; Dryer
Neighborhood map
What this means for you Summary
Snapshot
- This is a 2-bed/1.0-bath single-family listed at $60k.
Deal economics
- At list price, monthly cash flow is $277 ($3k/yr) — positive.
- The deal already cash-flows at list — no discount required.
- Meets the 1% rule at list price ($961 rent vs $60k).
- Recommended offer: $59k (1.5% below list) — sets the bar for market timing.
- Cap rate 11.8% vs local median 2.4% in Knoxville — top-decile yield for the area; either an underpriced asset or a hidden risk that comps aren't pricing in. Stress-test before assuming the spread holds.
Location & tenants
- Location reads 69/100 on livability (#406 in IA) — a middle-class / working-renter tenant base. Strengths: cost of living A+, housing A+, health & safety A+; Watch: amenities F, commute F.
- Knoxville Community School District (town): math 62% / reading 63% proficiency, ranked #220 of 289 in IA (top 76%) — acceptable for families but not a draw, mixed tenant base, ~2y average lease.
- Market conditions: 100 active listings in the ZIP; 2 comparable units currently listed for rent nearby; 122 units permitted in Marion County in 2024 (0 in 5+ unit buildings).
- This rent is only 15% of the median local income ($75k/yr) — well below the 30% rent-burden line; pricing power to push rent on renewal without tenant pushback.
Forward outlook
- Local home prices are declining (-3.0%/yr); year-one equity from $414 of loan paydown is wiped out by about $2k of value loss. Plan a longer hold.
- Marion County population projected to shrink 7% by 2050 — rents likely to lag national; underwrite the cash flow, not the appreciation.
- At projected returns (-3.0% appreciation + 3.0% rent growth), your $17k cash investment doubles in ~7 years — after that, you're playing with house money.
Negotiation context
- It's been on market 26 days — a 2% lower offer ($59k) is reasonable based on typical stale-listing flexibility.
- 6 sale attempts since 14y ago with the ask held roughly flat each time — persistent listings suggest the price (not the market) is what's stuck; bring a comps-based counter.
- Current owner paid $50k; 21% above their basis — modest negotiation headroom, anchor on the comps not their cost.
Risks & watch-outs
- Watch-outs: property tax is 2.9% of price; built in 1910 — expect roof / HVAC / electrical / plumbing capex.
Questions for the listing agent
- Built in 1910 — when were the roof, HVAC, electrical panel, plumbing, and water heater last replaced?
- Property tax is high relative to price — has the assessment been appealed recently, and will the sale trigger a re-assessment?
- Is there a deadline driving the sale (1031 exchange, divorce, estate, relocation)? That informs how much negotiation room exists.
- Schools are B-rated — typically a magnet for longer-tenancy family renters. What's the average tenant stay here, and is there a school-zone premium baked into asking?
- What's the average days-on-market for RENTAL listings here right now (not sales)? A rising rental-DOM trend means longer vacancies and softer asking-rent achievability than the comps imply.
- What's the recent tenant-quality profile in this submarket — average credit score on applications, eviction rate, late-payment / NSF rate, and stable-employment percentage? A property-management company in the area should have these aggregated.
- How much new for-sale + rental construction is in the pipeline within 1–3 miles? Heavy new supply typically softens prices + rents 12–24 months out; constrained supply supports both.
Investment metrics
- 1% rule
- 1.60% ✓
- Cap rate
- 11.83%
- Cash-on-cash
- 19.79%
- DSCR
- 1.88
- GRM
- 5.2
CMA / ARV
- ARV (on-the-fly)
- $163,944
- Comps found
- 12
Show comp detail 12 sales within ~0.75 mi
| Address | Dist | Beds/Ba | Sqft | Sold | Price | $/sf | Match |
|---|---|---|---|---|---|---|---|
| 502 W Marion St | 0.16mi | 2/1.5 | 1,197 (+1%) | 2mo | $123,500 | $103 | 88 |
| 713 W Main St | 0.23mi | 3/1.5 (+1) | 1,153 (-3%) | 5mo | $220,000 | $191 | 73 |
| 706 S 1st St | 0.35mi | 2/2.0 | 1,176 (-1%) | 6mo | $162,400 | $138 | 73 |
| 118 E Madison St | 0.37mi | 2/1.0 | 1,253 (+6%) | 2mo | $158,000 | $126 | 72 |
| 510 S 4th St | 0.38mi | 3/1.5 (+1) | 1,210 (+2%) | 1mo | $185,000 | $153 | 72 |
| 102 E Cronkhite St | 0.40mi | 3/1.0 (+1) | 1,224 (+3%) | 2mo | $140,000 | $114 | 70 |
| 601 W Marion St | 0.20mi | 3/1.5 (+1) | 1,281 (+8%) | 3mo | $13,000 | $10 | 68 |
| 421 N 2nd St | 0.40mi | 3/1.0 (+1) | 1,246 (+5%) | 5mo | $163,500 | $131 | 64 |
| 805 N Roche St | 0.56mi | 3/1.5 (+1) | 1,224 (+3%) | 1mo | $176,000 | $144 | 61 |
| 1501 W Roosevelt St | 0.70mi | 3/1.0 (+1) | 1,196 (+1%) | 1mo | $221,500 | $185 | 60 |
| 1202 W Desmont Dr | 0.52mi | 3/2.0 (+1) | 1,072 (-10%) | 0mo | $179,000 | $167 | 50 |
| 905 E Montgomery St | 0.69mi | 2/1.0 | 1,013 (-15%) | 0mo | $127,500 | $126 | 43 |
Match score weights: distance 35% · size 25% · config 20% · recency 20%. Top-matched comps best support the ARV.
Projected returns pro-forma
-3.0% appreciation · 3.0% rent growth · sell at horizon
- IRR
- 12.0%
- Equity multiple
- 1.47×
- Total profit
- $7,965
- Equity at exit
- $8,931
- IRR
- 21.0%
- Equity multiple
- 2.78×
- Total profit
- $29,848
- Equity at exit
- $5,179
Cash invested: $16,772 (down + closing). Projections, not guarantees.
Landlord ↔ Tenant lean methodology
- Overall (STATE)
- 83 Strongly Landlord-Friendly
- State Iowa
- 83 Strongly Landlord-Friendly · R+6
- County
- — inherits STATE
- City
- — inherits STATE
ZIP-level market 50138
- Home prices YoY
- -25.3%
- Active inventory
- 100
- Price-to-rent
- 5.2×
Monthly cashflow live
- Estimated rent
- $961 medium interval (Pro) →
- Mortgage (P&I)
- −$314
- Tax from tax record
- −$144 /mo · $1,722/yr
- Insurance
- −$25
- HOA
- −$0
- Vacancy / Maint / Mgmt
- −$202
- Net cashflow
- $277
Break-even live
UW: 25.0% down · 7.5% · 30yr · 1.5% tax · 5.0% vac · 8.0% maint · 8.0% mgmt
Financing live
Cash to close
- Down payment
- $14,975
- Closing costs
- $1,797
- Reserves months
- —
- Total cash needed
- —
Loan-product check · same deal, 3 products live
Conventional
25% down · 7.5% · 30yr
- Down + closing
- —
- Monthly P&I
- —
- Monthly cashflow
- —
- DSCR
- —
- Eligible?
- —
Personal DTI + credit; lowest rate.
DSCR
20% down · 8.5% · 30yr
- Down + closing
- —
- Monthly P&I
- —
- Monthly cashflow
- —
- DSCR
- —
- Eligible?
- —
No personal income docs; deal must DSCR.
Hard money
10% down · 12.0% · 12mo
- Down + closing
- —
- Monthly P&I
- —
- Monthly cashflow
- —
- DSCR
- —
- Eligible?
- —
Short-term bridge; refi at stabilization.
Rent comps 2 comps
| Address | Beds | Baths | Sqft | Rent | $/sqft | DOM | Units | Dist |
|---|---|---|---|---|---|---|---|---|
| 1870 W Pleasant St Unit 14 Knoxville, IA | 3.0 | 1.0 | 962 | $1,150 | $1.20 | 43d | 1 | 0.84mi |
| 1870 W Pleasant St Unit 33 Knoxville, IA | 2.0 | 1.0 | 740 | $925 | $1.25 | 43d | 1 | 0.84mi |
Listing history 30 events
-
2026-06-19days on market $59,900 Active 26 DOM
-
2026-06-18days on market $59,900 Active 25 DOM
-
2026-06-17days on market $59,900 Active 24 DOM
-
2026-06-16days on market $59,900 Active 23 DOM
-
2026-06-15days on market $59,900 Active 22 DOM
-
2026-06-14days on market $59,900 Active 20 DOM
-
2026-06-12days on market $59,900 Active 19 DOM
-
2026-06-09days on market $59,900 Active 16 DOM
-
2026-06-08days on market $59,900 Active 15 DOM
-
2026-06-07days on market $59,900 Active 14 DOM
-
2026-06-05days on market $59,900 Active 12 DOM
-
2026-06-03days on market $59,900 Active 10 DOM
-
2026-06-02days on market $59,900 Active 9 DOM
-
2026-06-01days on market $59,900 Active 8 DOM
-
2026-05-31days on market $59,900 Active 7 DOM
-
2026-05-30days on market $59,900 Active 6 DOM
-
2026-05-24$59,900 Active
-
2024-11-18soldstatus $49,500
-
2016-09-07soldstatus $49,500
-
2016-07-08soldstatus $49,500 307-char remark
Show marketing remark (307 chars)
Solid home at an affordable price! This 2 bedroom 1 bath home has a spacious dining and living room with large windows, hardwood floors throughout and a large enclosed porch that has many possibilities. The two car detached garage/shed has plenty of room for extra storage. Schedule your appointment today!
-
2016-02-20$49,500 307-char remark
Show marketing remark (307 chars)
Solid home at an affordable price! This 2 bedroom 1 bath home has a spacious dining and living room with large windows, hardwood floors throughout and a large enclosed porch that has many possibilities. The two car detached garage/shed has plenty of room for extra storage. Schedule your appointment today!
-
2014-10-01historical
-
2014-10-01historical
-
2014-06-25$54,900
-
2014-04-01$54,900
-
2014-03-05historical
-
2013-09-05$59,500
-
2013-02-12historical
-
2012-11-02$44,000
-
2005-11-29soldstatus $52,500
ⓘ Source: listings_history table (triggers on properties + properties_extension) + one-shot
backfill from property_details.listing_events for pre-trigger history.
Tax reassessment forecast IA · Partial reset (capped growth)
- Current annual tax
- $1,722 · $144/mo
- Projected year-2 tax
- $1,722 · $144/mo
- Expected delta
- $0/yr ($0/mo · 0.0%)
ⓘ Screening estimate from a state-policy table — verify with the county assessor before closing.
Climate risk First Street
- Flood 1/10 Low FEMA zone X (unshaded) · 0% chance over 30 yrs
- Wildfire 3/10 Moderate
- Heat 3/10 Moderate 7 d/yr ≥105°F today · 16 d/yr by 30 yrs out
- Wind 2/10 Low
- Air quality 2/10 Low 0 unhealthy d/yr today · 1 by 30 yrs out
Nearby sold comps map
Loading sold comps map…
Walkable amenities ~0.75 mi
Loading nearby amenities…
Taxation est. · year 1
- Rental income
- $11,531
- − Mortgage interest
- −$3,355
- − Property taxes
- −$1,722
- − Insurance
- −$300
- − Repairs & maintenance
- −$923
- − Management
- −$923
- − Depreciation
- −$1,743
- Taxable income
- $2,567
- Est. tax owed @ 24.0%
- −$616
- After-tax cash flow
- $2,703/yr
For passive investors: Depreciation is non-cash, so a rental often shows a tax loss while cash-flowing — sheltering income. Rental losses are passive: they offset passive income freely, and up to $25,000/yr can offset ordinary (W-2) income if you actively participate and your MAGI is under $100k (phasing out to $0 by $150k); unused losses carry forward. On sale, claimed depreciation is recaptured at up to 25%, and gains may owe capital-gains tax (a 1031 exchange can defer both). Figures are a year-1 estimate at your 24.0% rate — not tax advice; consult a CPA.
Schools (NCES district)
- District
- Knoxville Community School District
- NCES district ID
- 1915840
- Math proficiency
- 62% ▼ -6.00%
- Reading proficiency
- 63% ▬ 0.00%
- Median HH income
- $49,594
- Composite
- 53.11/100
- National rank
- #1512
- State rank
- #220 of 289 in IA
Livability — Knoxville
- Score
- 69/100
- State rank
- #406
- US rank
- #8643
Category grades
Schools grade is shown separately in the Schools card above.
Census & demographics
- Census place
- Knoxville, IA
- County
- Marion County · 25,533 people
- City population
- 11,117
- Metro
- Pella, IA
- Population (ZIP)
- 11,117
- Household income
- $74,693
- Rent vs Own
- Severe rent burden
- 122.0
Population outlook (Marion County) Hauer SSP2
- Today (2025)
- 32,883 people
- By 2030
- 32,685 · -0.6%
- By 2040
- 31,892 · -3.0%
- By 2050
- 30,691 · -6.7%
- By 2075
- 27,610 · -16.0%
- By 2100
- 23,851 · -27.5%
Race, ethnicity, and origin ACS 2023
- Neighborhood character
- Predominantly White (94%)
- Race & ethnicity
- White 94% Two or more races 3% Hispanic / Latino 2%
- Common ancestry
- Iranian 12% Portuguese 4% Italian 4%
- Foreign-born
- 1% · Philippines, Canada
- Languages at home
- 99% English-only · Spanish 1%
Political lean MEDSL · Marion
- 2024 margin
- Solid R (+37.8) · D 30.4% · R 68.2% · Other 1.4%
- 2008→2024 swing
- -27.0pp toward R · 2008: -10.8pp · 2024: -37.8pp
- All cycles
- 2024: R+37.8 2020: R+33.7 2016: R+31.2 2012: R+13.3 2008: R+10.8
Not yet ingested
- Civics
- —
Market trends
- HPI YoY
- ▼ -80.37%
- Current HPI
- 237.7055
- Rent YoY
- —
- Metro
- Pella, IA
- State GDP YoY
- ▲ 2.48%
- F500 in state
- 4
Industry mix (Fortune 500 HQ in IA)
| Industry | F500 HQs | Revenue |
|---|---|---|
| Financial Services | 1 | $16B |
|
||
| Retail / Convenience | 1 | $15B |
|
||
Price history
+14.1% since first listed14 events — show timeline
- 2026-05-24 Listed $59,900 DMMLS
- 2024-11-18 Sold (Public Records) $49,500 Public Records
- 2016-09-07 Sold (Public Records) $49,500 Public Records
- 2016-07-08 Sold (MLS) $49,500 DMMLS
- 2016-02-20 Listed $49,500 DMMLS
- 2014-10-01 Listing Removed — DMMLS
- 2014-10-01 Listing Removed — NORTHSTARMLS as Distributed by MLS Grid
- 2014-06-25 Listed $54,900 DMMLS
- 2014-04-01 Listed $54,900 NORTHSTARMLS as Distributed by MLS Grid
- 2014-03-05 Listing Removed — NORTHSTARMLS as Distributed by MLS Grid
- 2013-09-05 Listed $59,500 NORTHSTARMLS as Distributed by MLS Grid
- 2013-02-12 Listing Removed — NORTHSTARMLS as Distributed by MLS Grid
- 2012-11-02 Listed $44,000 NORTHSTARMLS as Distributed by MLS Grid
- 2005-11-29 Sold (Public Records) $52,500 Public Records
Property tax history
+4.1%/yrLatest (2025): $1,722 · +2.7% YoY. Source: county tax records.
Cash-flow waterfall
monthlySold comps — $/sqft
last 12 mo · ≤1 miLoading sold comps…