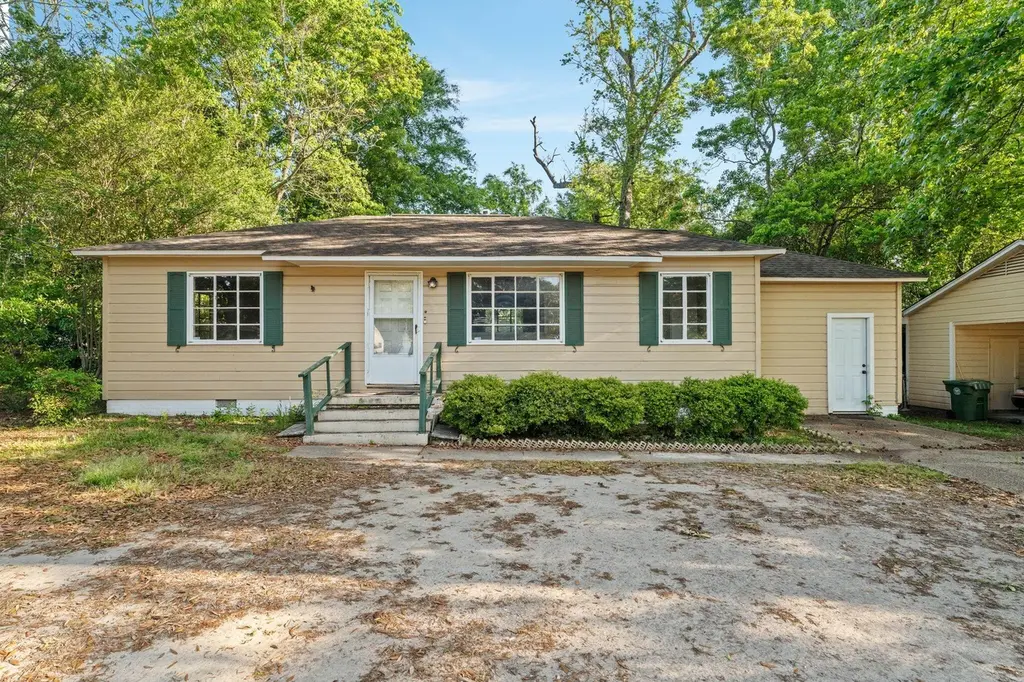
713 Myrtle St · Hattiesburg, MS
Flood risk 5/10 · Moderate
- FEMA flood zone
- X (unshaded)
- Chance of flooding over 30 yrs
- 0.65%
- Est. flood insurance / yr
- $507 – $1,088
Fire risk 1/10 · Minimal
- Est. fire insurance / yr
- $1,241 – $2,305
Heat risk 8/10 · Major
- Hot days now (above 106°F)
- 7 days/yr
- Hot days in 30 yrs
- 20 days/yr
Wind risk 8/10 · Major
- Chance of severe wind over 30 yrs
- 99.0%
Air-quality risk 1/10 · Minimal
- Unhealthy air days now
- 0 days/yr
- Unhealthy air days in 30 yrs
- 0 days/yr
Risk factors via First Street. Map © Google.
Why this score? — see what drove the B grade
The composite is a weighted blend of 9 inputs, each scored 0–100. Each bar is that input's sub-score; the figure is the points it added to the 100-point composite (weight × sub-score).
- Cash flow +28.7/30.0
- ARV discount +15.0/15.0
- DSCR +10.0/10.0
- 1% rule +8.0/10.0
- Rent growth +4.1/5.0
- Livability +4.0/5.0
- Condition / age +2.5/5.0
- Schools +2.0/10.0
- Appreciation +0.0/10.0
$89,000
🖨 Deal sheet 📄 Offer letter ✓ Due diligence
Listing remarks MLS
Great investment opportunity located just minutes from the zoo and area attractions! This 2 bedroom, 1 bathroom home offers strong potential as an addition to your rental portfolio or a great starter investment property. The home features a functional layout, spacious area that could be used as an office, flex space, or additional living area, and a spacious yard with plenty of room for outdoor enjoyment. Conveniently located with easy access to local amenities, dining, and entertainment. Property is being sold as is, offering an excellent opportunity for investors or buyers looking to add their own touch.
Key facts
- Spacious yard
- Easy access
- Spacious area
Tags
Neighborhood map
What this means for you Summary
Snapshot
- This is a 2-bed/1.0-bath single-family listed at $89k.
Deal economics
- At list price, monthly cash flow is $296 ($4k/yr) — positive.
- The deal already cash-flows at list — no discount required.
- Meets the 1% rule at list price ($1k rent vs $89k).
- Recommended offer: $84k (6.0% below list) — sets the bar for market timing.
- Cap rate 10.3% vs local median 4.0% in Hattiesburg — top-decile yield for the area; either an underpriced asset or a hidden risk that comps aren't pricing in. Stress-test before assuming the spread holds.
Location & tenants
- Location reads 79/100 on livability (#5 in MS, #2,046 nationally) — a middle-class / working-renter tenant base. Strengths: commute A+, cost of living A+, health & safety A+; Watch: schools D+, crime D+, employment F.
- Hattiesburg Public School District (urban): math 25% / reading 26% proficiency, ranked #81 of 130 in MS (top 62%) — low school quality limits family demand, transient renter base, plan for 1-2y turnover; 88% free/reduced lunch — lower-income household profile, screen leases tightly.
- Market conditions: Rents rising fast (+6.6%/yr); 261 active listings in the ZIP; 16 comparable units currently listed for rent nearby; rentals at typical pace (median 21d on market — plan ~3-4 weeks tenant-placement turnaround); 44% of comp listings sitting > 30 days — soft ceiling on asking rent; lower-income renter base — watch delinquency; 121 units permitted in Forrest County in 2024 (30 in 5+ unit buildings).
- This rent runs 34% of the median local income ($41k/yr) — at the standard rent-burdened threshold; future hikes will face affordability resistance.
Forward outlook
- Local home prices are declining (-3.0%/yr); year-one equity from $615 of loan paydown is wiped out by about $3k of value loss. Plan a longer hold.
- Forrest County population projected at +6% by 2050 — modest demand growth; plan on rents tracking national, not racing it.
- At projected returns (-3.0% appreciation + 6.6% rent growth), your $25k cash investment doubles in ~7 years — after that, you're playing with house money.
Negotiation context
- It's been on market 69 days — a 6% lower offer ($84k) is reasonable based on typical stale-listing flexibility.
Risks & watch-outs
- Watch-outs: built in 1956 — expect roof / HVAC / electrical / plumbing capex.
- Climate carrying-cost: moderate flood risk; severe wind risk, 99% chance of damaging wind over 30y; extreme-heat days projected 7→20/yr by 2055 (HVAC capex compounding) — expect insurance premiums to compound above CPI over the hold.
Questions for the listing agent
- It's been on market 69 days. Have you received any prior offers? Is the seller open to a 6% concession, seller financing, or rate buy-down credit?
- Built in 1956 — when were the roof, HVAC, electrical panel, plumbing, and water heater last replaced?
- Why hasn't it sold? Are there any deal-killer items the seller is aware of (foundation, flood, title, zoning, code violations)?
- Is there a deadline driving the sale (1031 exchange, divorce, estate, relocation)? That informs how much negotiation room exists.
- Schools are D-rated, which usually means shorter tenancies and higher turnover. Who's the typical renter profile here, and what's been the actual vacancy rate?
- Crime grade is D in this area — have there been break-ins, vandalism, or insurance claims at this property in the last 3 years? What carrier currently insures it and at what premium?
- What's the average days-on-market for RENTAL listings here right now (not sales)? A rising rental-DOM trend means longer vacancies and softer asking-rent achievability than the comps imply.
- What's the recent tenant-quality profile in this submarket — average credit score on applications, eviction rate, late-payment / NSF rate, and stable-employment percentage? A property-management company in the area should have these aggregated.
- How much new for-sale + rental construction is in the pipeline within 1–3 miles? Heavy new supply typically softens prices + rents 12–24 months out; constrained supply supports both.
Investment metrics
- 1% rule
- 1.30% ✓
- Cap rate
- 10.29%
- Cash-on-cash
- 14.27%
- DSCR
- 1.63
- GRM
- 6.4
CMA / ARV
- ARV (median comp)
- $148,763
- List price
- $89,000
- Delta
- -40.17%
- Verdict
- UNDERPRICED
- Comps
- 20 within 1.0 mi
Show comp detail 6 sales within ~0.75 mi
| Address | Dist | Beds/Ba | Sqft | Sold | Price | $/sf | Match |
|---|---|---|---|---|---|---|---|
| 1704 Louise St | 0.23mi | 3/2.0 (+1) | 1,200 (-2%) | 11mo | $167,900 | $140 | 68 |
| 214 Park Ave | 0.40mi | 2/1.0 | 1,219 (-0%) | 16mo | $149,900 | $123 | 67 |
| 203 Park Ave | 0.39mi | 3/1.0 (+1) | 1,140 (-7%) | 3mo | $174,900 | $153 | 63 |
| 1014 W 5th St | 0.32mi | 2/1.0 | 1,069 (-13%) | 14mo | $119,900 | $112 | 53 |
| 1431 W 7th St | 0.56mi | 3/2.0 (+1) | 1,292 (+6%) | 12mo | $210,000 | $163 | 45 |
| 1506 Mamie St | 0.70mi | 2/1.0 | 1,142 (-7%) | 21mo | $145,000 | $127 | 39 |
Match score weights: distance 35% · size 25% · config 20% · recency 20%. Top-matched comps best support the ARV.
Projected returns pro-forma
-3.0% appreciation · 6.56% rent growth · sell at horizon
- IRR
- 8.6%
- Equity multiple
- 1.35×
- Total profit
- $8,772
- Equity at exit
- $13,270
- IRR
- 20.7%
- Equity multiple
- 3.05×
- Total profit
- $51,028
- Equity at exit
- $7,695
Cash invested: $24,920 (down + closing). Projections, not guarantees.
Landlord ↔ Tenant lean methodology
- Overall (STATE)
- 90 Strongly Landlord-Friendly
- State Mississippi
- 90 Strongly Landlord-Friendly · R+11
- County
- — inherits STATE
- City
- — inherits STATE
ZIP-level market 39401
- Rents YoY
- 6.6%
- Active inventory
- 261
- Price-to-rent
- 6.4×
Monthly cashflow live
- Estimated rent
- $1,160 high interval (Pro) →
- Mortgage (P&I)
- −$467
- Tax from tax record
- −$117 /mo · $1,399/yr
- Insurance
- −$37
- HOA
- −$0
- Vacancy / Maint / Mgmt
- −$244
- Net cashflow
- $296
Break-even live
UW: 25.0% down · 7.5% · 30yr · 1.5% tax · 5.0% vac · 8.0% maint · 8.0% mgmt
Financing live
Cash to close
- Down payment
- $22,250
- Closing costs
- $2,670
- Reserves months
- —
- Total cash needed
- —
Loan-product check · same deal, 3 products live
Conventional
25% down · 7.5% · 30yr
- Down + closing
- —
- Monthly P&I
- —
- Monthly cashflow
- —
- DSCR
- —
- Eligible?
- —
Personal DTI + credit; lowest rate.
DSCR
20% down · 8.5% · 30yr
- Down + closing
- —
- Monthly P&I
- —
- Monthly cashflow
- —
- DSCR
- —
- Eligible?
- —
No personal income docs; deal must DSCR.
Hard money
10% down · 12.0% · 12mo
- Down + closing
- —
- Monthly P&I
- —
- Monthly cashflow
- —
- DSCR
- —
- Eligible?
- —
Short-term bridge; refi at stabilization.
Rent comps 16 comps
| Address | Beds | Baths | Sqft | Rent | $/sqft | DOM | Units | Dist |
|---|---|---|---|---|---|---|---|---|
| 1302 Hardy St Apt A Hattiesburg, MS | 2.0 | 1.5 | 1000 | $900 | $0.90 | 44d | 1 | 0.35mi |
| 416 N 19th Ave Hattiesburg, MS | 2.0 | 1.0 | 1100 | $1,250 | $1.14 | 21d | 1 | 0.48mi |
| 107 Kimball Ave Hattiesburg, MS | 3.0 | 1.0 | 1500 | $1,375 | $0.92 | 21d | 1 | 0.53mi |
| 217 Patton Ave Hattiesburg, MS | 3.0 | 1.0 | 1008 | $1,300 | $1.29 | 21d | 1 | 0.71mi |
| 112 Dearborne St Unit A Hattiesburg, MS | 2.0 | 1.0 | 1000 | $1,450 | $1.45 | 21d | 1 | 0.73mi |
| 112 Dearborne St Unit B Hattiesburg, MS | 2.0 | 2.0 | 1000 | $1,450 | $1.45 | 21d | 1 | 0.73mi |
| 2304 W 7th St Hattiesburg, MS | 1.0–3.0 | 1.0–2.5 | 1175 | $880 | $0.75 | 21d | 1 | 0.88mi |
| 901 W Pine St Hattiesburg, MS | 1.0–2.0 | 1.0–1.5 | 930 | $1,200 | $1.29 | 21d | 1 | 0.99mi |
| 307 S 23rd Ave Hattiesburg, MS | 3.0 | 2.0 | 1300 | $1,595 | $1.23 | 44d | 1 | 1.00mi |
| 2501 W 7th St Hattiesburg, MS | 1.0–2.0 | 1.0 | 753 | $740 | $0.98 | 21d | 1 | 1.09mi |
| 801 N 28th Ave Unit 028 Hattiesburg, MS | 2.0 | 1.5 | 787 | $875 | $1.11 | 44d | 1 | 1.22mi |
| 2808 W 7th St Hattiesburg, MS | 1.0–2.0 | 1.0 | 650 | $899 | $1.38 | 21d | 1 | 1.26mi |
| 720 N 28th Ave Hattiesburg, MS | 3.0 | 2.5 | 1200 | $1,307 | $1.09 | 44d | 3 | 1.30mi |
| 211 Chevy Chase Dr Apt 5 Hattiesburg, MS | 2.0 | 2.0 | 917 | $995 | $1.09 | 44d | 1 | 1.33mi |
| 521 W Laurel Ave Hattiesburg, MS | 1.0 | 1.0 | 750 | $975 | $1.30 | 44d | 1 | 1.38mi |
| 1205 N 25th Ave Hattiesburg, MS | 2.0 | 1.0 | 775 | $975 | $1.26 | 44d | 1 | 1.44mi |
Listing history 18 events
-
2026-06-19days on market $89,000 Active 69 DOM
-
2026-06-18days on market $89,000 Active 68 DOM
-
2026-06-17days on market $89,000 Active 67 DOM
-
2026-06-16days on market $89,000 Active 66 DOM
-
2026-06-15days on market $89,000 Active 65 DOM
-
2026-06-14days on market $89,000 Active 63 DOM
-
2026-06-13days on market $89,000 Active 62 DOM
-
2026-06-10days on market $89,000 Active 60 DOM
-
2026-06-09days on market $89,000 Active 59 DOM
-
2026-06-08days on market $89,000 Active 58 DOM
-
2026-06-07days on market $89,000 Active 57 DOM
-
2026-06-05days on market $89,000 Active 54 DOM
-
2026-06-03days on market $89,000 Active 53 DOM
-
2026-06-02days on market $89,000 Active 52 DOM
-
2026-06-01days on market $89,000 Active 51 DOM
-
2026-05-31days on market $89,000 Active 50 DOM
-
2026-05-30days on market $89,000 Active 49 DOM
-
2026-04-11$89,000 Active 613-char remark
Show marketing remark (613 chars)
Great investment opportunity located just minutes from the zoo and area attractions! This 2 bedroom, 1 bathroom home offers strong potential as an addition to your rental portfolio or a great starter investment property. The home features a functional layout, spacious area that could be used as an office, flex space, or additional living area, and a spacious yard with plenty of room for outdoor enjoyment. Conveniently located with easy access to local amenities, dining, and entertainment. Property is being sold as is, offering an excellent opportunity for investors or buyers looking to add their own touch.
ⓘ Source: listings_history table (triggers on properties + properties_extension) + one-shot
backfill from property_details.listing_events for pre-trigger history.
Tax reassessment forecast MS · Resets to sale price
- Current annual tax
- $1,399 · $117/mo
- Projected year-2 tax
- $1,399 · $117/mo
- Expected delta
- $0/yr ($0/mo · 0.0%)
ⓘ Screening estimate from a state-policy table — verify with the county assessor before closing.
Climate risk First Street
- Flood 5/10 Major FEMA zone X (unshaded) · 65% chance over 30 yrs
- Wildfire 1/10 Low
- Heat 8/10 Severe 7 d/yr ≥106°F today · 20 d/yr by 30 yrs out
- Wind 8/10 Severe 99% chance of damaging wind over 30 yrs
- Air quality 1/10 Low 0 unhealthy d/yr today · 0 by 30 yrs out
Nearby sold comps map
Loading sold comps map…
Walkable amenities ~0.75 mi
Loading nearby amenities…
Taxation est. · year 1
- Rental income
- $13,924
- − Mortgage interest
- −$4,985
- − Property taxes
- −$1,399
- − Insurance
- −$445
- − Repairs & maintenance
- −$1,114
- − Management
- −$1,114
- − Depreciation
- −$2,589
- Taxable income
- $2,278
- Est. tax owed @ 24.0%
- −$547
- After-tax cash flow
- $3,008/yr
For passive investors: Depreciation is non-cash, so a rental often shows a tax loss while cash-flowing — sheltering income. Rental losses are passive: they offset passive income freely, and up to $25,000/yr can offset ordinary (W-2) income if you actively participate and your MAGI is under $100k (phasing out to $0 by $150k); unused losses carry forward. On sale, claimed depreciation is recaptured at up to 25%, and gains may owe capital-gains tax (a 1031 exchange can defer both). Figures are a year-1 estimate at your 24.0% rate — not tax advice; consult a CPA.
Schools (NCES district)
- District
- Hattiesburg Public School District
- NCES district ID
- 2801800
- Math proficiency
- 25% ▼ -12.00%
- Reading proficiency
- 26% ▼ -6.00%
- Median HH income
- $28,058
- Composite
- 20.38/100
- National rank
- #8595
- State rank
- #81 of 130 in MS
Livability — Hattiesburg
- Score
- 79/100
- State rank
- #5
- US rank
- #2046
Category grades
Schools grade is shown separately in the Schools card above.
Census & demographics
- Census place
- Hattiesburg, MS
- County
- Forrest County · 65,413 people
- City population
- 87,151
- Metro
- Hattiesburg, MS
- Population (ZIP)
- 42,531
- Household income
- $41,127
- Rent vs Own
- Severe rent burden
- 2534.0
Population outlook (Forrest County) Hauer SSP2
- Today (2025)
- 79,264 people
- By 2030
- 80,822 · +2.0%
- By 2040
- 82,979 · +4.7%
- By 2050
- 84,324 · +6.4%
- By 2075
- 84,942 · +7.2%
- By 2100
- 80,616 · +1.7%
Race, ethnicity, and origin ACS 2023
- Neighborhood character
- Diverse neighborhood (Simpson 0.57)
- Race & ethnicity
- Black 52% White 40% Two or more races 5% Hispanic / Latino 4%
- Common ancestry
- Slovak 2% Lithuanian 2% Serbian 1%
- Foreign-born
- 3% · Canada, China
- Languages at home
- 96% English-only · Spanish 2%
Political lean MEDSL · Forrest
- 2024 margin
- R (+17.9) · D 40.3% · R 58.2% · Other 1.4%
- 2008→2024 swing
- -4.4pp toward R · 2008: -13.5pp · 2024: -17.9pp
- All cycles
- 2024: R+17.9 2020: R+11.1 2016: R+14.2 2012: R+11.7 2008: R+13.5
Not yet ingested
- Civics
- —
Market trends
- HPI YoY
- ▼ -148.93%
- Current HPI
- 137.87
- Rent YoY
- ▲ 6.56%
- Metro
- Hattiesburg, MS
- State GDP YoY
- —
- F500 in state
- 0
Price history
1 event — show timeline
- 2026-04-11 Listed $89,000 HAAR
Property tax history
+8.9%/yrLatest (2025): $1,399 · +19.2% YoY. Source: county tax records.
Cash-flow waterfall
monthlySold comps — $/sqft
last 12 mo · ≤1 miLoading sold comps…