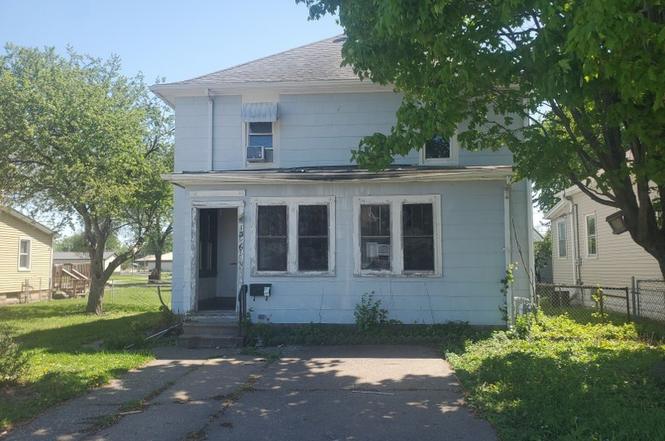
1306 17th St · East Moline, IL
Flood risk 5/10 · Moderate
- FEMA flood zone
- X (unshaded)
- Chance of flooding over 30 yrs
- 0.66%
- Est. flood insurance / yr
- $507 – $1,088
Fire risk 1/10 · Minimal
- Est. fire insurance / yr
- $804 – $1,492
Heat risk 3/10 · Minor
- Hot days now (above 104°F)
- 7 days/yr
- Hot days in 30 yrs
- 17 days/yr
Wind risk 2/10 · Minimal
- Chance of severe wind over 30 yrs
- —
Air-quality risk 3/10 · Minor
- Unhealthy air days now
- 2 days/yr
- Unhealthy air days in 30 yrs
- 3 days/yr
Risk factors via First Street. Map © Google.
Why this score? — see what drove the B- grade
The composite is a weighted blend of 9 inputs, each scored 0–100. Each bar is that input's sub-score; the figure is the points it added to the 100-point composite (weight × sub-score).
- Cash flow +30.0/30.0
- 1% rule +10.0/10.0
- DSCR +10.0/10.0
- ARV discount +7.5/15.0
- Livability +3.1/5.0
- Rent growth +2.5/5.0
- Condition / age +2.5/5.0
- Schools +1.2/10.0
- Appreciation +0.0/10.0
$28,000
🖨 Deal sheet (PDF) 📄 Offer letter ✓ Due diligence
Listing remarks MLS
OCCUPIED BY THE SAME FAMILY THROUGH GENERATIONS. XYNCE WINDOWS, ENERGY EFFICIENT FURN, NEWER ROOF, AND UNBELIEVABLE AMOUNT OF STORAGE IN ATTIC BASEMENT, AS WELL AS FULL WALK-UP STORAGE ABOVE 2-CAR GARAGE. LOTS OF GREAT WOODWORK AND ONE ON THOSE SINKS SURROUNDED BY A PANTRY, AND MAIN FLOOR LAUNDRY WITH MORE STORAGE AREA. PRICED TO SELL.
Key facts
- Fenced yard
- Front porch
- 6,098 sq ft lot
Tags
Property features AI
Finance
- HOA & community: No master association fee required
Exterior
- Utilities: Public water; Public sewer
- Home design: Detached single-family home; Two-story layout; Fee simple ownership; Built over 100 years ago; Asphalt roof; Brick/mortar foundation
- Construction: Brick/mortar foundation; Asphalt roof; Built before 1978
- Exterior features: Level lot
Interior
- Kitchen: Kitchen on main level (10 x 12) with vinyl flooring
- Bedrooms: Master bedroom on second floor (10 x 12) with laminate flooring; Second bedroom on second floor (10 x 12) with hardwood flooring; Third bedroom on second floor (10 x 11) with laminate flooring; Den on second floor (6 x 11) with other flooring
- Flooring: Hardwood flooring in living room, family room, and some bedrooms; Laminate flooring in master bedroom and one bedroom; Vinyl flooring in kitchen; Other flooring in den
- Bathrooms: Two full bathrooms
- Heating & cooling: Natural gas heating; Central air conditioning
- Interior features: Seven total rooms; Unfinished partial basement
- Laundry & utility: Main-level laundry room (4 x 4)
Neighborhood map
What this means for you Summary
Snapshot
- This is a 3-bed/2.0-bath single-family listed at $28k.
Deal economics
- At list price, monthly cash flow is $706 ($8k/yr) — positive.
- The deal already cash-flows at list — no discount required.
- Meets the 1% rule at list price ($1k rent vs $28k).
- Cap rate 36.5% vs local median 3.5% in East Moline — top-decile yield for the area; either an underpriced asset or a hidden risk that comps aren't pricing in. Stress-test before assuming the spread holds.
Location & tenants
- Location reads 62/100 on livability (#870 in IL) — a middle-class / working-renter tenant base. Strengths: cost of living A+, housing A+; Watch: crime C-, employment C-, schools F.
- United Twp Hsd 30 (suburban): math 12% / reading 15% proficiency, ranked #536 of 620 in IL (top 86%) — low school quality limits family demand, transient renter base, plan for 1-2y turnover.
- Market conditions: 124 active listings in the ZIP; 5 comparable units currently listed for rent nearby; rentals at typical pace (median 22d on market — plan ~3-4 weeks tenant-placement turnaround); 116 units permitted in Rock Island County in 2024 (50 in 5+ unit buildings).
Forward outlook
- Local home prices are declining (-3.0%/yr); year-one equity from $194 of loan paydown is wiped out by about $840 of value loss. Plan a longer hold.
- Rock Island County population projected at -12% by 2050 — secular population decline; favor cash flow + early exit over multi-decade hold.
- At projected returns (-3.0% appreciation + 3.0% rent growth), your $8k cash investment doubles in ~2 years — after that, you're playing with house money.
Negotiation context
- Only 3 days on market — expect competitive offers; lowballing is unlikely to land.
- 3 sale attempts since 18y ago with the ask held roughly flat each time — persistent listings suggest the price (not the market) is what's stuck; bring a comps-based counter.
Risks & watch-outs
- Watch-outs: built in 1915 — expect roof / HVAC / electrical / plumbing capex.
- Climate carrying-cost: moderate flood risk — expect insurance premiums to compound above CPI over the hold.
Questions for the listing agent
- Built in 1915 — when were the roof, HVAC, electrical panel, plumbing, and water heater last replaced?
- Is there a deadline driving the sale (1031 exchange, divorce, estate, relocation)? That informs how much negotiation room exists.
- Schools are F-rated, which usually means shorter tenancies and higher turnover. Who's the typical renter profile here, and what's been the actual vacancy rate?
- What's the average days-on-market for RENTAL listings here right now (not sales)? A rising rental-DOM trend means longer vacancies and softer asking-rent achievability than the comps imply.
- What's the recent tenant-quality profile in this submarket — average credit score on applications, eviction rate, late-payment / NSF rate, and stable-employment percentage? A property-management company in the area should have these aggregated.
- How much new for-sale + rental construction is in the pipeline within 1–3 miles? Heavy new supply typically softens prices + rents 12–24 months out; constrained supply supports both.
Investment metrics
- 1% rule
- 4.06% ✓
- Cap rate
- 36.54%
- Cash-on-cash
- 108.01%
- DSCR
- 5.81
- GRM
- 2.1
CMA / ARV
- ARV (on-the-fly)
- $137,361
- Comps found
- 5
Show comp detail 5 sales within ~0.75 mi
| Address | Dist | Beds/Ba | Sqft | Sold | Price | $/sf | Match |
|---|---|---|---|---|---|---|---|
| 2019 11th Street Pl | 0.56mi | 4/2.5 (+1) | 1,594 (+8%) | 2mo | $202,000 | $127 | 51 |
| 1352 10th Ave | 0.22mi | 2/2.0 (-1) | 1,312 (-11%) | 20mo | $122,000 | $93 | 50 |
| 1133 20th Ave | 0.50mi | 3/2.0 | 1,260 (-15%) | 9mo | $210,000 | $167 | 45 |
| 158 5th St | 0.63mi | 3/1.0 | 1,292 (-12%) | 4mo | $90,000 | $70 | 42 |
| 225 Hero St | 0.62mi | 2/1.0 (-1) | 1,404 (-5%) | 22mo | $18,500 | $13 | 36 |
Match score weights: distance 35% · size 25% · config 20% · recency 20%. Top-matched comps best support the ARV.
Projected returns pro-forma
-3.0% appreciation · 3.0% rent growth · sell at horizon
- IRR
- —
- Equity multiple
- 6.16×
- Total profit
- $40,424
- Equity at exit
- $4,175
- IRR
- —
- Equity multiple
- 12.88×
- Total profit
- $93,144
- Equity at exit
- $2,421
Cash invested: $7,840 (down + closing). Projections, not guarantees.
Landlord ↔ Tenant lean methodology
- Overall (STATE)
- 43 Moderately Tenant-Leaning
- State Illinois
- 43 Moderately Tenant-Leaning · D+7
- County
- — inherits STATE
- City
- — inherits STATE
ZIP-level market 61244
- Active inventory
- 124
- Price-to-rent
- 2.1×
Monthly cashflow live
- Estimated rent
- $1,138 high interval (Pro) →
- Mortgage (P&I)
- −$147
- Tax est. 1.5%
- −$35 /mo · $420/yr
- Insurance
- −$12
- HOA
- −$0
- Vacancy / Maint / Mgmt
- −$239
- Net cashflow
- $706
Break-even live
Sensitivity live
| Price | -10% $725 | -5% $715 | +0% $706 | +5% $696 | +10% $686 |
|---|---|---|---|---|---|
| Rent | -10% $616 | -5% $661 | +0% $706 | +5% $751 | +10% $796 |
| Rate | -1.0pp $720 | -0.5pp $713 | base $706 | +0.5pp $698 | +1.0pp $691 |
UW: 25.0% down · 7.5% · 30yr · 1.5% tax · 5.0% vac · 8.0% maint · 8.0% mgmt
Financing live
Cash to close
- Down payment
- $7,000
- Closing costs
- $840
- Reserves months
- —
- Total cash needed
- —
Loan-product check · same deal, 3 products live
Conventional
25% down · 7.5% · 30yr
- Down + closing
- —
- Monthly P&I
- —
- Monthly cashflow
- —
- DSCR
- —
- Eligible?
- —
Personal DTI + credit; lowest rate.
DSCR
20% down · 8.5% · 30yr
- Down + closing
- —
- Monthly P&I
- —
- Monthly cashflow
- —
- DSCR
- —
- Eligible?
- —
No personal income docs; deal must DSCR.
Hard money
10% down · 12.0% · 12mo
- Down + closing
- —
- Monthly P&I
- —
- Monthly cashflow
- —
- DSCR
- —
- Eligible?
- —
Short-term bridge; refi at stabilization.
Rent comps 5 comps
| Address | Beds | Baths | Sqft | Rent | $/sqft | DOM | Units | Dist |
|---|---|---|---|---|---|---|---|---|
| 123 3rd St Unit House Silvis, IL | 2.0 | 1.0 | 1017 | $1,150 | $1.13 | 21d | 1 | 0.50mi |
| 777 20th Ave Unit 1 East Moline, IL | 2.0 | 1.0 | 1030 | $1,090 | $1.06 | 21d | 1 | 0.89mi |
| 1842 28th Ave East Moline, IL | 2.0 | 1.0 | 914 | $1,100 | $1.20 | 14d | 1 | 1.12mi |
| 427 17th Ave East Moline, IL | 2.0 | 1.0 | 1186 | $1,100 | $0.93 | 14d | 1 | 1.28mi |
| 625 25th Ave Unit 625 East Moline, IL | 2.0 | 1.0 | 888 | $900 | $1.01 | 21d | 1 | 1.28mi |
Listing history 4 events
-
2026-06-18days on market $28,000 Active 3 DOM
-
2026-06-17days on market $28,000 Active 2 DOM
-
2026-06-15remarks 233-char remark
-
2026-06-15$28,000 Active 1 DOM
ⓘ Source: listings_history table (triggers on properties + properties_extension) + one-shot
backfill from property_details.listing_events for pre-trigger history.
Climate risk First Street
- Flood 5/10 Major FEMA zone X (unshaded) · 66% chance over 30 yrs
- Wildfire 1/10 Low
- Heat 3/10 Moderate 7 d/yr ≥104°F today · 17 d/yr by 30 yrs out
- Wind 2/10 Low
- Air quality 3/10 Moderate 2 unhealthy d/yr today · 3 by 30 yrs out
Nearby sold comps map
Loading sold comps map…
Walkable amenities ~0.75 mi
Loading nearby amenities…
Taxation est. · year 1
- Rental income
- $13,658
- − Mortgage interest
- −$1,568
- − Property taxes
- −$420
- − Insurance
- −$140
- − Repairs & maintenance
- −$1,093
- − Management
- −$1,093
- − Depreciation
- −$815
- Taxable income
- $8,530
- Est. tax owed @ 24.0%
- −$2,047
- After-tax cash flow
- $6,421/yr
For passive investors: Depreciation is non-cash, so a rental often shows a tax loss while cash-flowing — sheltering income. Rental losses are passive: they offset passive income freely, and up to $25,000/yr can offset ordinary (W-2) income if you actively participate and your MAGI is under $100k (phasing out to $0 by $150k); unused losses carry forward. On sale, claimed depreciation is recaptured at up to 25%, and gains may owe capital-gains tax (a 1031 exchange can defer both). Figures are a year-1 estimate at your 24.0% rate — not tax advice; consult a CPA.
Schools (NCES district)
- District
- United Twp Hsd 30
- NCES district ID
- 1739870
- Math proficiency
- 12% ▼ -5.00%
- Reading proficiency
- 15% ▼ -6.00%
- Median HH income
- $43,647
- Composite
- 11.91/100
- National rank
- #9670
- State rank
- #536 of 620 in IL
Livability — East Moline
- Score
- 62/100
- State rank
- #870
- US rank
- #16964
Category grades
Schools grade is shown separately in the Schools card above.
Census & demographics
- Census place
- East Moline, IL
- County
- Rock Island County · 103,822 people
- City population
- 23,308
- Metro
- Davenport-Moline-Rock Island, IA-IL
- Population (ZIP)
- 23,308
- Household income
- $63,819
- Rent vs Own
- Severe rent burden
- 746.0
Population outlook (Rock Island County) Hauer SSP2
- Today (2025)
- 140,982 people
- By 2030
- 137,705 · -2.3%
- By 2040
- 130,512 · -7.4%
- By 2050
- 123,841 · -12.2%
- By 2075
- 109,851 · -22.1%
- By 2100
- 90,922 · -35.5%
Race, ethnicity, and origin ACS 2023
- Neighborhood character
- Diverse neighborhood (Simpson 0.62)
- Race & ethnicity
- White 55% Hispanic / Latino 19% Black 18% Two or more races 9% Asian 3%
- Hispanic origin (detail)
- Mexican 17%
- Common ancestry
- English 3% Lithuanian 2% Romanian 2%
- Foreign-born
- 13% · Canada, United Kingdom, Philippines
- Languages at home
- 78% English-only · Spanish 12% French/Haitian/Cajun 3% Other Asian/Pacific 2%
Political lean MEDSL · Rock Island
- 2024 margin
- Lean D (+9.6) · D 53.9% · R 44.4% · Other 1.7%
- 2008→2024 swing
- -15.0pp toward R · 2008: 24.6pp · 2024: 9.6pp
- All cycles
- 2024: D+9.6 2020: D+12.1 2016: D+8.4 2012: D+21.9 2008: D+24.6
Not yet ingested
- Civics
- —
Market trends
- HPI YoY
- ▼ -108.05%
- Current HPI
- 154.4012
- Rent YoY
- —
- Metro
- Davenport-Moline-Rock Island, IA-IL
- State GDP YoY
- ▲ 1.59%
- F500 in state
- 60
Industry mix (Fortune 500 HQ in IL)
| Industry | F500 HQs | Revenue |
|---|---|---|
| Insurance | 4 | $201B |
|
||
| Consumer Goods | 4 | $87B |
|
||
| Industrial Machinery | 3 | $64B |
|
||
| Healthcare | 2 | $55B |
|
||
| Retail / Pharmacy | 1 | $148B |
|
||
| Agriculture / Food | 1 | $86B |
|
||
Price history
-59.7% since first listed6 events — show timeline
- 2026-06-14 Listed $28,000 MRED as Distributed by MLS Grid
- 2008-09-26 Sold (Public Records) $70,000 Public Records
- 2008-09-26 Sold (MLS) $70,000 MRED as Distributed by MLS Grid
- 2008-09-26 Sold (MLS) $70,000 RMLSA as Distributed by MLS Grid
- 2008-03-24 Listed $69,500 MRED as Distributed by MLS Grid
- 2008-03-24 Listed $69,500 RMLSA as Distributed by MLS Grid
Property tax history
-0.4%/yrLatest (2024): $1,923 · +6.2% YoY. Source: county tax records.
Cash-flow waterfall
monthlySold comps — $/sqft
last 12 mo · ≤1 miLoading sold comps…