445 Gramatan Ave Unit FC2 · Mount Vernon, NY
Flood risk 1/10 · Minimal
- FEMA flood zone
- X (unshaded)
- Chance of flooding over 30 yrs
- 0.0%
- Est. flood insurance / yr
- $507 – $1,088
Fire risk 1/10 · Minimal
- Est. fire insurance / yr
- $691 – $1,283
Heat risk 6/10 · Moderate
- Hot days now (above 98°F)
- 7 days/yr
- Hot days in 30 yrs
- 15 days/yr
Wind risk 6/10 · Moderate
- Chance of severe wind over 30 yrs
- 27.0%
Air-quality risk 5/10 · Moderate
- Unhealthy air days now
- 6 days/yr
- Unhealthy air days in 30 yrs
- 8 days/yr
Risk factors via First Street. Map © Google.
Why this score? — see what drove the B- grade
The composite is a weighted blend of 9 inputs, each scored 0–100. Each bar is that input's sub-score; the figure is the points it added to the 100-point composite (weight × sub-score).
- Cash flow +28.3/30.0
- DSCR +10.0/10.0
- 1% rule +7.8/10.0
- ARV discount +7.5/15.0
- Rent growth +4.3/5.0
- Schools +3.7/10.0
- Livability +3.6/5.0
- Condition / age +2.5/5.0
- Appreciation +0.0/10.0
$220,000
🖨 Deal sheet 📄 Offer letter ✓ Due diligence
Listing remarks MLS
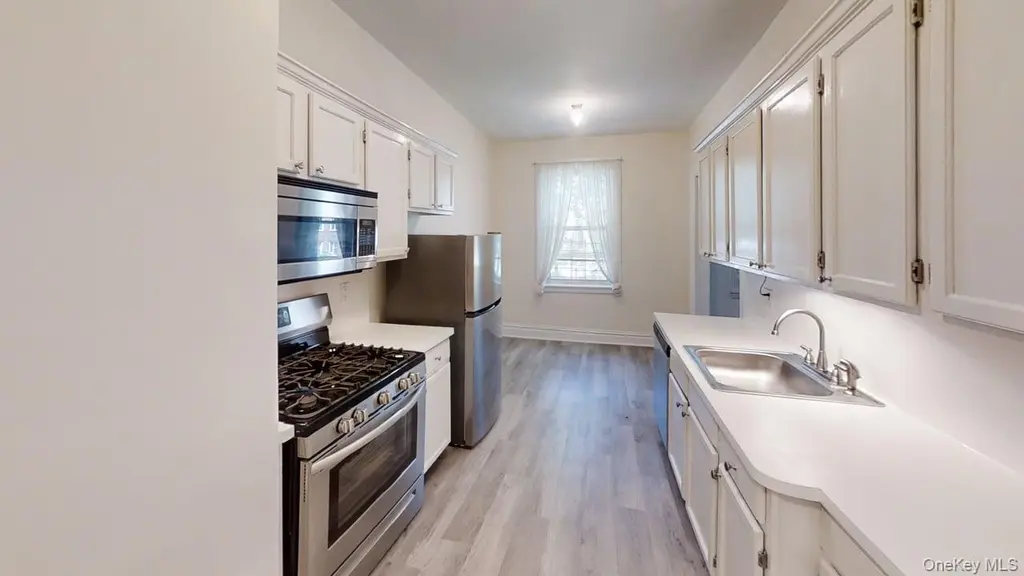
Sunny and spacious 2 bedroom in lovely garden setting. Move in condition with EIK & wonderful closet space. Walk to Fleetwood RR & Village. Building has pre-war details, hardwood floors, 9 ft. ceilings and assigned parking. This is a walk-up building.
Key facts
- Assigned parking
- Built 1941
- Listed 20 days
Tags
Property features AI
Finance
- HOA & community: Association: Westchester Gardens; Association amenities include landscaping, live-in superintendent, grounds maintenance, parking, snow removal, and trash service; Additional monthly fee for fuel (approximately $30.31)
Exterior
- Parking: Assigned parking (monthly fee $60)
- Security: Smoke detectors
- Utilities: Electric service by Con Edison; Public sewer; Cable available; Electricity connected; Sewer connected; Public trash collection
- Home design: Stock cooperative; 4 total stories; Entry level on 3
- Construction: Brick construction
- Exterior features: Courtyard; Garden; Exterior lighting; Bicycle room; Outdoor space; Walk-up building; Front yard; Level lot; Near public transit; Near shops
Interior
- Kitchen: Dishwasher; Gas oven; Microwave; Refrigerator; Stainless steel appliances
- Bedrooms: Entry level: 3
- Flooring: Hardwood
- Bathrooms: 1 full bathroom
- Heating & cooling: Steam heating; No central cooling
- Interior features: Eat-in kitchen; High ceilings; His-and-hers closets; Walk-through kitchen; Drapes; Common area basement access
- Laundry & utility: Laundry in common area
Neighborhood map
What this means for you Summary
Snapshot
- This is a 2-bed/1.0-bath condo listed at $220k.
Deal economics
- At list price, monthly cash flow is $708 ($8k/yr) — positive.
- The deal already cash-flows at list — no discount required.
- Meets the 1% rule at list price ($3k rent vs $220k).
- Recommended offer: $217k (1.5% below list) — sets the bar for market timing.
Location & tenants
- Location reads 71/100 on livability (#397 in NY) — a middle-class / working-renter tenant base. Strengths: commute A+, health & safety A, employment B; Watch: crime D-, cost of living F.
- Mount Vernon School District (suburban): math 35% / reading 50% proficiency, ranked #485 of 590 in NY (top 82%) — families likely to look elsewhere, expect single-tenant / working-renter base with shorter leases; 62% free/reduced lunch — lower-income household profile, screen leases tightly.
- Zoned schools: Pennington School (math 42% / reading 62%, grade C-, #988 of 2,108 statewide, top 49%, 426 students, 45% FRL); Mount Vernon High School (math 54% / reading 75%, grade B-, #776 of 1,100 statewide, top 73%, 1,094 students, 76% FRL) — zoned schools at 60% FRL track the district average.
- Zoned-school proficiency averages 58% at this address vs 42% district-wide (+16 pts) — the actual schools serving this property are materially stronger than the Mount Vernon School District average implies; a family-tenant draw the district grade alone would hide.
- Market conditions: Rents rising fast (+7.0%/yr); 125 active listings in the ZIP; 37 comparable units currently listed for rent nearby; rentals at typical pace (median 24d on market — plan ~3-4 weeks tenant-placement turnaround); solid renter incomes; 954 units permitted in Westchester County in 2024 (649 in 5+ unit buildings).
Forward outlook
- Local home prices are declining (-3.0%/yr); year-one equity from $2k of loan paydown is wiped out by about $7k of value loss. Plan a longer hold.
- Westchester County population projected at +10% by 2050 — modest demand growth; plan on rents tracking national, not racing it.
- At projected returns (-3.0% appreciation + 7.0% rent growth), your $62k cash investment doubles in ~7 years — after that, you're playing with house money.
Negotiation context
- It's been on market 20 days — a 2% lower offer ($217k) is reasonable based on typical stale-listing flexibility.
- 2 sale attempts since 19y ago with the ask held roughly flat each time — persistent listings suggest the price (not the market) is what's stuck; bring a comps-based counter.
- Current owner paid $183k; 20% above their basis — modest negotiation headroom, anchor on the comps not their cost.
Risks & watch-outs
- Watch-outs: built in 1941 — expect roof / HVAC / electrical / plumbing capex.
- Climate carrying-cost: major wind risk, 27% chance of damaging wind over 30y; extreme-heat days projected 7→15/yr by 2055 (HVAC capex compounding) — expect insurance premiums to compound above CPI over the hold.
Questions for the listing agent
- Built in 1941 — when were the roof, HVAC, electrical panel, plumbing, and water heater last replaced?
- Any open or pending special assessments — roof, HVAC, plumbing, elevator, façade? What's the per-unit balance and payoff schedule, and is the seller paying it off at close or rolling it to the buyer?
- Is there a deadline driving the sale (1031 exchange, divorce, estate, relocation)? That informs how much negotiation room exists.
- Crime grade is D in this area — have there been break-ins, vandalism, or insurance claims at this property in the last 3 years? What carrier currently insures it and at what premium?
- What's the average days-on-market for RENTAL listings here right now (not sales)? A rising rental-DOM trend means longer vacancies and softer asking-rent achievability than the comps imply.
- What's the recent tenant-quality profile in this submarket — average credit score on applications, eviction rate, late-payment / NSF rate, and stable-employment percentage? A property-management company in the area should have these aggregated.
- How much new apartment / multifamily construction is in the pipeline within 1–3 miles? Heavy new supply (>2% of stock underway) typically softens rents 12–24 months out; light construction supports rent growth.
Investment metrics
- 1% rule
- 1.28% ✓
- Cap rate
- 10.15%
- Cash-on-cash
- 13.79%
- DSCR
- 1.61
- GRM
- 6.5
CMA / ARV
No comps found within radius.
Projected returns pro-forma
-3.0% appreciation · 7.04% rent growth · sell at horizon
- IRR
- 8.5%
- Equity multiple
- 1.35×
- Total profit
- $21,410
- Equity at exit
- $32,803
- IRR
- 20.9%
- Equity multiple
- 3.11×
- Total profit
- $130,086
- Equity at exit
- $19,022
Cash invested: $61,600 (down + closing). Projections, not guarantees.
Landlord ↔ Tenant lean methodology
- Overall (STATE)
- 15 Strongly Tenant-Friendly
- State New York
- 15 Strongly Tenant-Friendly · D+10
- County
- — inherits STATE
- City
- — inherits STATE
ZIP-level market 10552
- Rents YoY
- 7.0%
- Active inventory
- 125
- Price-to-rent
- 6.5×
Monthly cashflow live
- Estimated rent
- $2,821 high interval (Pro) →
- Mortgage (P&I)
- −$1,154
- Tax est. 1.5%
- −$275 /mo · $3,300/yr
- Insurance
- −$92
- HOA
- −$0
- Vacancy / Maint / Mgmt
- −$592
- Net cashflow
- $708
Break-even live
UW: 25.0% down · 7.5% · 30yr · 1.5% tax · 5.0% vac · 8.0% maint · 8.0% mgmt
Financing live
Cash to close
- Down payment
- $55,000
- Closing costs
- $6,600
- Reserves months
- —
- Total cash needed
- —
Loan-product check · same deal, 3 products live
Conventional
25% down · 7.5% · 30yr
- Down + closing
- —
- Monthly P&I
- —
- Monthly cashflow
- —
- DSCR
- —
- Eligible?
- —
Personal DTI + credit; lowest rate.
DSCR
20% down · 8.5% · 30yr
- Down + closing
- —
- Monthly P&I
- —
- Monthly cashflow
- —
- DSCR
- —
- Eligible?
- —
No personal income docs; deal must DSCR.
Hard money
10% down · 12.0% · 12mo
- Down + closing
- —
- Monthly P&I
- —
- Monthly cashflow
- —
- DSCR
- —
- Eligible?
- —
Short-term bridge; refi at stabilization.
Rent comps 37 comps
| Address | Beds | Baths | Sqft | Rent | $/sqft | DOM | Units | Dist |
|---|---|---|---|---|---|---|---|---|
| 33 William St Mount Vernon, NY | 1.0–2.0 | 1.0 | 725 | $2,675 | $3.69 | 22d | 2 | 0.15mi |
| 669 N Terrace Ave Mount Vernon, NY | 1.0 | 1.0 | 750 | $2,031 | $2.71 | 24d | 1 | 0.25mi |
| 42 Broad St W Mount Vernon, NY | 3.0 | 1.0–2.0 | 1014 | $5,080 | $5.01 | 24d | 15 | 0.29mi |
| 42 Broad St W Mount Vernon, NY | 3.0 | 1.0–2.0 | 955 | $3,199 | $3.35 | 2d | 16 | 0.29mi |
| 645 N MacQuesten Pkwy Unit 3G Mt Vernon, NY | 2.0 | 1.0 | 950 | $3,195 | $3.36 | 24d | 1 | 0.32mi |
| 80 W Grand St Mount Vernon, NY | 1.0 | 1.0 | 850 | $1,942 | $2.28 | 24d | 1 | 0.34mi |
| 173 Crary Ave Mount Vernon, NY | 3.0 | 2.0 | 1100 | $3,100 | $2.82 | 24d | 1 | 0.34mi |
| 12 Putnam St Mount Vernon, NY | 2.0 | 1.0 | 950 | $2,600 | $2.74 | 24d | 1 | 0.37mi |
| 230 N 7th Ave Unit 2 Mt Vernon, NY | 1.0 | 1.0 | 950 | $2,300 | $2.42 | 10d | 1 | 0.42mi |
| 103 North St Mount Vernon, NY | 1.0 | 1.0 | 720 | $1,900 | $2.64 | 20d | 1 | 0.49mi |
| 26 W Devonia Ave Unit 1 Mt Vernon, NY | 3.0 | 1.5 | 1388 | $4,200 | $3.03 | 11d | 1 | 0.52mi |
| 148 Claremont Ave Mount Vernon, NY | 2.0 | 1.0 | 960 | $2,400 | $2.50 | 19d | 1 | 0.58mi |
| 671 Bronx River Rd Unit 3A Yonkers, NY | 2.0 | 1.5 | 950 | $3,000 | $3.16 | 24d | 1 | 0.59mi |
| 200 Crescent Pl Unit 2nd fl Yonkers, NY | 1.0 | 1.0 | 800 | $2,300 | $2.88 | 17d | 1 | 0.61mi |
| 14 Elm St Unit 2 Mt Vernon, NY | 2.0 | 1.0 | 1000 | $2,800 | $2.80 | 24d | 1 | 0.65mi |
| 112 N Columbus Ave Unit 2 Mt Vernon, NY | 2.0 | 2.0 | 900 | $2,997 | $3.33 | 19d | 1 | 0.79mi |
| 32 N Bond St Mount Vernon, NY | 1.0 | 1.0 | 850 | $1,900 | $2.24 | 7d | 1 | 0.81mi |
| 18 N Bond St Unit 3D Mt Vernon, NY | 1.0 | 1.0 | 750 | $2,000 | $2.67 | 24d | 1 | 0.85mi |
| 173 Washington St Unit 1 Mt Vernon, NY | 3.0 | 2.0 | 1100 | $3,000 | $2.73 | 24d | 1 | 0.85mi |
| 173 Washington St Unit 2 Mt Vernon, NY | 3.0 | 2.0 | 1500 | $3,200 | $2.13 | 1d | 1 | 0.85mi |
| 86 Edgewood Ave Apt 2E Yonkers, NY | 2.0 | 1.0 | 1000 | $2,599 | $2.60 | 19d | 1 | 0.88mi |
| 86 Edgewood Ave Unit 2W Yonkers, NY | 2.0 | 1.0 | 1000 | $2,699 | $2.70 | 43d | 1 | 0.88mi |
| 20 Overhill Pl Unit 3 Yonkers, NY | 2.0 | 1.0 | 800 | $3,000 | $3.75 | 43d | 1 | 1.04mi |
| 150 S 6th Ave Unit 2 Mt Vernon, NY | 1.0 | 1.0 | 800 | $2,500 | $3.12 | 17d | 1 | 1.04mi |
| 150 S 6th Ave Unit 2 Mt Vernon, NY | 1.0 | 1.0 | 800 | $2,500 | $3.12 | 7d | 1 | 1.04mi |
| 495 Kimball Ave Unit First Floor Yonkers, NY | 2.0 | 1.0 | 1100 | $3,000 | $2.73 | 43d | 1 | 1.06mi |
| 119 S 11th Ave Unit 1 Mt Vernon, NY | 2.0 | 1.0 | 700 | $2,800 | $4.00 | 11d | 1 | 1.08mi |
| 51 Parkway Rd Apt 3 Bronxville, NY | 1.0 | 1.0 | 1100 | $3,100 | $2.82 | 24d | 1 | 1.12mi |
| 6 Belden Ave Unit 1 Yonkers, NY | 3.0 | 2.0 | 1450 | $3,500 | $2.41 | 24d | 1 | 1.13mi |
| 119 S 13th Ave Mount Vernon, NY | 2.0 | 1.0 | 800 | $2,997 | $3.75 | 13d | 1 | 1.15mi |
| 2325 Cortlandt St Unit 4 Mt Vernon, NY | 2.0 | 1.0 | 700 | $2,300 | $3.29 | 24d | 1 | 1.15mi |
| 635 E Lincoln Ave Mount Vernon, NY | 2.0 | 1.0 | 1000 | $3,150 | $3.15 | 7d | 1 | 1.16mi |
| 257 S 2nd Ave Mount Vernon, NY | 1.0 | 1.0 | 800 | $2,250 | $2.81 | 24d | 1 | 1.17mi |
| 28 Tunis Ave Unit 2 Yonkers, NY | 2.0 | 1.0 | 900 | $3,000 | $3.33 | 43d | 1 | 1.20mi |
| 142 Trenchard St Unit 2E Yonkers, NY | 1.0 | 1.0 | 900 | $2,250 | $2.50 | 11d | 1 | 1.24mi |
| 255 Bronx River Rd Unit 4R Yonkers, NY | 1.0 | 1.0 | 800 | $2,250 | $2.81 | 24d | 1 | 1.34mi |
| 356 S Tenth Ave Unit 2nd Floor Mt Vernon, NY | 3.0 | 2.0 | 1100 | $3,850 | $3.50 | 24d | 1 | 1.46mi |
HOA detail condo
- Monthly dues
- $0 · $0/yr
- Likely covers
- parking
- Assessments
- None detected in remarks — confirm with the listing agent.
Listing history 13 events
-
2026-06-18days on market $220,000 Active 20 DOM
-
2026-06-17days on market $220,000 Active 19 DOM
-
2026-06-16days on market $220,000 Active 18 DOM
-
2026-06-15days on market $220,000 Active 17 DOM
-
2026-06-13days on market $220,000 Active 15 DOM
-
2026-06-09days on market $220,000 Active 11 DOM
-
2026-06-08days on market $220,000 Active 10 DOM
-
2026-06-07days on market $220,000 Active 9 DOM
-
2026-06-04days on market $220,000 Active 6 DOM
-
2026-06-03days on market $220,000 Active 5 DOM
-
2026-06-02days on market $220,000 Active 4 DOM
-
2026-06-01days on market $220,000 Active 3 DOM
-
2026-05-31days on market $220,000 Active 2 DOM
ⓘ Source: listings_history table (triggers on properties + properties_extension) + one-shot
backfill from property_details.listing_events for pre-trigger history.
Climate risk First Street
- Flood 1/10 Low FEMA zone X (unshaded) · 0% chance over 30 yrs
- Wildfire 1/10 Low
- Heat 6/10 Major 7 d/yr ≥98°F today · 15 d/yr by 30 yrs out
- Wind 6/10 Major 27% chance of damaging wind over 30 yrs
- Air quality 5/10 Major 6 unhealthy d/yr today · 8 by 30 yrs out
Nearby sold comps map
Loading sold comps map…
Walkable amenities ~0.75 mi
Loading nearby amenities…
Taxation est. · year 1
- Rental income
- $33,847
- − Mortgage interest
- −$12,323
- − Property taxes
- −$3,300
- − Insurance
- −$1,100
- − Repairs & maintenance
- −$2,708
- − Management
- −$2,708
- − Depreciation
- −$6,400
- Taxable income
- $5,308
- Est. tax owed @ 24.0%
- −$1,274
- After-tax cash flow
- $7,221/yr
For passive investors: Depreciation is non-cash, so a rental often shows a tax loss while cash-flowing — sheltering income. Rental losses are passive: they offset passive income freely, and up to $25,000/yr can offset ordinary (W-2) income if you actively participate and your MAGI is under $100k (phasing out to $0 by $150k); unused losses carry forward. On sale, claimed depreciation is recaptured at up to 25%, and gains may owe capital-gains tax (a 1031 exchange can defer both). Figures are a year-1 estimate at your 24.0% rate — not tax advice; consult a CPA.
Schools (NCES district)
- District
- Mount Vernon School District
- NCES district ID
- 3620100
- Math proficiency
- 35% ▼ -3.00%
- Reading proficiency
- 50% ▲ 6.00%
- Median HH income
- $50,890
- Composite
- 36.59/100
- National rank
- #4631
- State rank
- #485 of 590 in NY
Livability — Mount Vernon
- Score
- 71/100
- State rank
- #397
- US rank
- #6876
Category grades
Schools grade is shown separately in the Schools card above.
Census & demographics
- Census place
- Mount Vernon, NY
- County
- Westchester County · 709,332 people
- City population
- 61,313
- Metro
- New York-Newark-Jersey City, NY-NJ-PA
- Population (ZIP)
- 22,341
- Household income
- $96,717
- Rent vs Own
- Severe rent burden
- 652.0
Population outlook (Westchester County) Hauer SSP2
- Today (2025)
- 1,028,035 people
- By 2030
- 1,051,636 · +2.3%
- By 2040
- 1,098,520 · +6.9%
- By 2050
- 1,136,044 · +10.5%
- By 2075
- 1,196,925 · +16.4%
- By 2100
- 1,175,147 · +14.3%
Race, ethnicity, and origin ACS 2023
- Neighborhood character
- Highly diverse neighborhood (Simpson 0.72)
- Race & ethnicity
- Black 39% White 31% Hispanic / Latino 17% Two or more races 7% Asian 5%
- Hispanic origin (detail)
- Puerto Rican 5% Dominican 6%
- Common ancestry
- Russian 2% Estonian 2% Hispanic 1%
- Foreign-born
- 27% · Canada, China
- Languages at home
- 74% English-only · Spanish 12% Other Indo-European 7% French/Haitian/Cajun 2%
Political lean MEDSL · Westchester
- 2024 margin
- Strong D (+26.3) · D 63.1% · R 36.9%
- 2008→2024 swing
- -1.3pp toward R · 2008: 27.6pp · 2024: 26.3pp
- All cycles
- 2024: D+26.3 2020: D+36.3 2016: D+32.8 2012: D+22.2 2008: D+27.6
Not yet ingested
- Civics
- —
Market trends
- HPI YoY
- ▼ -393.94%
- Current HPI
- 244.3166
- Rent YoY
- ▲ 7.04%
- Metro
- New York-Newark-Jersey City, NY-NJ-PA
- State GDP YoY
- ▲ 2.60%
- F500 in state
- 92
Industry mix (Fortune 500 HQ in NY)
| Industry | F500 HQs | Revenue |
|---|---|---|
| Financial Services | 10 | $950B |
|
||
| Consumer Goods | 9 | $162B |
|
||
| Insurance | 4 | $225B |
|
||
| Telecommunications | 2 | $144B |
|
||
| Pharmaceuticals | 2 | $112B |
|
||
| Media / Entertainment | 2 | $69B |
|
||
Price history
+17.6% since first listed6 events — show timeline
- 2026-05-29 Listed $220,000 OneKey® MLS as Distributed by MLS Grid
- 2014-03-15 Price Changed $183,000 HGMLS
- 2007-12-18 Delisted — HGMLS
- 2007-12-11 Sold (MLS) $183,000 HGMLS
- 2007-09-27 Price Changed $187,000 HGMLS
- 2007-08-01 Listed $187,000 HGMLS
Cash-flow waterfall
monthlySold comps — $/sqft
last 12 mo · ≤1 miLoading sold comps…