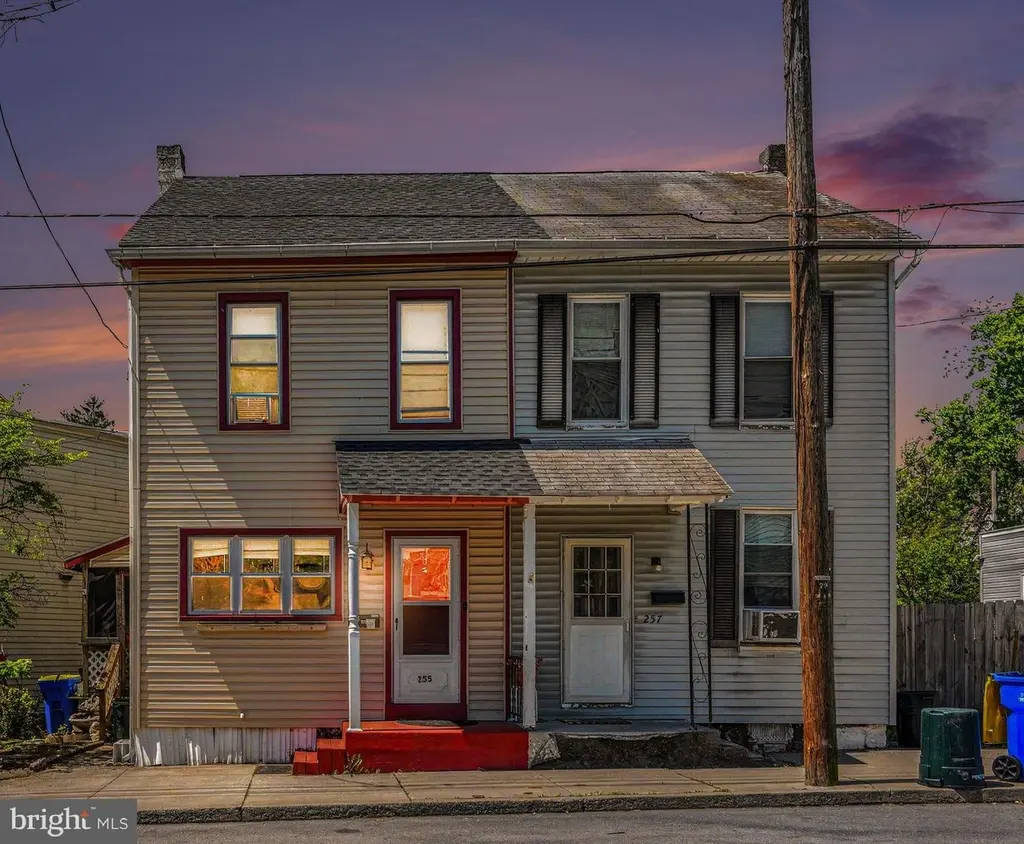
255 N Pine St · Middletown, PA
Flood risk 6/10 · Moderate
- FEMA flood zone
- X (unshaded)
- Chance of flooding over 30 yrs
- 0.7%
- Est. flood insurance / yr
- $473 – $860
Fire risk 1/10 · Minimal
- Est. fire insurance / yr
- $511 – $949
Heat risk 6/10 · Moderate
- Hot days now (above 101°F)
- 7 days/yr
- Hot days in 30 yrs
- 16 days/yr
Wind risk 3/10 · Minor
- Chance of severe wind over 30 yrs
- 7.0%
Air-quality risk 3/10 · Minor
- Unhealthy air days now
- 2 days/yr
- Unhealthy air days in 30 yrs
- 4 days/yr
Risk factors via First Street. Map © Google.
Why this score? — see what drove the D- grade
The composite is a weighted blend of 9 inputs, each scored 0–100. Each bar is that input's sub-score; the figure is the points it added to the 100-point composite (weight × sub-score).
- Cash flow +11.8/30.0
- ARV discount +8.5/15.0
- Livability +4.0/5.0
- DSCR +3.5/10.0
- 1% rule +3.3/10.0
- Schools +3.3/10.0
- Rent growth +2.9/5.0
- Condition / age +2.5/5.0
- Appreciation +0.0/10.0
$169,900
🖨 Deal sheet 📄 Offer letter ✓ Due diligence
Listing remarks
Welcome home to this well-maintained 3/4 bedroom, 1.5 bath property featuring a remodeled kitchen, new flooring throughout the first and second floors, and a brand new roof installed in 2025. Enjoy low-maintenance, carefree living in a highly desirable location close to shopping, restaurants, schools, and major routes. Flexible layout offers the potential for a fourth bedroom, home office, or additional living space. Move-in ready with modern updates throughout! * * * OFFER RECEIVED DEADLINE 8:30 PM MAY 11 * * (
Key facts
- Built 1993
- Listed 5 days
Property features AI
Exterior
- Parking: On-street parking
- Utilities: Public water; Public sewer; Natural gas service
- Home design: Semi-detached property; Fee simple ownership
- Construction: Frame construction; Block foundation; Built year per assessor
- Exterior features: Not in a federal flood zone; Above-grade and below-grade structures
Interior
- Bedrooms: Two bedrooms on the first upper level; One bedroom on the second upper level
- Bathrooms: One full bathroom (upper levels); One half bathroom (main level)
- Heating & cooling: Forced air heating; Natural gas hot water
- Interior features: Two or more exterior access exits; Basement with dirt floor
Neighborhood map
What this means for you Summary
Snapshot
- This is a 3-bed/1.0-bath townhouse listed at $170k.
Deal economics
- At list price, monthly cash flow is $-46 ($-553/yr) — negative.
- To cash-flow at today's rent, offer at most $162k (4.8% below list).
- To meet the 1% rule (rent ≥ 1% of price), the offer needs to be $141k (17.2% below list).
- Recommended offer: $141k (17.2% below list) — sets the bar for 1% rule.
- Cap rate 6.0% vs local median 3.1% in Middletown — top-decile yield for the area; either an underpriced asset or a hidden risk that comps aren't pricing in. Stress-test before assuming the spread holds.
Location & tenants
- Location reads 80/100 on livability (#214 in PA, #1,886 nationally) — a professional / high-income tenant draw. Strengths: cost of living A+, housing A+, health & safety A+; Watch: amenities F.
- Middletown Area SD (suburban): math 31% / reading 45% proficiency, ranked #368 of 539 in PA (top 68%) — families likely to look elsewhere, expect single-tenant / working-renter base with shorter leases.
- Zoned schools: Middletown Area Hs (math 72% / reading 10%, grade F, #251 of 437 statewide, top 58%, 747 students, 51% FRL).
- Market conditions: Rents rising (+1.6%/yr); 146 active listings in the ZIP; 10 comparable units currently listed for rent nearby; rentals at typical pace (median 14d on market — plan ~3-4 weeks tenant-placement turnaround); 540 units permitted in Dauphin County in 2024 (194 in 5+ unit buildings).
Forward outlook
- Local home prices are declining (-3.0%/yr); year-one equity from $1k of loan paydown is wiped out by about $5k of value loss. Plan a longer hold.
Negotiation context
- Only 5 days on market — expect competitive offers; lowballing is unlikely to land.
Risks & watch-outs
- Climate carrying-cost: major flood risk; extreme-heat days projected 7→16/yr by 2055 (HVAC capex compounding) — expect insurance premiums to compound above CPI over the hold.
Questions for the listing agent
- What do current leases actually rent for vs. the listed asking? Can we see a recent rent roll and the last 12 months of T-12 income?
- Is there a deadline driving the sale (1031 exchange, divorce, estate, relocation)? That informs how much negotiation room exists.
- The area grade is low — what's the realistic commute time and amenity access for the typical tenant pool here? Any planned neighborhood developments (good or bad) we should know about?
- What's the average days-on-market for RENTAL listings here right now (not sales)? A rising rental-DOM trend means longer vacancies and softer asking-rent achievability than the comps imply.
- What's the recent tenant-quality profile in this submarket — average credit score on applications, eviction rate, late-payment / NSF rate, and stable-employment percentage? A property-management company in the area should have these aggregated.
- How much new for-sale + rental construction is in the pipeline within 1–3 miles? Heavy new supply typically softens prices + rents 12–24 months out; constrained supply supports both.
Investment metrics
- 1% rule
- 0.83% ✗
- Cap rate
- 5.97%
- Cash-on-cash
- -1.16%
- DSCR
- 0.95
- GRM
- 10.1
CMA / ARV
- ARV (median comp)
- $173,653
- List price
- $169,900
- Delta
- -2.16%
- Verdict
- FAIR
- Comps
- 20 within 1.0 mi
Show comp detail 12 sales within ~0.75 mi
| Address | Dist | Beds/Ba | Sqft | Sold | Price | $/sf | Match |
|---|---|---|---|---|---|---|---|
| 54 Nissley St | 0.24mi | 3/1.0 | 1,246 (0%) | 1mo | $177,000 | $142 | 88 |
| 21 Girard Ave | 0.11mi | 3/1.5 | 1,280 (+3%) | 11mo | $140,000 | $109 | 79 |
| 348 Oak Hill Dr | 0.43mi | 3/1.0 | 1,260 (+1%) | 6mo | $212,000 | $168 | 73 |
| 255 N Spring St | 0.18mi | 2/2.0 (-1) | 1,282 (+3%) | 6mo | $190,000 | $148 | 73 |
| 501 Vine St | 0.38mi | 3/2.0 | 1,304 (+5%) | 1mo | $221,000 | $169 | 70 |
| 3 S Pine St | 0.27mi | 3/1.5 | 1,328 (+7%) | 10mo | $170,000 | $128 | 66 |
| 234 E Emaus St | 0.31mi | 3/1.0 | 1,386 (+11%) | 2mo | $90,000 | $65 | 65 |
| 325 Oak Hill Dr | 0.48mi | 3/1.0 | 1,156 (-7%) | 7mo | $225,000 | $195 | 60 |
| 328 Vine St | 0.30mi | 2/1.5 (-1) | 1,178 (-6%) | 12mo | $186,200 | $158 | 60 |
| 327 Oak Hill Dr | 0.47mi | 3/1.0 | 1,120 (-10%) | 6mo | $224,900 | $201 | 56 |
| 210 Adelia St | 0.40mi | 2/2.0 (-1) | 1,128 (-10%) | 4mo | $205,000 | $182 | 53 |
| 157 Ann St | 0.47mi | 2/1.5 (-1) | 1,152 (-8%) | 8mo | $151,049 | $131 | 52 |
Match score weights: distance 35% · size 25% · config 20% · recency 20%. Top-matched comps best support the ARV.
Projected returns pro-forma
-3.0% appreciation · 1.58% rent growth · sell at horizon
- IRR
- -19.8%
- Equity multiple
- 0.32×
- Total profit
- $-32,437
- Equity at exit
- $25,333
- IRR
- -15.9%
- Equity multiple
- 0.16×
- Total profit
- $-39,884
- Equity at exit
- $14,690
Cash invested: $47,572 (down + closing). Projections, not guarantees.
Landlord ↔ Tenant lean methodology
- Overall (STATE)
- 62 Landlord-Friendly
- State Pennsylvania
- 62 Landlord-Friendly · EVEN
- County
- — inherits STATE
- City
- — inherits STATE
ZIP-level market 17057
- Home prices YoY
- -23.9%
- Rents YoY
- 1.6%
- Active inventory
- 146
- Price-to-rent
- 10.1×
Monthly cashflow live
- Estimated rent
- $1,407 high interval (Pro) →
- Mortgage (P&I)
- −$891
- Tax from tax record
- −$196 /mo · $2,351/yr
- Insurance
- −$71
- HOA
- −$0
- Vacancy / Maint / Mgmt
- −$295
- Net cashflow
- $-46
Break-even live
UW: 25.0% down · 7.5% · 30yr · 1.5% tax · 5.0% vac · 8.0% maint · 8.0% mgmt
Financing live
Cash to close
- Down payment
- $42,475
- Closing costs
- $5,097
- Reserves months
- —
- Total cash needed
- —
Loan-product check · same deal, 3 products live
Conventional
25% down · 7.5% · 30yr
- Down + closing
- —
- Monthly P&I
- —
- Monthly cashflow
- —
- DSCR
- —
- Eligible?
- —
Personal DTI + credit; lowest rate.
DSCR
20% down · 8.5% · 30yr
- Down + closing
- —
- Monthly P&I
- —
- Monthly cashflow
- —
- DSCR
- —
- Eligible?
- —
No personal income docs; deal must DSCR.
Hard money
10% down · 12.0% · 12mo
- Down + closing
- —
- Monthly P&I
- —
- Monthly cashflow
- —
- DSCR
- —
- Eligible?
- —
Short-term bridge; refi at stabilization.
Rent comps 10 comps
| Address | Beds | Baths | Sqft | Rent | $/sqft | DOM | Units | Dist |
|---|---|---|---|---|---|---|---|---|
| 43 E Main St Apt 4 Middletown, PA | 2.0 | 1.0 | 1000 | $1,195 | $1.20 | 44d | 1 | 0.18mi |
| 112 Nissley St Unit 2 Middletown, PA | 2.0 | 2.0 | 1266 | $1,350 | $1.07 | 23d | 1 | 0.25mi |
| 213 S Union St Apt 1 Middletown, PA | 2.0 | 1.0 | 780 | $1,400 | $1.79 | 14d | 1 | 0.39mi |
| 219 S Union St Fl REAR Middletown, PA | 2.0 | 1.0 | 700 | $900 | $1.29 | 14d | 1 | 0.40mi |
| 219 S Union St Unit 2nd Floor Middletown, PA | 2.0 | 1.0 | 700 | $1,250 | $1.79 | 43d | 1 | 0.40mi |
| 144 Wilson St Middletown, PA | 3.0 | 1.0 | 1120 | $1,495 | $1.33 | 23d | 1 | 0.41mi |
| 167 Ann St Unit 4 Middletown, PA | 2.0 | 1.0 | 800 | $1,300 | $1.62 | 14d | 1 | 0.44mi |
| 1900 Pineford Dr Middletown, PA | 1.0–3.0 | 1.0–2.5 | 1020 | $1,690 | $1.66 | 13d | 1 | 0.58mi |
| 415 Aspen St Unit 1 Middletown, PA | 2.0 | 1.0 | 864 | $1,495 | $1.73 | 14d | 1 | 0.83mi |
| 105 Woodland Ave Middletown, PA | 1.0–2.0 | 1.0–2.0 | 996 | $1,714 | $1.72 | 14d | 9 | 1.00mi |
Listing history 3 events
-
2026-05-12status Pending 521-char remark
-
2026-05-08$169,900 Active 521-char remark
-
2026-05-06historical $169,900 521-char remark
ⓘ Source: listings_history table (triggers on properties + properties_extension) + one-shot
backfill from property_details.listing_events for pre-trigger history.
Tax reassessment forecast PA · Partial reset (capped growth)
- Current annual tax
- $2,351 · $196/mo
- Projected year-2 tax
- $2,518 · $210/mo
- Expected delta
- +$167/yr (+$14/mo · 7.1%)
ⓘ Screening estimate from a state-policy table — verify with the county assessor before closing.
Climate risk First Street
- Flood 6/10 Major FEMA zone X (unshaded) · 70% chance over 30 yrs
- Wildfire 1/10 Low
- Heat 6/10 Major 7 d/yr ≥101°F today · 16 d/yr by 30 yrs out
- Wind 3/10 Moderate 7% chance of damaging wind over 30 yrs
- Air quality 3/10 Moderate 2 unhealthy d/yr today · 4 by 30 yrs out
Nearby sold comps map
Loading sold comps map…
Walkable amenities ~0.75 mi
Loading nearby amenities…
Taxation est. · year 1
- Rental income
- $16,886
- − Mortgage interest
- −$9,517
- − Property taxes
- −$2,351
- − Insurance
- −$850
- − Repairs & maintenance
- −$1,351
- − Management
- −$1,351
- − Depreciation
- −$4,943
- Taxable loss
- −$3,476
- Est. tax savings @ 24.0%
- +$834
- After-tax cash flow
- $282/yr
For passive investors: Depreciation is non-cash, so a rental often shows a tax loss while cash-flowing — sheltering income. Rental losses are passive: they offset passive income freely, and up to $25,000/yr can offset ordinary (W-2) income if you actively participate and your MAGI is under $100k (phasing out to $0 by $150k); unused losses carry forward. On sale, claimed depreciation is recaptured at up to 25%, and gains may owe capital-gains tax (a 1031 exchange can defer both). Figures are a year-1 estimate at your 24.0% rate — not tax advice; consult a CPA.
Schools (NCES district)
- District
- Middletown Area SD
- NCES district ID
- 4215240
- Math proficiency
- 31% ▼ -9.00%
- Reading proficiency
- 45% ▼ -11.00%
- Median HH income
- $53,128
- Composite
- 33.08/100
- National rank
- #5567
- State rank
- #368 of 539 in PA
Livability — Middletown
- Score
- 80/100
- State rank
- #214
- US rank
- #1886
Category grades
Schools grade is shown separately in the Schools card above.
Census & demographics
- Census place
- Middletown, PA
- County
- Dauphin County · 247,857 people
- City population
- 23,560
- Metro
- Harrisburg-Carlisle, PA
- Population (ZIP)
- 23,560
- Household income
- $73,407
- Rent vs Own
- Severe rent burden
- 748.0
Population outlook (Dauphin County) Hauer SSP2
- Today (2025)
- 281,628 people
- By 2030
- 283,549 · +0.7%
- By 2040
- 285,385 · +1.3%
- By 2050
- 286,188 · +1.6%
- By 2075
- 291,053 · +3.3%
- By 2100
- 282,374 · +0.3%
Race, ethnicity, and origin ACS 2023
- Neighborhood character
- Predominantly White (76%)
- Race & ethnicity
- White 76% Hispanic / Latino 11% Two or more races 8% Black 6% Asian 2%
- Hispanic origin (detail)
- Mexican 1% Puerto Rican 7%
- Common ancestry
- Romanian 3% Italian 2% Serbian 2%
- Foreign-born
- 5% · Canada, China, South Korea
- Languages at home
- 92% English-only · Spanish 4% Other Indo-European 1%
Political lean MEDSL · Dauphin
- 2024 margin
- Lean D (+5.9) · D 52.4% · R 46.5% · Other 1.1%
- 2008→2024 swing
- -3.1pp toward R · 2008: 9.1pp · 2024: 5.9pp
- All cycles
- 2024: D+5.9 2020: D+8.5 2016: D+2.8 2012: D+6.0 2008: D+9.1
Not yet ingested
- Civics
- —
Market trends
- HPI YoY
- ▼ -83.17%
- Current HPI
- 265.6077
- Rent YoY
- ▲ 1.58%
- Metro
- Harrisburg-Carlisle, PA
- State GDP YoY
- ▲ 1.68%
- F500 in state
- 34
Industry mix (Fortune 500 HQ in PA)
| Industry | F500 HQs | Revenue |
|---|---|---|
| Healthcare | 2 | $309B |
|
||
| Insurance | 2 | $27B |
|
||
| Telecommunications / Media | 1 | $124B |
|
||
| Industrial Distribution | 1 | $22B |
|
||
| Financial Services | 1 | $20B |
|
||
| Chemicals / Materials | 1 | $18B |
|
||
Price history
+0.0% since first listed3 events — show timeline
- 2026-05-12 Pending — BRIGHT MLS
- 2026-05-08 Listed $169,900 BRIGHT MLS
- 2026-05-06 Coming Soon $169,900 BRIGHT MLS
Property tax history
+2.6%/yrLatest (2026): $2,351 · +4.0% YoY. Source: county tax records.
Cash-flow waterfall
monthlySold comps — $/sqft
last 12 mo · ≤1 miLoading sold comps…