7035 Festival Dr S Unit W-117 · Byron, MI
Flood risk No data
- FEMA flood zone
- —
- Chance of flooding over 30 yrs
- —
- Est. flood insurance / yr
- —
Fire risk No data
- Est. fire insurance / yr
- —
Heat risk No data
- Hot days now (above threshold)
- —
- Hot days in 30 yrs
- —
Wind risk No data
- Chance of severe wind over 30 yrs
- —
Air-quality risk No data
- Unhealthy air days now
- —
- Unhealthy air days in 30 yrs
- —
Risk factors via First Street. Map © Google.
Why this score? — see what drove the C- grade
The composite is a weighted blend of 9 inputs, each scored 0–100. Each bar is that input's sub-score; the figure is the points it added to the 100-point composite (weight × sub-score).
- Cash flow +15.0/30.0
- ARV discount +15.0/15.0
- Schools +6.2/10.0
- 1% rule +5.0/10.0
- DSCR +5.0/10.0
- Livability +3.3/5.0
- Rent growth +2.5/5.0
- Condition / age +2.2/5.0
- Appreciation +0.0/10.0
$37,600
🖨 Deal sheet (PDF) 📄 Offer letter ✓ Due diligence
Listing remarks
* THIS IS A RESALE LISTING * You'll love living in this 3 bedroom, 2 bathroom home within a wonderful family-friendly community. Check out the awesome amenities your community has to offer such as a basketball court, a clubhouse, a playground, and more! This home won't be on the market long, so call us today for more information or to schedule a tour. Deposits & Fees are subject to change.
Key facts
- Clubhouse
- Basketball court
- Playground
Tags
Property features AI
Finance
- Financial info: List price $37,100
Exterior
- Utilities: Natural gas available
- Home design: Condominium/unit (address: 7035 Festival Dr S Unit W-117, Grand Rapids, MI 49548)
- Exterior features: Living area 924
Interior
- Bedrooms: 3 bedrooms
- Bathrooms: 2 bathrooms
- Heating & cooling: Natural gas heating
- Interior features: Active listing (spec/plan 93410)
Neighborhood map
What this means for you Summary
Snapshot
- This is a 3-bed/2.0-bath manufactured listed at $38k. Condition is rated fair.
Deal economics
- At list price, monthly cash flow is $986 ($12k/yr) — positive.
- The deal already cash-flows at list — no discount required.
- Meets the 1% rule at list price ($2k rent vs $38k).
- Recommended offer: $36k (3.0% below list) — sets the bar for market timing.
- Cap rate 37.7% vs local median 1.7% in Byron — top-decile yield for the area; either an underpriced asset or a hidden risk that comps aren't pricing in. Stress-test before assuming the spread holds.
Location & tenants
- Location reads 66/100 on livability (#410 in MI) — a middle-class / working-renter tenant base. Strengths: cost of living A+, housing A+, employment B; Watch: crime D+, amenities F, commute F.
- Byron Center Public Schools (suburban): math 69% / reading 73% proficiency, ranked #15 of 540 in MI (top 3%) — strong family-tenant draw, lease renewals of 3-5y typical; only 20% free/reduced lunch — higher-income household profile.
- Market conditions: 110 active listings in the ZIP; 5 comparable units currently listed for rent nearby; rentals leasing fast (median 12d on market — plan ~1-2 weeks tenant-placement turnaround); 2,253 units permitted in Kent County in 2024 (969 in 5+ unit buildings).
- This rent runs 31% of the median local income ($62k/yr) — at the standard rent-burdened threshold; future hikes will face affordability resistance.
Forward outlook
- Local home prices are declining (-3.0%/yr); year-one equity from $260 of loan paydown is wiped out by about $1k of value loss. Plan a longer hold.
- Kent County population projected at +22% by 2050 — long-run rental-demand tailwind backs the buy-and-hold thesis.
- At projected returns (-3.0% appreciation + 3.0% rent growth), your $11k cash investment doubles in ~1 year — after that, you're playing with house money.
Negotiation context
- It's been on market 39 days — a 3% lower offer ($36k) is reasonable based on typical stale-listing flexibility.
Questions for the listing agent
- It's been on market 39 days. Have you received any prior offers? Is the seller open to a 3% concession, seller financing, or rate buy-down credit?
- Have any recent inspections been done? Can we get a copy of the seller's disclosures and any deferred-maintenance estimates?
- Is there a deadline driving the sale (1031 exchange, divorce, estate, relocation)? That informs how much negotiation room exists.
- Schools are B-rated — typically a magnet for longer-tenancy family renters. What's the average tenant stay here, and is there a school-zone premium baked into asking?
- Crime grade is D in this area — have there been break-ins, vandalism, or insurance claims at this property in the last 3 years? What carrier currently insures it and at what premium?
- What's the average days-on-market for RENTAL listings here right now (not sales)? A rising rental-DOM trend means longer vacancies and softer asking-rent achievability than the comps imply.
- What's the recent tenant-quality profile in this submarket — average credit score on applications, eviction rate, late-payment / NSF rate, and stable-employment percentage? A property-management company in the area should have these aggregated.
- How much new for-sale + rental construction is in the pipeline within 1–3 miles? Heavy new supply typically softens prices + rents 12–24 months out; constrained supply supports both.
Investment metrics
- 1% rule
- 4.19% ✓
- Cap rate
- 37.75%
- Cash-on-cash
- 112.33%
- DSCR
- 6.00
- GRM
- 2.0
CMA / ARV
- ARV (median comp)
- $48,461
- List price
- $37,600
- Delta
- -22.41%
- Verdict
- UNDERPRICED
- Comps
- 3 within 1.0 mi
Show comp detail 2 sales within ~0.75 mi
| Address | Dist | Beds/Ba | Sqft | Sold | Price | $/sf | Match |
|---|---|---|---|---|---|---|---|
| 7150 Friarway Ave SW | 0.25mi | 3/2.0 | 1,012 (+10%) | 6mo | $54,000 | $53 | 67 |
| 323 Scabbard St SW | 0.63mi | 3/2.0 | 988 (+7%) | 7mo | $50,000 | $51 | 53 |
Match score weights: distance 35% · size 25% · config 20% · recency 20%. Top-matched comps best support the ARV.
Projected returns pro-forma
-3.0% appreciation · 3.0% rent growth · sell at horizon
- IRR
- —
- Equity multiple
- 6.39×
- Total profit
- $56,699
- Equity at exit
- $5,606
- IRR
- —
- Equity multiple
- 13.38×
- Total profit
- $130,292
- Equity at exit
- $3,251
Cash invested: $10,528 (down + closing). Projections, not guarantees.
Landlord ↔ Tenant lean methodology
- Overall (STATE)
- 62 Landlord-Friendly
- State Michigan
- 62 Landlord-Friendly · EVEN
- County
- — inherits STATE
- City
- — inherits STATE
ZIP-level market 49548
- Active inventory
- 110
- Price-to-rent
- 2.0×
Monthly cashflow live
- Estimated rent
- $1,576 high interval (Pro) →
- Mortgage (P&I)
- −$197
- Tax est. 1.5%
- −$47 /mo · $564/yr
- Insurance
- −$16
- HOA
- −$0
- Vacancy / Maint / Mgmt
- −$331
- Net cashflow
- $986
Break-even live
Sensitivity live
| Price | -10% $1,011 | -5% $999 | +0% $986 | +5% $973 | +10% $960 |
|---|---|---|---|---|---|
| Rent | -10% $861 | -5% $923 | +0% $986 | +5% $1,048 | +10% $1,110 |
| Rate | -1.0pp $1,004 | -0.5pp $995 | base $986 | +0.5pp $976 | +1.0pp $966 |
UW: 25.0% down · 7.5% · 30yr · 1.5% tax · 5.0% vac · 8.0% maint · 8.0% mgmt
Financing live
Cash to close
- Down payment
- $9,400
- Closing costs
- $1,128
- Reserves months
- —
- Total cash needed
- —
Loan-product check · same deal, 3 products live
Conventional
25% down · 7.5% · 30yr
- Down + closing
- —
- Monthly P&I
- —
- Monthly cashflow
- —
- DSCR
- —
- Eligible?
- —
Personal DTI + credit; lowest rate.
DSCR
20% down · 8.5% · 30yr
- Down + closing
- —
- Monthly P&I
- —
- Monthly cashflow
- —
- DSCR
- —
- Eligible?
- —
No personal income docs; deal must DSCR.
Hard money
10% down · 12.0% · 12mo
- Down + closing
- —
- Monthly P&I
- —
- Monthly cashflow
- —
- DSCR
- —
- Eligible?
- —
Short-term bridge; refi at stabilization.
Rent comps 5 comps
| Address | Beds | Baths | Sqft | Rent | $/sqft | DOM | Units | Dist |
|---|---|---|---|---|---|---|---|---|
| 7283 Division Ave S Grand Rapids, MI | 3.0 | 2.0 | 1152 | $1,514 | $1.31 | 22d | 1 | 0.33mi |
| 6700 Creekstone Ln SW Grand Rapids, MI | 2.0 | 1.0 | 1000 | $1,285 | $1.28 | 4d | 1 | 0.41mi |
| 6500 Division Ave S Grand Rapids, MI | 2.0 | 1.0 | 784 | $1,399 | $1.78 | 11d | 1 | 0.83mi |
| 6471 Division Ave S Grand Rapids, MI | 2.0 | 1.0 | 728 | $1,399 | $1.92 | 11d | 1 | 0.87mi |
| 6263 Division Ave S Grand Rapids, MI | 2.0–3.0 | 2.0 | 1200 | $1,579 | $1.32 | 4d | 1 | 1.07mi |
Listing history 16 events
-
2026-06-21days on market $37,600 Active 39 DOM
-
2026-06-18days on market $37,600 Active 36 DOM
-
2026-06-17days on market $37,600 Active 35 DOM
-
2026-06-16days on market $37,600 Active 34 DOM
-
2026-06-15days on market $37,600 Active 33 DOM
-
2026-06-14days on market $37,600 Active 31 DOM
-
2026-06-10days on market $37,600 Active 28 DOM
-
2026-06-09days on market $37,600 Active 27 DOM
-
2026-06-08days on market $37,600 Active 26 DOM
-
2026-06-07days on market $37,600 Active 25 DOM
-
2026-06-05days on market $37,600 Active 22 DOM
-
2026-06-03days on market $37,600 Active 21 DOM
-
2026-06-03days on market $37,600 Active 20 DOM
-
2026-06-01pricedays on market $37,600 Active 19 DOM
-
2026-05-31days on market $37,100 Active 18 DOM
-
2026-05-13$37,100 Active 401-char remark
ⓘ Source: listings_history table (triggers on properties + properties_extension) + one-shot
backfill from property_details.listing_events for pre-trigger history.
Nearby sold comps map
Loading sold comps map…
Walkable amenities ~0.75 mi
Loading nearby amenities…
Taxation est. · year 1
- Rental income
- $18,917
- − Mortgage interest
- −$2,106
- − Property taxes
- −$564
- − Insurance
- −$188
- − Repairs & maintenance
- −$1,513
- − Management
- −$1,513
- − Depreciation
- −$1,094
- Taxable income
- $11,938
- Est. tax owed @ 24.0%
- −$2,865
- After-tax cash flow
- $8,961/yr
For passive investors: Depreciation is non-cash, so a rental often shows a tax loss while cash-flowing — sheltering income. Rental losses are passive: they offset passive income freely, and up to $25,000/yr can offset ordinary (W-2) income if you actively participate and your MAGI is under $100k (phasing out to $0 by $150k); unused losses carry forward. On sale, claimed depreciation is recaptured at up to 25%, and gains may owe capital-gains tax (a 1031 exchange can defer both). Figures are a year-1 estimate at your 24.0% rate — not tax advice; consult a CPA.
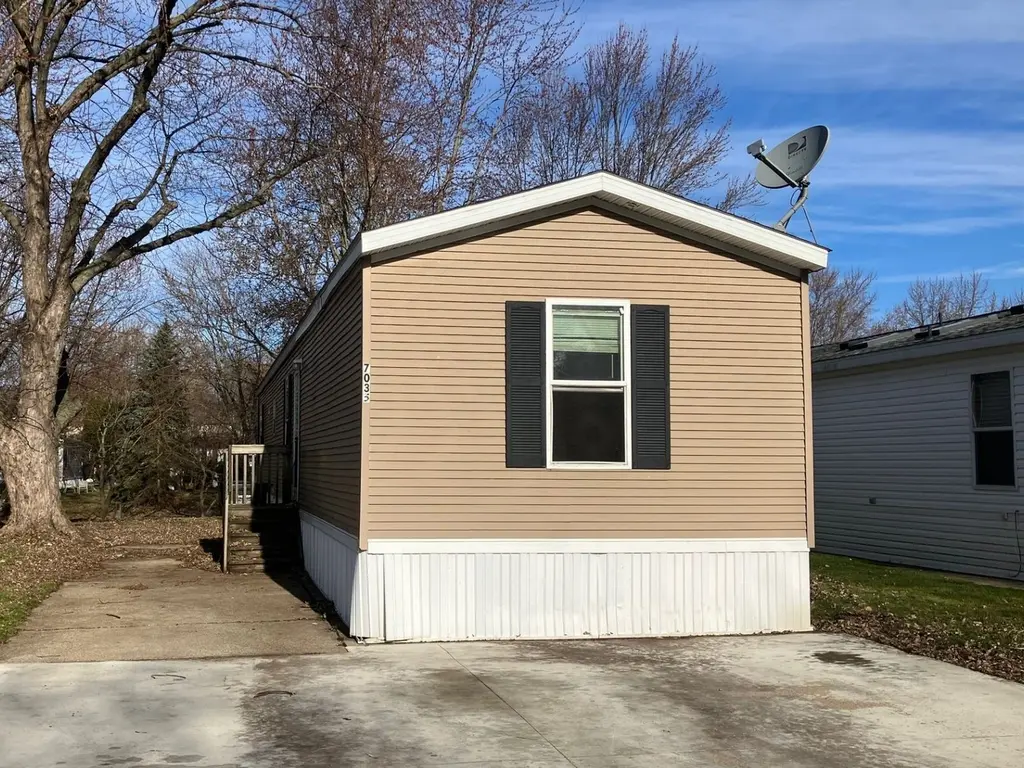
Condition & rehab AI · 1 photo
This manufactured home requires moderate repairs to the exterior siding and landscaping, but is otherwise in good condition. Painting and updating the exterior would significantly enhance its curb appeal and value.
Repairs flagged
- Major exterior siding — Significant weathering and discoloration
- Minor landscaping — Overgrown grass
Value-add opportunities
- Both paint exterior — Enhances curb appeal and resale value
- Both landscaping — Improves curb appeal and rental value
- Both update exterior siding — Significant improvement in appearance and value
Renovation cost estimate screening
| Repair item | Severity | Est. cost |
|---|---|---|
| exterior siding · Significant weathering and discoloration | Major | $15,000–50,000 |
| landscaping · Overgrown grass | Minor | $500–3,000 |
| Total estimated repair cost · 2 items | $15,500–53,000 |
Value-add ROI direction
- Both paint exterior — Enhances curb appeal and resale value ↑
- Both landscaping — Improves curb appeal and rental value ↑
- Both update exterior siding — Significant improvement in appearance and value ↑
ⓘ Cost ranges are severity-bucket heuristics (US national rule-of-thumb). Get contractor quotes + a written scope before underwriting a rehab budget.
Schools (NCES district)
- District
- Byron Center Public Schools
- NCES district ID
- 2607560
- Math proficiency
- 69% ▼ -2.00%
- Reading proficiency
- 73% ▼ -4.00%
- Median HH income
- $63,763
- Composite
- 61.5/100
- National rank
- #753
- State rank
- #15 of 540 in MI
Livability — Byron
- Score
- 66/100
- State rank
- #410
- US rank
- #11251
Category grades
Schools grade is shown separately in the Schools card above.
Census & demographics
- Census place
- Cutlerville, MI
- County
- Kent County · 533,805 people
- Metro
- Grand Rapids-Kentwood, MI
- Population (ZIP)
- 34,777
- Household income
- $61,636
- Rent vs Own
- Severe rent burden
- 781.0
Population outlook (Kent County) Hauer SSP2
- Today (2025)
- 712,484 people
- By 2030
- 748,618 · +5.1%
- By 2040
- 814,777 · +14.4%
- By 2050
- 868,556 · +21.9%
- By 2075
- 966,487 · +35.7%
- By 2100
- 967,975 · +35.9%
Race, ethnicity, and origin ACS 2023
- Neighborhood character
- Diverse neighborhood (Simpson 0.68)
- Race & ethnicity
- White 49% Hispanic / Latino 22% Two or more races 16% Black 15% Asian 6% Native American 1%
- Hispanic origin (detail)
- Mexican 15% Puerto Rican 4%
- Common ancestry
- Iranian 10% Romanian 4% Lithuanian 2%
- Foreign-born
- 13% · Canada, Vietnam, China
- Languages at home
- 78% English-only · Spanish 14% Vietnamese 2% French/Haitian/Cajun 1%
Political lean MEDSL · Kent
- 2024 margin
- Lean D (+5.4) · D 51.8% · R 46.5% · Other 1.7%
- 2008→2024 swing
- +4.8pp toward D · 2008: 0.5pp · 2024: 5.4pp
- All cycles
- 2024: D+5.4 2020: D+6.1 2016: R+3.1 2012: R+7.9 2008: D+0.5
Not yet ingested
- Civics
- —
Market trends
- HPI YoY
- ▼ -208.41%
- Current HPI
- 325.8096
- Rent YoY
- —
- Metro
- Grand Rapids-Kentwood, MI
- State GDP YoY
- ▲ 1.37%
- F500 in state
- 28
Industry mix (Fortune 500 HQ in MI)
| Industry | F500 HQs | Revenue |
|---|---|---|
| Automotive Parts | 3 | $48B |
|
||
| Automotive | 2 | $372B |
|
||
| Chemicals | 1 | $45B |
|
||
| Automotive Retail | 1 | $29B |
|
||
| Healthcare / Medical Devices | 1 | $23B |
|
||
| Automotive Technology | 1 | $20B |
|
||
Cash-flow waterfall
monthlySold comps — $/sqft
last 12 mo · ≤1 miLoading sold comps…