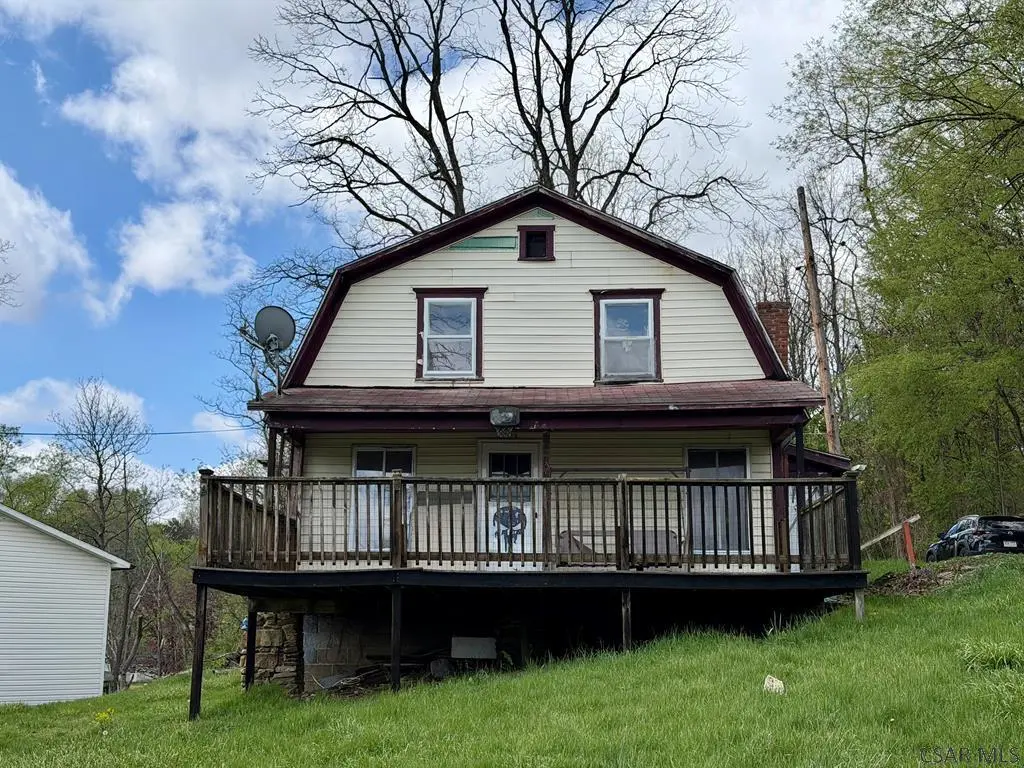
431 Finch St · Elim, PA
Flood risk 1/10 · Minimal
- FEMA flood zone
- X (unshaded)
- Chance of flooding over 30 yrs
- 0.0%
- Est. flood insurance / yr
- $473 – $860
Fire risk 1/10 · Minimal
- Est. fire insurance / yr
- $511 – $949
Heat risk 3/10 · Minor
- Hot days now (above 93°F)
- 7 days/yr
- Hot days in 30 yrs
- 16 days/yr
Wind risk 2/10 · Minimal
- Chance of severe wind over 30 yrs
- —
Air-quality risk 2/10 · Minimal
- Unhealthy air days now
- 1 days/yr
- Unhealthy air days in 30 yrs
- 2 days/yr
Risk factors via First Street. Map © Google.
Why this score? — see what drove the B- grade
The composite is a weighted blend of 9 inputs, each scored 0–100. Each bar is that input's sub-score; the figure is the points it added to the 100-point composite (weight × sub-score).
- Cash flow +30.0/30.0
- 1% rule +10.0/10.0
- DSCR +10.0/10.0
- ARV discount +7.5/15.0
- Schools +3.9/10.0
- Livability +3.4/5.0
- Rent growth +2.5/5.0
- Condition / age +2.5/5.0
- Appreciation +0.0/10.0
$29,995
🖨 Deal sheet 📄 Offer letter ✓ Due diligence
Listing remarks MLS
Ad# 4027.. .. Priced to sell in the Westmont Hilltop School District!!! 1.5 story home offers 3 bedrooms and 1 1/2 baths. The first floor has a large kitchen with oak cabinets, living room w/ carpet, powder room and bedroom with a closet. Upstairs you will find 2 additional spacious bedrooms and a full bath. The full basement is unfinished and offers a walk out and laundry hookups. Corner lot and partially covered deck area! Call today! VISUAL TOUR BY EMAIL!
Key facts
- 8,712 sq ft lot
- Built 1926
- Listed 48 days
Property features AI
Exterior
- Parking: On-street parking
- Utilities: Public water; Public sewer; Sewer available
- Home design: Single-family residence; One and one-half levels; Residential zoning
- Construction: Vinyl siding; Shingle roof
- Exterior features: Deck; Irregular lot; City street frontage; Publicly maintained road
Interior
- Kitchen: Eat-in kitchen
- Bedrooms: Master bedroom located downstairs
- Flooring: Vinyl flooring; Wood flooring
- Bathrooms: 1 full bathroom; 1 half bathroom
- Heating & cooling: Forced air heating; Natural gas
- Interior features: Eat-in kitchen; Master bedroom on the main level; Double-pane windows
- Laundry & utility: Laundry in basement; Full, unfinished basement
Neighborhood map
What this means for you Summary
Snapshot
- This is a 3-bed/1.5-bath single-family listed at $30k.
Deal economics
- At list price, monthly cash flow is $541 ($6k/yr) — positive.
- The deal already cash-flows at list — no discount required.
- Meets the 1% rule at list price ($980 rent vs $30k).
- Recommended offer: $29k (3.0% below list) — sets the bar for market timing.
Location & tenants
- Location reads 67/100 on livability (#992 in PA) — a middle-class / working-renter tenant base. Strengths: cost of living A+, housing A+, crime A; Watch: schools D+, amenities F, commute F.
- Westmont Hilltop SD (suburban): math 39% / reading 51% proficiency, ranked #252 of 539 in PA (top 47%) — families likely to look elsewhere, expect single-tenant / working-renter base with shorter leases.
- Market conditions: 92 active listings in the ZIP; 3 comparable units currently listed for rent nearby; rentals lingering (median 44d on market — plan ~5-8 weeks vacancy on turnover, expect pricing pressure); 100% of comp listings sitting > 30 days — soft ceiling on asking rent; 64 units permitted in Cambria County in 2024 (0 in 5+ unit buildings).
- This rent is only 17% of the median local income ($69k/yr) — well below the 30% rent-burden line; pricing power to push rent on renewal without tenant pushback.
Forward outlook
- Local home prices are declining (-3.0%/yr); year-one equity from $207 of loan paydown is wiped out by about $900 of value loss. Plan a longer hold.
- Cambria County population projected at -28% by 2050 — secular population decline; favor cash flow + early exit over multi-decade hold.
- At projected returns (-3.0% appreciation + 3.0% rent growth), your $8k cash investment doubles in ~2 years — after that, you're playing with house money.
Negotiation context
- It's been on market 49 days — a 3% lower offer ($29k) is reasonable based on typical stale-listing flexibility.
- 3 sale attempts since 20y ago; this cycle's ask has dropped $5k (14%) from the opening price — seller is motivated, your offer sets the floor, not the list.
- Current owner paid $23k; 30% above their basis — modest negotiation headroom, anchor on the comps not their cost.
Risks & watch-outs
- Watch-outs: property tax is 2.5% of price; built in 1926 — expect roof / HVAC / electrical / plumbing capex.
Questions for the listing agent
- It's been on market 49 days. Have you received any prior offers? Is the seller open to a 3% concession, seller financing, or rate buy-down credit?
- Built in 1926 — when were the roof, HVAC, electrical panel, plumbing, and water heater last replaced?
- Property tax is high relative to price — has the assessment been appealed recently, and will the sale trigger a re-assessment?
- Is there a deadline driving the sale (1031 exchange, divorce, estate, relocation)? That informs how much negotiation room exists.
- Schools are D-rated, which usually means shorter tenancies and higher turnover. Who's the typical renter profile here, and what's been the actual vacancy rate?
- What's the average days-on-market for RENTAL listings here right now (not sales)? A rising rental-DOM trend means longer vacancies and softer asking-rent achievability than the comps imply.
- What's the recent tenant-quality profile in this submarket — average credit score on applications, eviction rate, late-payment / NSF rate, and stable-employment percentage? A property-management company in the area should have these aggregated.
- How much new for-sale + rental construction is in the pipeline within 1–3 miles? Heavy new supply typically softens prices + rents 12–24 months out; constrained supply supports both.
Investment metrics
- 1% rule
- 3.27% ✓
- Cap rate
- 27.93%
- Cash-on-cash
- 77.28%
- DSCR
- 4.44
- GRM
- 2.6
CMA / ARV
- ARV (median comp)
- $76,430
- List price
- $29,995
- Delta
- -60.75%
- Verdict
- UNDERPRICED
- Comps
- 20 within 1.0 mi
Show comp detail 12 sales within ~0.75 mi
| Address | Dist | Beds/Ba | Sqft | Sold | Price | $/sf | Match |
|---|---|---|---|---|---|---|---|
| 245 Sell St | 0.40mi | 2/1.0 (-1) | 960 (-3%) | 3mo | $57,000 | $59 | 67 |
| 263 Capital Ave | 0.51mi | 2/1.0 (-1) | 960 (-3%) | 1mo | $80,000 | $83 | 64 |
| 94 Bronx St | 0.68mi | 2/1.5 (-1) | 980 (-1%) | 1mo | $132,500 | $135 | 60 |
| 504 Swank St | 0.43mi | 3/1.0 | 1,040 (+5%) | 11mo | $82,500 | $79 | 60 |
| 267 Derby St | 0.47mi | 3/1.5 | 1,104 (+12%) | 8mo | $97,000 | $88 | 52 |
| 1 Shady Ln | 0.24mi | 2/1.0 (-1) | 1,121 (+13%) | 11mo | $65,000 | $58 | 50 |
| 121 Royal Ave | 0.57mi | 2/1.0 (-1) | 940 (-5%) | 10mo | $90,000 | $96 | 49 |
| 120 Northwood Ave | 0.67mi | 3/1.0 | 1,073 (+8%) | 8mo | $67,500 | $63 | 46 |
| 1121 Boyd Ave | 0.74mi | 2/1.0 (-1) | 934 (-6%) | 4mo | $47,000 | $50 | 46 |
| 551 Bluff St | 0.53mi | 3/1.0 | 1,132 (+14%) | 7mo | $107,000 | $95 | 43 |
| 1355 Franklin St | 0.60mi | 2/1.0 (-1) | 868 (-12%) | 4mo | $68,000 | $78 | 41 |
| 108 Woodruff St | 0.73mi | 2/1.0 (-1) | 1,120 (+13%) | 8mo | $25,000 | $22 | 31 |
Match score weights: distance 35% · size 25% · config 20% · recency 20%. Top-matched comps best support the ARV.
Projected returns pro-forma
-3.0% appreciation · 3.0% rent growth · sell at horizon
- IRR
- 77.3%
- Equity multiple
- 4.53×
- Total profit
- $29,620
- Equity at exit
- $4,472
- IRR
- 80.9%
- Equity multiple
- 9.37×
- Total profit
- $70,278
- Equity at exit
- $2,593
Cash invested: $8,399 (down + closing). Projections, not guarantees.
Landlord ↔ Tenant lean methodology
- Overall (STATE)
- 62 Landlord-Friendly
- State Pennsylvania
- 62 Landlord-Friendly · EVEN
- County
- — inherits STATE
- City
- — inherits STATE
ZIP-level market 15905
- Home prices YoY
- -31.1%
- Active inventory
- 92
- Price-to-rent
- 2.6×
Monthly cashflow live
- Estimated rent
- $980 medium interval (Pro) →
- Mortgage (P&I)
- −$157
- Tax from tax record
- −$64 /mo · $762/yr
- Insurance
- −$12
- HOA
- −$0
- Vacancy / Maint / Mgmt
- −$206
- Net cashflow
- $541
Break-even live
UW: 25.0% down · 7.5% · 30yr · 1.5% tax · 5.0% vac · 8.0% maint · 8.0% mgmt
Financing live
Cash to close
- Down payment
- $7,499
- Closing costs
- $900
- Reserves months
- —
- Total cash needed
- —
Loan-product check · same deal, 3 products live
Conventional
25% down · 7.5% · 30yr
- Down + closing
- —
- Monthly P&I
- —
- Monthly cashflow
- —
- DSCR
- —
- Eligible?
- —
Personal DTI + credit; lowest rate.
DSCR
20% down · 8.5% · 30yr
- Down + closing
- —
- Monthly P&I
- —
- Monthly cashflow
- —
- DSCR
- —
- Eligible?
- —
No personal income docs; deal must DSCR.
Hard money
10% down · 12.0% · 12mo
- Down + closing
- —
- Monthly P&I
- —
- Monthly cashflow
- —
- DSCR
- —
- Eligible?
- —
Short-term bridge; refi at stabilization.
Rent comps 3 comps
| Address | Beds | Baths | Sqft | Rent | $/sqft | DOM | Units | Dist |
|---|---|---|---|---|---|---|---|---|
| 619 Grove Ave Johnstown, PA | 2.0 | 2.0 | 1100 | $1,050 | $0.95 | 43d | 1 | 1.20mi |
| 412 Oak St Unit 1 Johnstown, PA | 2.0 | 1.0 | 1100 | $900 | $0.82 | 43d | 1 | 1.25mi |
| 522 Vickroy Ave Johnstown, PA | 3.0 | 1.0 | 1125 | $850 | $0.76 | 43d | 1 | 1.30mi |
Listing history 22 events
-
2026-06-19days on market $29,995 Active 49 DOM
-
2026-06-18days on market $29,995 Active 48 DOM
-
2026-06-17days on market $29,995 Active 47 DOM
-
2026-06-16days on market $29,995 Active 46 DOM
-
2026-06-15days on market $29,995 Active 45 DOM
-
2026-06-14days on market $29,995 Active 43 DOM
-
2026-06-12pricedays on market $29,995 Active 42 DOM
-
2026-06-09days on market $34,900 Active 39 DOM
-
2026-06-08days on market $34,900 Active 38 DOM
-
2026-06-07days on market $34,900 Active 37 DOM
-
2026-06-05days on market $34,900 Active 34 DOM
-
2026-06-03days on market $34,900 Active 33 DOM
-
2026-06-02days on market $34,900 Active 32 DOM
-
2026-06-01days on market $34,900 Active 31 DOM
-
2026-05-31days on market $34,900 Active 30 DOM
-
2026-05-30days on market $34,900 Active 29 DOM
-
2026-05-13status Pending 419-char remark
-
2026-04-23$34,900 Active 419-char remark
-
2007-08-17soldstatus $23,000 465-char remark
Show marketing remark (465 chars)
Ad# 4027.. .. Priced to sell in the Westmont Hilltop School District!!! 1.5 story home offers 3 bedrooms and 1 1/2 baths. The first floor has a large kitchen with oak cabinets, living room w/ carpet, powder room and bedroom with a closet. Upstairs you will find 2 additional spacious bedrooms and a full bath. The full basement is unfinished and offers a walk out and laundry hookups. Corner lot and partially covered deck area! Call today! VISUAL TOUR BY EMAIL!
-
2007-07-20soldstatus $23,000
-
2006-10-23$27,500 465-char remark
Show marketing remark (465 chars)
Ad# 4027.. .. Priced to sell in the Westmont Hilltop School District!!! 1.5 story home offers 3 bedrooms and 1 1/2 baths. The first floor has a large kitchen with oak cabinets, living room w/ carpet, powder room and bedroom with a closet. Upstairs you will find 2 additional spacious bedrooms and a full bath. The full basement is unfinished and offers a walk out and laundry hookups. Corner lot and partially covered deck area! Call today! VISUAL TOUR BY EMAIL!
-
1981-07-01soldstatus $10,500
ⓘ Source: listings_history table (triggers on properties + properties_extension) + one-shot
backfill from property_details.listing_events for pre-trigger history.
Tax reassessment forecast PA · Partial reset (capped growth)
- Current annual tax
- $762 · $64/mo
- Projected year-2 tax
- $762 · $64/mo
- Expected delta
- $0/yr ($0/mo · 0.0%)
ⓘ Screening estimate from a state-policy table — verify with the county assessor before closing.
Climate risk First Street
- Flood 1/10 Low FEMA zone X (unshaded) · 0% chance over 30 yrs
- Wildfire 1/10 Low
- Heat 3/10 Moderate 7 d/yr ≥93°F today · 16 d/yr by 30 yrs out
- Wind 2/10 Low
- Air quality 2/10 Low 1 unhealthy d/yr today · 2 by 30 yrs out
Nearby sold comps map
Loading sold comps map…
Walkable amenities ~0.75 mi
Loading nearby amenities…
Taxation est. · year 1
- Rental income
- $11,760
- − Mortgage interest
- −$1,680
- − Property taxes
- −$762
- − Insurance
- −$150
- − Repairs & maintenance
- −$941
- − Management
- −$941
- − Depreciation
- −$873
- Taxable income
- $6,414
- Est. tax owed @ 24.0%
- −$1,539
- After-tax cash flow
- $4,952/yr
For passive investors: Depreciation is non-cash, so a rental often shows a tax loss while cash-flowing — sheltering income. Rental losses are passive: they offset passive income freely, and up to $25,000/yr can offset ordinary (W-2) income if you actively participate and your MAGI is under $100k (phasing out to $0 by $150k); unused losses carry forward. On sale, claimed depreciation is recaptured at up to 25%, and gains may owe capital-gains tax (a 1031 exchange can defer both). Figures are a year-1 estimate at your 24.0% rate — not tax advice; consult a CPA.
Schools (NCES district)
- District
- Westmont Hilltop SD
- NCES district ID
- 4226130
- Math proficiency
- 39% ▼ -10.00%
- Reading proficiency
- 51% ▼ -15.00%
- Median HH income
- $59,325
- Composite
- 39.49/100
- National rank
- #3955
- State rank
- #252 of 539 in PA
Livability — Elim
- Score
- 67/100
- State rank
- #992
- US rank
- #10931
Category grades
Schools grade is shown separately in the Schools card above.
Census & demographics
- Census place
- Elim, PA
- County
- Cambria County · 30,791 people
- Metro
- Johnstown, PA
- Population (ZIP)
- 19,329
- Household income
- $69,212
- Rent vs Own
- Severe rent burden
- 359.0
Population outlook (Cambria County) Hauer SSP2
- Today (2025)
- 122,754 people
- By 2030
- 115,827 · -5.6%
- By 2040
- 101,309 · -17.5%
- By 2050
- 88,379 · -28.0%
- By 2075
- 65,237 · -46.9%
- By 2100
- 46,909 · -61.8%
Race, ethnicity, and origin ACS 2023
- Neighborhood character
- Predominantly White (92%)
- Race & ethnicity
- White 92% Two or more races 3% Hispanic / Latino 2% Black 2%
- Common ancestry
- Romanian 7% Scotch-Irish 1% Italian 1%
- Foreign-born
- 2% · Canada
- Languages at home
- 96% English-only · Spanish 1%
Political lean MEDSL · Cambria
- 2024 margin
- Solid R (+39.7) · D 29.8% · R 69.5%
- 2008→2024 swing
- -40.4pp toward R · 2008: 0.7pp · 2024: -39.7pp
- All cycles
- 2024: R+39.7 2020: R+37.3 2016: R+37.8 2012: R+17.8 2008: D+0.7
Not yet ingested
- Civics
- —
Market trends
- HPI YoY
- ▼ -64.18%
- Current HPI
- 142.5218
- Rent YoY
- —
- Metro
- Johnstown, PA
- State GDP YoY
- ▲ 1.68%
- F500 in state
- 34
Industry mix (Fortune 500 HQ in PA)
| Industry | F500 HQs | Revenue |
|---|---|---|
| Healthcare | 2 | $309B |
|
||
| Insurance | 2 | $27B |
|
||
| Telecommunications / Media | 1 | $124B |
|
||
| Industrial Distribution | 1 | $22B |
|
||
| Financial Services | 1 | $20B |
|
||
| Chemicals / Materials | 1 | $18B |
|
||
Price history
+185.7% since first listed8 events — show timeline
- 2026-06-11 Price Changed $29,995 CSMLS
- 2026-05-22 Relisted — CSMLS
- 2026-05-13 Pending — CSMLS
- 2026-04-23 Listed $34,900 CSMLS
- 2007-08-17 Sold (MLS) $23,000 CSMLS
- 2007-07-20 Sold (Public Records) $23,000 Public Records
- 2006-10-23 Listed $27,500 CSMLS
- 1981-07-01 Sold (Public Records) $10,500 Public Records
Property tax history
+0.3%/yrLatest (2026): $762 · +0.0% YoY. Source: county tax records.
Cash-flow waterfall
monthlySold comps — $/sqft
last 12 mo · ≤1 miLoading sold comps…