35306 Azalea Ln · French Valley, CA
Flood risk 1/10 · Minimal
- FEMA flood zone
- D
- Chance of flooding over 30 yrs
- 0.0%
- Est. flood insurance / yr
- $544 – $1,084
Fire risk 7/10 · Major
- Est. fire insurance / yr
- $659 – $1,223
Heat risk 7/10 · Major
- Hot days now (above 104°F)
- 5 days/yr
- Hot days in 30 yrs
- 12 days/yr
Wind risk 1/10 · Minimal
- Chance of severe wind over 30 yrs
- —
Air-quality risk 4/10 · Minor
- Unhealthy air days now
- 6 days/yr
- Unhealthy air days in 30 yrs
- 7 days/yr
Risk factors via First Street. Map © Google.
Why this score? — see what drove the D grade
The composite is a weighted blend of 9 inputs, each scored 0–100. Each bar is that input's sub-score; the figure is the points it added to the 100-point composite (weight × sub-score).
- Appreciation +10.0/10.0
- Cash flow +7.8/30.0
- ARV discount +6.1/15.0
- Schools +5.7/10.0
- Livability +3.0/5.0
- Condition / age +2.5/5.0
- Rent growth +2.3/5.0
- DSCR +1.9/10.0
- 1% rule +1.6/10.0
$749,000
🖨 Deal sheet (PDF) 📄 Offer letter ✓ Due diligence
Listing remarks MLS
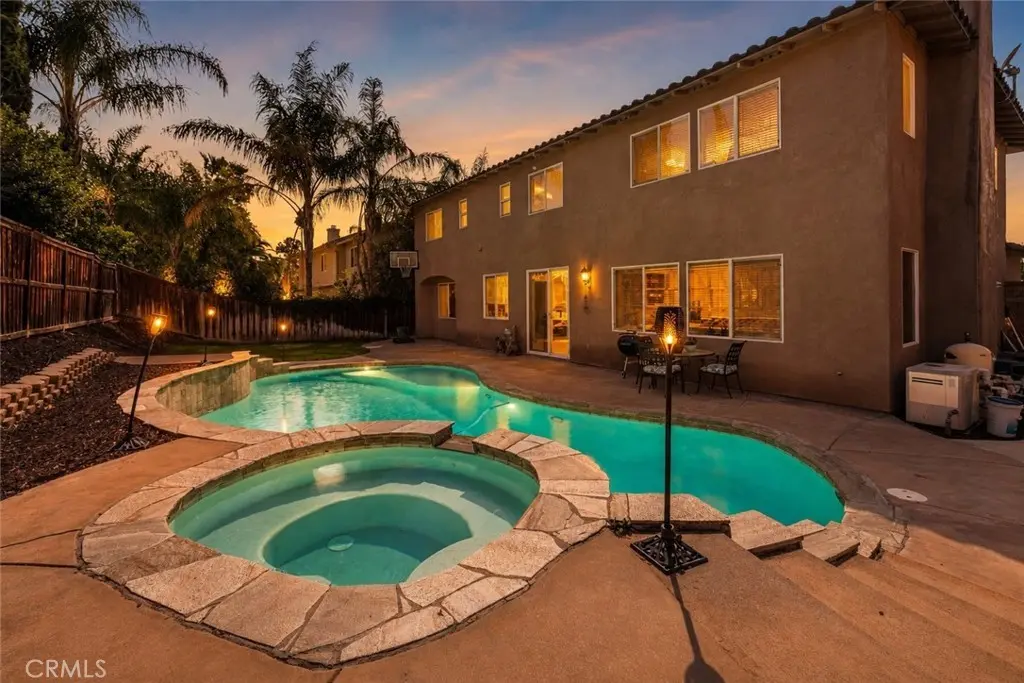
Welcome to 35306 Azalea Ln! This spacious 6-bedroom 3-bathroom home offers the perfect blend of comfort and functionality, featuring a beautiful pool, a large kitchen, two living rooms, and multiple dining areas ideal for both everyday living and entertaining. The main floor includes a full bathroom and a generously sized bedroom, with the flexibility to create a combined office-bedroom space or two separate bedrooms! Upstairs, you will find a large primary suite complete with two oversized walk-in closets, providing ample storage and a private retreat. A separate laundry room adds convenience, while the two-car garage and large side gate offer potential for RV parking or additional storage. Step outside to enjoy your own backyard oasis with a sparkling pool, perfect for relaxing or hosting gatherings. You do not want to miss the opportunity to make this your home. Schedule your showing today.
Key facts
- Large kitchen
- Two living rooms
- Large primary suite
Tags
Neighborhood map
What this means for you Summary
Snapshot
- This is a 6-bed/3.0-bath single-family listed at $749k.
Deal economics
- At list price, monthly cash flow is $-835 ($-10k/yr) — negative.
- To cash-flow at today's rent, offer at most $602k (19.7% below list).
- To meet the 1% rule (rent ≥ 1% of price), the offer needs to be $493k (34.1% below list).
- Recommended offer: $493k (34.1% below list) — sets the bar for 1% rule.
- Cap rate 5.0% vs local median 3.5% in French Valley — top-decile yield for the area; either an underpriced asset or a hidden risk that comps aren't pricing in. Stress-test before assuming the spread holds.
Location & tenants
- Location reads 59/100 on livability (#655 in CA) — a working-class tenant base; expect higher turnover. Strengths: employment A+, housing A+; Watch: crime D-, amenities F, commute F.
- Temecula Valley Unified (urban): math 55% / reading 69% proficiency, ranked #173 of 1,400 in CA (top 12%) — acceptable for families but not a draw, mixed tenant base, ~2y average lease; only 17% free/reduced lunch — higher-income household profile.
- Zoned schools: Susan La Vorgna Elementary (810 students, 27% FRL); Bella Vista Middle (1,396 students, 26% FRL); Chaparral High (3,030 students, 27% FRL).
- Market conditions: Rents soft (-0.8%/yr); 353 active listings in the ZIP; 4 comparable units currently listed for rent nearby; rentals lingering (median 46d on market — plan ~5-8 weeks vacancy on turnover, expect pricing pressure); 50% of comp listings sitting > 30 days — soft ceiling on asking rent; high-income renter base; 9,195 units permitted in Riverside County in 2024 (1,512 in 5+ unit buildings).
- This rent runs 45% of the median local income ($133k/yr) — at the standard rent-burdened threshold; future hikes will face affordability resistance.
Forward outlook
- In year one you build about $80k of equity ($5k loan paydown + $75k appreciation (10.0% local appreciation)).
- Riverside County population projected at +22% by 2050 — long-run rental-demand tailwind backs the buy-and-hold thesis.
- By year 2, paydown + projected appreciation supports a ~$129k cash-out refi (75% LTV) — recoverable capital for the next deal without selling this one.
Negotiation context
- It's been on market 58 days — a 3% lower offer ($727k) is reasonable based on typical stale-listing flexibility.
- 5 sale attempts since 18y ago with the ask held roughly flat each time — persistent listings suggest the price (not the market) is what's stuck; bring a comps-based counter.
- Current owner paid $280k; list at $749k implies a 168% gain — meaningful room to come down on a strong offer.
Risks & watch-outs
- Climate carrying-cost: major wildfire risk; extreme-heat days projected 5→12/yr by 2055 (HVAC capex compounding) — expect insurance premiums to compound above CPI over the hold.
Questions for the listing agent
- What do current leases actually rent for vs. the listed asking? Can we see a recent rent roll and the last 12 months of T-12 income?
- It's been on market 58 days. Have you received any prior offers? Is the seller open to a 34% concession, seller financing, or rate buy-down credit?
- What does the HOA fee cover, when was the last increase, and are there any pending special assessments or reserve-fund shortfalls?
- Is there a deadline driving the sale (1031 exchange, divorce, estate, relocation)? That informs how much negotiation room exists.
- Schools are D-rated, which usually means shorter tenancies and higher turnover. Who's the typical renter profile here, and what's been the actual vacancy rate?
- Crime grade is D in this area — have there been break-ins, vandalism, or insurance claims at this property in the last 3 years? What carrier currently insures it and at what premium?
- The area grade is low — what's the realistic commute time and amenity access for the typical tenant pool here? Any planned neighborhood developments (good or bad) we should know about?
- What's the average days-on-market for RENTAL listings here right now (not sales)? A rising rental-DOM trend means longer vacancies and softer asking-rent achievability than the comps imply.
- What's the recent tenant-quality profile in this submarket — average credit score on applications, eviction rate, late-payment / NSF rate, and stable-employment percentage? A property-management company in the area should have these aggregated.
- How much new for-sale + rental construction is in the pipeline within 1–3 miles? Heavy new supply typically softens prices + rents 12–24 months out; constrained supply supports both.
Investment metrics
- 1% rule
- 0.66% ✗
- Cap rate
- 4.96%
- Cash-on-cash
- -4.78%
- DSCR
- 0.79
- GRM
- 12.7
CMA / ARV
- ARV (median comp)
- $726,502
- List price
- $749,000
- Delta
- 3.10%
- Verdict
- FAIR
- Comps
- 20 within 1.0 mi
Show comp detail 12 sales within ~0.75 mi
| Address | Dist | Beds/Ba | Sqft | Sold | Price | $/sf | Match |
|---|---|---|---|---|---|---|---|
| 35403 Laurel Tree Ct | 0.21mi | 5/3.0 (-1) | 2,719 (-8%) | 9mo | $800,000 | $294 | 65 |
| 35689 Yellowstone | 0.38mi | 5/3.0 (-1) | 2,660 (-10%) | 5mo | $660,000 | $248 | 57 |
| 31969 Odyssey | 0.48mi | 5/3.0 (-1) | 2,736 (-7%) | 5mo | $725,000 | $265 | 56 |
| 35574 Athena Ct | 0.58mi | 5/3.5 (-1) | 2,820 (-4%) | 4mo | $755,000 | $268 | 55 |
| 32144 Old Country Ct | 0.55mi | 5/4.5 (-1) | 3,108 (+6%) | 0mo | $780,000 | $251 | 54 |
| 35658 Denali Way | 0.39mi | 5/3.0 (-1) | 2,660 (-10%) | 8mo | $871,500 | $328 | 54 |
| 32526 Presidio Hls | 0.58mi | 5/3.0 (-1) | 3,213 (+9%) | 2mo | $785,000 | $244 | 52 |
| 35041 Painted Rock St | 0.51mi | 5/3.0 (-1) | 2,719 (-8%) | 9mo | $735,000 | $270 | 51 |
| 32125 Bandelier Rd | 0.43mi | 5/3.0 (-1) | 3,331 (+13%) | 7mo | $755,000 | $227 | 48 |
| 35676 Small Pine Ct | 0.42mi | 5/3.5 (-1) | 3,369 (+14%) | 6mo | $874,990 | $260 | 44 |
| 32676 Quiet Trail Dr | 0.71mi | 5/3.0 (-1) | 3,213 (+9%) | 4mo | $725,000 | $226 | 43 |
| 32591 Shadyview | 0.52mi | 5/3.5 (-1) | 3,363 (+14%) | 7mo | $895,000 | $266 | 40 |
Match score weights: distance 35% · size 25% · config 20% · recency 20%. Top-matched comps best support the ARV.
Projected returns pro-forma
10.0% appreciation · 0.0% rent growth · sell at horizon
- IRR
- 20.1%
- Equity multiple
- 2.62×
- Total profit
- $340,094
- Equity at exit
- $674,759
- IRR
- 17.9%
- Equity multiple
- 5.85×
- Total profit
- $1,017,058
- Equity at exit
- $1,455,142
Cash invested: $209,720 (down + closing). Projections, not guarantees.
Landlord ↔ Tenant lean methodology
- Overall (STATE)
- 18 Strongly Tenant-Friendly
- State California
- 18 Strongly Tenant-Friendly · D+13
- County
- — inherits STATE
- City
- — inherits STATE
ZIP-level market 92596
- Home prices YoY
- 3.9%
- Rents YoY
- -0.8%
- Active inventory
- 353
- Price-to-rent
- 12.7×
Monthly cashflow live
- Estimated rent
- $4,933 medium interval (Pro) →
- Mortgage (P&I)
- −$3,928
- Tax from tax record
- −$478 /mo · $5,736/yr
- Insurance
- −$312
- HOA
- −$14
- Vacancy / Maint / Mgmt
- −$1,036
- Net cashflow
- $-835
Break-even live
Sensitivity live
| Price | -10% $-411 | -5% $-623 | +0% $-835 | +5% $-1,047 | +10% $-1,259 |
|---|---|---|---|---|---|
| Rent | -10% $-1,225 | -5% $-1,030 | +0% $-835 | +5% $-640 | +10% $-445 |
| Rate | -1.0pp $-458 | -0.5pp $-644 | base $-835 | +0.5pp $-1,029 | +1.0pp $-1,226 |
UW: 25.0% down · 7.5% · 30yr · 1.5% tax · 5.0% vac · 8.0% maint · 8.0% mgmt
Financing live
Cash to close
- Down payment
- $187,250
- Closing costs
- $22,470
- Reserves months
- —
- Total cash needed
- —
Loan-product check · same deal, 3 products live
Conventional
25% down · 7.5% · 30yr
- Down + closing
- —
- Monthly P&I
- —
- Monthly cashflow
- —
- DSCR
- —
- Eligible?
- —
Personal DTI + credit; lowest rate.
DSCR
20% down · 8.5% · 30yr
- Down + closing
- —
- Monthly P&I
- —
- Monthly cashflow
- —
- DSCR
- —
- Eligible?
- —
No personal income docs; deal must DSCR.
Hard money
10% down · 12.0% · 12mo
- Down + closing
- —
- Monthly P&I
- —
- Monthly cashflow
- —
- DSCR
- —
- Eligible?
- —
Short-term bridge; refi at stabilization.
Rent comps 4 comps
| Address | Beds | Baths | Sqft | Rent | $/sqft | DOM | Units | Dist |
|---|---|---|---|---|---|---|---|---|
| 34629 Foxberry Rd Winchester, CA | 5.0 | 5.5 | 3887 | $4,179 | $1.08 | 4d | 1 | 0.79mi |
| 36395 Pistachio Dr Winchester, CA | 5.0 | 4.0 | 4020 | $4,500 | $1.12 | 45d | 1 | 1.14mi |
| 36173 Saint Claire Ct Winchester, CA | 6.0 | 3.5 | 2905 | $6,000 | $2.07 | 45d | 1 | 1.21mi |
| 32907 Cambury Pl Winchester, CA | 5.0 | 4.0 | 2641 | $3,795 | $1.44 | 0d | 1 | 1.41mi |
HOA detail
- Monthly dues
- $14 · $168/yr
- Likely covers
- pool
Listing history 23 events
-
2026-06-17days on market $749,000 Active 58 DOM
-
2026-06-09days on market $749,000 Active 55 DOM
-
2026-06-08days on market $749,000 Active 54 DOM
-
2026-06-07days on market $749,000 Active 53 DOM
-
2026-06-04days on market $749,000 Active 50 DOM
-
2026-06-03days on market $749,000 Active 49 DOM
-
2026-06-02days on market $749,000 Active 48 DOM
-
2026-06-01days on market $749,000 Active 47 DOM
-
2026-05-31days on market $749,000 Active 46 DOM
-
2026-04-15$774,999 Active 907-char remark
Show marketing remark (907 chars)
Welcome to 35306 Azalea Ln! This spacious 6-bedroom 3-bathroom home offers the perfect blend of comfort and functionality, featuring a beautiful pool, a large kitchen, two living rooms, and multiple dining areas ideal for both everyday living and entertaining. The main floor includes a full bathroom and a generously sized bedroom, with the flexibility to create a combined office-bedroom space or two separate bedrooms! Upstairs, you will find a large primary suite complete with two oversized walk-in closets, providing ample storage and a private retreat. A separate laundry room adds convenience, while the two-car garage and large side gate offer potential for RV parking or additional storage. Step outside to enjoy your own backyard oasis with a sparkling pool, perfect for relaxing or hosting gatherings. You do not want to miss the opportunity to make this your home. Schedule your showing today.
-
2009-02-27soldstatus $280,000 Closed 584-char remark
Show marketing remark (584 chars)
Bank Owned REO Property. Very nice 6 bedroom, 3 bath home with a custom inground pool and spa. There is also a bonus room upstairs, as well as a guest suite down stairs, separate bathroom with a small living area. Interior has been completely repainted and has new carpet. This home is very clean. Exterior has nice concrete work. Numerous incentives are available through banks affiliated lender on this property. Banks additional AS-IS Addendum is available by calling or emailing the L/A. This addendum is only needed for accepted offers. See remarks below when submitting an offer
-
2008-12-15historical 584-char remark
Show marketing remark (584 chars)
Bank Owned REO Property. Very nice 6 bedroom, 3 bath home with a custom inground pool and spa. There is also a bonus room upstairs, as well as a guest suite down stairs, separate bathroom with a small living area. Interior has been completely repainted and has new carpet. This home is very clean. Exterior has nice concrete work. Numerous incentives are available through banks affiliated lender on this property. Banks additional AS-IS Addendum is available by calling or emailing the L/A. This addendum is only needed for accepted offers. See remarks below when submitting an offer
-
2008-12-09$274,900 584-char remark
Show marketing remark (584 chars)
Bank Owned REO Property. Very nice 6 bedroom, 3 bath home with a custom inground pool and spa. There is also a bonus room upstairs, as well as a guest suite down stairs, separate bathroom with a small living area. Interior has been completely repainted and has new carpet. This home is very clean. Exterior has nice concrete work. Numerous incentives are available through banks affiliated lender on this property. Banks additional AS-IS Addendum is available by calling or emailing the L/A. This addendum is only needed for accepted offers. See remarks below when submitting an offer
-
2008-12-05historical
-
2008-12-02price $299,900
-
2008-11-21price $309,900
-
2008-11-06$321,900
-
2008-10-31historical
-
2008-09-24$321,900
-
2008-09-21historical
-
2008-09-04price $321,900
-
2008-08-07price $334,900
-
2008-06-24$349,000
ⓘ Source: listings_history table (triggers on properties + properties_extension) + one-shot
backfill from property_details.listing_events for pre-trigger history.
Tax reassessment forecast CA · Resets to sale price
- Current annual tax
- $5,736 · $478/mo
- Projected year-2 tax
- $5,736 · $478/mo
- Expected delta
- $0/yr ($0/mo · 0.0%)
ⓘ Screening estimate from a state-policy table — verify with the county assessor before closing.
Climate risk First Street
- Flood 1/10 Low FEMA zone D · 0% chance over 30 yrs
- Wildfire 7/10 Severe
- Heat 7/10 Severe 5 d/yr ≥104°F today · 12 d/yr by 30 yrs out
- Wind 1/10 Low
- Air quality 4/10 Moderate 6 unhealthy d/yr today · 7 by 30 yrs out
Nearby sold comps map
Loading sold comps map…
Walkable amenities ~0.75 mi
Loading nearby amenities…
Taxation est. · year 1
- Rental income
- $59,195
- − Mortgage interest
- −$41,956
- − Property taxes
- −$5,736
- − Insurance
- −$3,745
- − Repairs & maintenance
- −$4,736
- − Management
- −$4,736
- − HOA
- −$168
- − Depreciation
- −$21,789
- Taxable loss
- −$23,670
- Est. tax savings @ 24.0%
- +$5,681
- After-tax cash flow
- $-4,338/yr
For passive investors: Depreciation is non-cash, so a rental often shows a tax loss while cash-flowing — sheltering income. Rental losses are passive: they offset passive income freely, and up to $25,000/yr can offset ordinary (W-2) income if you actively participate and your MAGI is under $100k (phasing out to $0 by $150k); unused losses carry forward. On sale, claimed depreciation is recaptured at up to 25%, and gains may owe capital-gains tax (a 1031 exchange can defer both). Figures are a year-1 estimate at your 24.0% rate — not tax advice; consult a CPA.
Schools (NCES district)
- District
- Temecula Valley Unified
- NCES district ID
- 0600028
- Math proficiency
- 55% ▲ 1.00%
- Reading proficiency
- 69% ▲ 1.00%
- Median HH income
- $84,032
- Composite
- 57.48/100
- National rank
- #2264
- State rank
- #173 of 1400 in CA
Livability — French Valley
- Score
- 59/100
- State rank
- #655
- US rank
- #20351
Category grades
Schools grade is shown separately in the Schools card above.
Census & demographics
- Census place
- French Valley, CA
- County
- Riverside County · 2,287,001 people
- Metro
- Riverside-San Bernardino-Ontario, CA
- Population (ZIP)
- 38,981
- Household income
- $132,538
- Rent vs Own
- Severe rent burden
- 591.0
Population outlook (Riverside County) Hauer SSP2
- Today (2025)
- 2,664,475 people
- By 2030
- 2,802,692 · +5.2%
- By 2040
- 3,050,904 · +14.5%
- By 2050
- 3,256,783 · +22.2%
- By 2075
- 3,655,058 · +37.2%
- By 2100
- 3,766,594 · +41.4%
Race, ethnicity, and origin ACS 2023
- Neighborhood character
- Highly diverse neighborhood (Simpson 0.72)
- Race & ethnicity
- White 38% Hispanic / Latino 34% Two or more races 16% Asian 12% Black 6% Pacific Islander 2%
- Hispanic origin (detail)
- Mexican 29%
- Common ancestry
- Slovak 3% Italian 2% Portuguese 1%
- Foreign-born
- 14% · Canada, Vietnam
- Languages at home
- 76% English-only · Spanish 16% Tagalog/Filipino 4% Vietnamese 1%
Political lean MEDSL · Riverside
- 2024 margin
- Toss-up / Even · D 48.0% · R 49.3% · Other 2.6%
- 2008→2024 swing
- -3.6pp toward R · 2008: 2.3pp · 2024: -1.3pp
- All cycles
- 2024: R+1.3 2020: D+8.0 2016: D+4.3 2012: R+0.4 2008: D+2.3
Not yet ingested
- Civics
- —
Market trends
- HPI YoY
- ▲ 12.43%
- Current HPI
- 332.169
- Rent YoY
- ▼ -0.79%
- Metro
- Riverside-San Bernardino-Ontario, CA
- State GDP YoY
- ▲ 3.21%
- F500 in state
- 116
Industry mix (Fortune 500 HQ in CA)
| Industry | F500 HQs | Revenue |
|---|---|---|
| Technology | 27 | $1,492B |
|
||
| Financial Services | 3 | $174B |
|
||
| Retail | 3 | $44B |
|
||
| Insurance | 3 | $26B |
|
||
| Media / Entertainment | 2 | $115B |
|
||
| Pharmaceuticals / Biotech | 2 | $62B |
|
||
Price history
+122.1% since first listed14 events — show timeline
- 2026-04-15 Listed $774,999 CRMLS
- 2009-02-27 Sold (MLS) $280,000 CRMLS
- 2008-12-15 Listing Removed — CRMLS
- 2008-12-09 Listed $274,900 CRMLS
- 2008-12-05 Listing Removed — CRMLS
- 2008-12-02 Price Changed $299,900 CRMLS
- 2008-11-21 Price Changed $309,900 CRMLS
- 2008-11-06 Listed $321,900 CRMLS
- 2008-10-31 Listing Removed — CRMLS
- 2008-09-24 Listed $321,900 CRMLS
- 2008-09-21 Listing Removed — CRMLS
- 2008-09-04 Price Changed $321,900 CRMLS
- 2008-08-07 Price Changed $334,900 CRMLS
- 2008-06-24 Listed $349,000 CRMLS
Property tax history
-0.1%/yrLatest (2025): $5,736 · -0.0% YoY. Source: county tax records.
Cash-flow waterfall
monthlySold comps — $/sqft
last 12 mo · ≤1 miLoading sold comps…