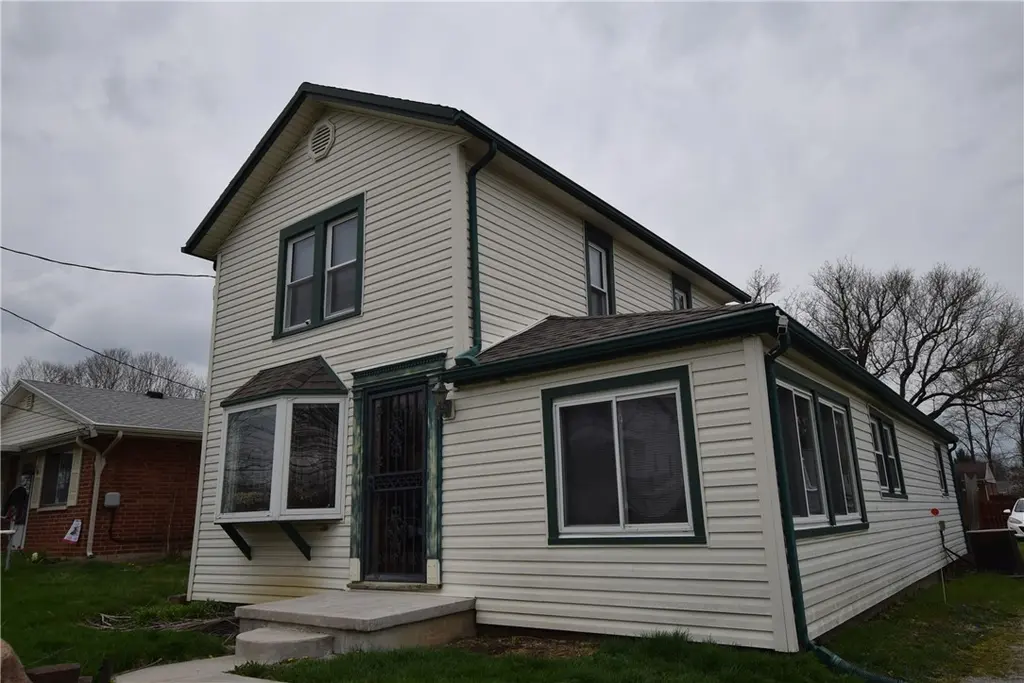
1125 Anderson St · Piqua, OH
Flood risk 1/10 · Minimal
- FEMA flood zone
- X (unshaded)
- Chance of flooding over 30 yrs
- 0.0%
- Est. flood insurance / yr
- $473 – $860
Fire risk 1/10 · Minimal
- Est. fire insurance / yr
- $713 – $1,323
Heat risk 3/10 · Minor
- Hot days now (above 100°F)
- 7 days/yr
- Hot days in 30 yrs
- 18 days/yr
Wind risk 2/10 · Minimal
- Chance of severe wind over 30 yrs
- —
Air-quality risk 2/10 · Minimal
- Unhealthy air days now
- 1 days/yr
- Unhealthy air days in 30 yrs
- 3 days/yr
Risk factors via First Street. Map © Google.
Why this score? — see what drove the C+ grade
The composite is a weighted blend of 9 inputs, each scored 0–100. Each bar is that input's sub-score; the figure is the points it added to the 100-point composite (weight × sub-score).
- Cash flow +23.6/30.0
- ARV discount +15.0/15.0
- DSCR +7.6/10.0
- 1% rule +5.1/10.0
- Schools +4.0/10.0
- Livability +3.1/5.0
- Rent growth +2.5/5.0
- Condition / age +2.5/5.0
- Appreciation +0.0/10.0
$119,900
🖨 Deal sheet (PDF) 📄 Offer letter ✓ Due diligence
Listing remarks MLS
4 bedroom home located in Piqua with a large living room with a bay window. Modern kitchen with Oak cabinetry, built-in oven and patio doors leading to the back deck. 2 bedrooms and full bath with a shower and Jacuzzi tub on the first floor and 2 additional bedrooms on the 2nd floor. Walking distance to Echo Lake and Fountain Park. Needs to be 'as is' conventional or cash offer.
Key facts
- Oak cabinetry
- Patio doors
- Bay window
Tags
Neighborhood map
What this means for you Summary
Snapshot
- This is a 2-bed/1.0-bath single-family listed at $120k.
Deal economics
- At list price, monthly cash flow is $225 ($3k/yr) — positive.
- The deal already cash-flows at list — no discount required.
- Meets the 1% rule at list price ($1k rent vs $120k).
- Recommended offer: $113k (6.0% below list) — sets the bar for market timing.
- Cap rate 8.5% vs local median 4.7% in Piqua — top-decile yield for the area; either an underpriced asset or a hidden risk that comps aren't pricing in. Stress-test before assuming the spread holds.
Location & tenants
- Location reads 62/100 on livability (#887 in OH) — a middle-class / working-renter tenant base. Strengths: cost of living A+, housing A+; Watch: employment D+, crime F, amenities F.
- Piqua City (rural): math 45% / reading 50% proficiency, ranked #482 of 656 in OH (top 74%) — families likely to look elsewhere, expect single-tenant / working-renter base with shorter leases.
- Zoned schools: Piqua High School (math 12% / reading 57%, grade F, #582 of 781 statewide, top 76%, 876 students, 52% FRL) — zoned schools at 52% FRL track the district average.
- Zoned-school proficiency averages 34% at this address vs 48% district-wide (-13 pts) — the specific schools serving this property underperform the Piqua City average; the district grade overstates school quality for this exact location.
- Market conditions: 139 active listings in the ZIP; 9 comparable units currently listed for rent nearby; rentals leasing fast (median 5d on market — plan ~1-2 weeks tenant-placement turnaround); 326 units permitted in Miami County in 2024 (0 in 5+ unit buildings).
Forward outlook
- Local home prices are declining (-3.0%/yr); year-one equity from $829 of loan paydown is wiped out by about $4k of value loss. Plan a longer hold.
Negotiation context
- It's been on market 81 days — a 6% lower offer ($113k) is reasonable based on typical stale-listing flexibility.
- 2 sale attempts; this cycle's ask has dropped $10k (8%) from the opening price — seller is motivated, your offer sets the floor, not the list.
Risks & watch-outs
- Watch-outs: built in 1920 — expect roof / HVAC / electrical / plumbing capex.
Questions for the listing agent
- It's been on market 81 days. Have you received any prior offers? Is the seller open to a 6% concession, seller financing, or rate buy-down credit?
- Built in 1920 — when were the roof, HVAC, electrical panel, plumbing, and water heater last replaced?
- Why hasn't it sold? Are there any deal-killer items the seller is aware of (foundation, flood, title, zoning, code violations)?
- Is there a deadline driving the sale (1031 exchange, divorce, estate, relocation)? That informs how much negotiation room exists.
- Crime grade is F in this area — have there been break-ins, vandalism, or insurance claims at this property in the last 3 years? What carrier currently insures it and at what premium?
- What's the average days-on-market for RENTAL listings here right now (not sales)? A rising rental-DOM trend means longer vacancies and softer asking-rent achievability than the comps imply.
- What's the recent tenant-quality profile in this submarket — average credit score on applications, eviction rate, late-payment / NSF rate, and stable-employment percentage? A property-management company in the area should have these aggregated.
- How much new for-sale + rental construction is in the pipeline within 1–3 miles? Heavy new supply typically softens prices + rents 12–24 months out; constrained supply supports both.
Investment metrics
- 1% rule
- 1.01% ✓
- Cap rate
- 8.55%
- Cash-on-cash
- 8.05%
- DSCR
- 1.36
- GRM
- 8.2
CMA / ARV
- ARV (median comp)
- $174,421
- List price
- $119,900
- Delta
- -31.26%
- Verdict
- UNDERPRICED
- Comps
- 20 within 1.0 mi
Show comp detail 12 sales within ~0.75 mi
| Address | Dist | Beds/Ba | Sqft | Sold | Price | $/sf | Match |
|---|---|---|---|---|---|---|---|
| 618 Cherry St | 0.44mi | 3/1.0 (+1) | 1,314 (-1%) | 2mo | $149,900 | $114 | 71 |
| 802 Washington Ave | 0.45mi | 2/1.0 | 1,209 (-9%) | 0mo | $125,900 | $104 | 64 |
| 1115 Madison Ave | 0.40mi | 3/1.0 (+1) | 1,248 (-6%) | 3mo | $190,000 | $152 | 64 |
| 1307 Walker St | 0.52mi | 2/1.5 | 1,435 (+8%) | 1mo | $218,000 | $152 | 60 |
| 1062 Boone St | 0.53mi | 3/1.5 (+1) | 1,400 (+5%) | 2mo | $200,000 | $143 | 58 |
| 908 Camp St | 0.59mi | 2/1.0 | 1,209 (-9%) | 2mo | $129,000 | $107 | 56 |
| 1417 Madison Ave | 0.40mi | 2/2.0 | 1,182 (-11%) | 6mo | $170,000 | $144 | 54 |
| 505 Scott St | 0.72mi | 2/1.0 | 1,221 (-8%) | 2mo | $75,000 | $61 | 51 |
| 608 Virginia St | 0.72mi | 3/2.0 (+1) | 1,385 (+4%) | 5mo | $145,000 | $105 | 46 |
| 511 Scott St | 0.70mi | 3/2.0 (+1) | 1,428 (+8%) | 5mo | $190,000 | $133 | 42 |
| 735 Park Ave | 0.74mi | 3/1.5 (+1) | 1,154 (-13%) | 2mo | $189,000 | $164 | 35 |
| 1334 Maplewood Dr | 0.66mi | 3/2.0 (+1) | 1,497 (+13%) | 6mo | $231,275 | $154 | 34 |
Match score weights: distance 35% · size 25% · config 20% · recency 20%. Top-matched comps best support the ARV.
Projected returns pro-forma
-3.0% appreciation · 3.0% rent growth · sell at horizon
- IRR
- -4.1%
- Equity multiple
- 0.85×
- Total profit
- $-5,129
- Equity at exit
- $17,877
- IRR
- 5.6%
- Equity multiple
- 1.41×
- Total profit
- $13,832
- Equity at exit
- $10,367
Cash invested: $33,572 (down + closing). Projections, not guarantees.
Landlord ↔ Tenant lean methodology
- Overall (STATE)
- 73 Landlord-Friendly
- State Ohio
- 73 Landlord-Friendly · R+6
- County
- — inherits STATE
- City
- — inherits STATE
ZIP-level market 45356
- Active inventory
- 139
- Price-to-rent
- 8.2×
Monthly cashflow live
- Estimated rent
- $1,211 high interval (Pro) →
- Mortgage (P&I)
- −$629
- Tax from tax record
- −$53 /mo · $635/yr
- Insurance
- −$50
- HOA
- −$0
- Vacancy / Maint / Mgmt
- −$254
- Net cashflow
- $225
Break-even live
Sensitivity live
| Price | -10% $293 | -5% $259 | +0% $225 | +5% $191 | +10% $157 |
|---|---|---|---|---|---|
| Rent | -10% $129 | -5% $177 | +0% $225 | +5% $273 | +10% $321 |
| Rate | -1.0pp $286 | -0.5pp $256 | base $225 | +0.5pp $194 | +1.0pp $162 |
UW: 25.0% down · 7.5% · 30yr · 1.5% tax · 5.0% vac · 8.0% maint · 8.0% mgmt
Financing live
Cash to close
- Down payment
- $29,975
- Closing costs
- $3,597
- Reserves months
- —
- Total cash needed
- —
Loan-product check · same deal, 3 products live
Conventional
25% down · 7.5% · 30yr
- Down + closing
- —
- Monthly P&I
- —
- Monthly cashflow
- —
- DSCR
- —
- Eligible?
- —
Personal DTI + credit; lowest rate.
DSCR
20% down · 8.5% · 30yr
- Down + closing
- —
- Monthly P&I
- —
- Monthly cashflow
- —
- DSCR
- —
- Eligible?
- —
No personal income docs; deal must DSCR.
Hard money
10% down · 12.0% · 12mo
- Down + closing
- —
- Monthly P&I
- —
- Monthly cashflow
- —
- DSCR
- —
- Eligible?
- —
Short-term bridge; refi at stabilization.
Rent comps 9 comps
| Address | Beds | Baths | Sqft | Rent | $/sqft | DOM | Units | Dist |
|---|---|---|---|---|---|---|---|---|
| 715 Walker St Piqua, OH | 3.0 | 2.0 | 1100 | $1,650 | $1.50 | 5d | 1 | 0.79mi |
| 918 W Greene St Piqua, OH | 2.0 | 1.5 | 1270 | $900 | $0.71 | 16d | 1 | 0.79mi |
| 519 Ann St Piqua, OH | 3.0 | 1.0 | 1388 | $1,300 | $0.94 | 4d | 1 | 0.86mi |
| 316 N College St Piqua, OH | 2.0 | 1.0 | 782 | $1,075 | $1.37 | 4d | 3 | 0.98mi |
| 323 Westview Dr Piqua, OH | 2.0 | 1.5 | 1174 | $1,650 | $1.41 | 4d | 1 | 1.07mi |
| 701 N Wayne St Unit 118 Piqua, OH | 2.0 | 1.0 | 944 | $1,095 | $1.16 | 25d | 1 | 1.25mi |
| 521-523 Wood St Piqua, OH | 2.0 | 1.0 | 900 | $950 | $1.06 | 5d | 1 | 1.25mi |
| 628 N Main St Piqua, OH | 1.0 | 1.0 | 914 | $895 | $0.98 | 25d | 1 | 1.30mi |
| 200 E High St Piqua, OH | 3.0 | 1.0 | 1500 | $1,365 | $0.91 | 5d | 1 | 1.49mi |
Listing history 21 events
-
2026-06-21days on market $119,900 Active 81 DOM
-
2026-06-18days on market $119,900 Active 78 DOM
-
2026-06-17days on market $119,900 Active 77 DOM
-
2026-06-16days on market $119,900 Active 76 DOM
-
2026-06-15days on market $119,900 Active 75 DOM
-
2026-06-14days on market $119,900 Active 73 DOM
-
2026-06-13days on market $119,900 Active 72 DOM
-
2026-06-10days on market $119,900 Active 70 DOM
-
2026-06-09days on market $119,900 Active 69 DOM
-
2026-06-08days on market $119,900 Active 68 DOM
-
2026-06-07days on market $119,900 Active 67 DOM
-
2026-06-05days on market $119,900 Active 64 DOM
-
2026-06-03days on market $119,900 Active 63 DOM
-
2026-06-02days on market $119,900 Active 62 DOM
-
2026-06-01days on market $119,900 Active 61 DOM
-
2026-05-31days on market $119,900 Active 60 DOM
-
2026-05-31days on market $119,900 Active 59 DOM
-
2026-05-05price $119,900 381-char remark
Show marketing remark (384 chars)
4 bedroom home located in Piqua with a large living room with a bay window. Modern kitchen with Oak cabinetry, built-in oven and patio doors leading to the back deck. 2 bedrooms and full bath with a shower and Jacuzzi tub on the first floor and 2 additional bedrooms on the 2nd floor. Walking distance to Echo Lake and Fountain Park. Needs to be 'as is' conventional or cash offer.
-
2026-05-05price $119,900 384-char remark
Show marketing remark (384 chars)
4 bedroom home located in Piqua with a large living room with a bay window. Modern kitchen with Oak cabinetry, built-in oven and patio doors leading to the back deck. 2 bedrooms and full bath with a shower and Jacuzzi tub on the first floor and 2 additional bedrooms on the 2nd floor. Walking distance to Echo Lake and Fountain Park. Needs to be 'as is' conventional or cash offer.
-
2026-04-01$129,900 Active 381-char remark
Show marketing remark (384 chars)
4 bedroom home located in Piqua with a large living room with a bay window. Modern kitchen with Oak cabinetry, built-in oven and patio doors leading to the back deck. 2 bedrooms and full bath with a shower and Jacuzzi tub on the first floor and 2 additional bedrooms on the 2nd floor. Walking distance to Echo Lake and Fountain Park. Needs to be 'as is' conventional or cash offer.
-
2026-04-01$129,900 Active 384-char remark
Show marketing remark (384 chars)
4 bedroom home located in Piqua with a large living room with a bay window. Modern kitchen with Oak cabinetry, built-in oven and patio doors leading to the back deck. 2 bedrooms and full bath with a shower and Jacuzzi tub on the first floor and 2 additional bedrooms on the 2nd floor. Walking distance to Echo Lake and Fountain Park. Needs to be 'as is' conventional or cash offer.
ⓘ Source: listings_history table (triggers on properties + properties_extension) + one-shot
backfill from property_details.listing_events for pre-trigger history.
Tax reassessment forecast OH · Partial reset (capped growth)
- Current annual tax
- $635 · $53/mo
- Projected year-2 tax
- $1,253 · $104/mo
- Expected delta
- +$618/yr (+$51/mo · 97.2%)
ⓘ Screening estimate from a state-policy table — verify with the county assessor before closing.
Climate risk First Street
- Flood 1/10 Low FEMA zone X (unshaded) · 0% chance over 30 yrs
- Wildfire 1/10 Low
- Heat 3/10 Moderate 7 d/yr ≥100°F today · 18 d/yr by 30 yrs out
- Wind 2/10 Low
- Air quality 2/10 Low 1 unhealthy d/yr today · 3 by 30 yrs out
Nearby sold comps map
Loading sold comps map…
Walkable amenities ~0.75 mi
Loading nearby amenities…
Taxation est. · year 1
- Rental income
- $14,534
- − Mortgage interest
- −$6,716
- − Property taxes
- −$635
- − Insurance
- −$600
- − Repairs & maintenance
- −$1,163
- − Management
- −$1,163
- − Depreciation
- −$3,488
- Taxable income
- $770
- Est. tax owed @ 24.0%
- −$185
- After-tax cash flow
- $2,517/yr
For passive investors: Depreciation is non-cash, so a rental often shows a tax loss while cash-flowing — sheltering income. Rental losses are passive: they offset passive income freely, and up to $25,000/yr can offset ordinary (W-2) income if you actively participate and your MAGI is under $100k (phasing out to $0 by $150k); unused losses carry forward. On sale, claimed depreciation is recaptured at up to 25%, and gains may owe capital-gains tax (a 1031 exchange can defer both). Figures are a year-1 estimate at your 24.0% rate — not tax advice; consult a CPA.
Schools (NCES district)
- District
- Piqua City
- NCES district ID
- 3904464
- Math proficiency
- 45% ▼ -11.00%
- Reading proficiency
- 50% ▼ -7.00%
- Median HH income
- $41,751
- Composite
- 39.91/100
- National rank
- #3855
- State rank
- #482 of 656 in OH
Livability — Piqua
- Score
- 62/100
- State rank
- #887
- US rank
- #16830
Category grades
Schools grade is shown separately in the Schools card above.
Census & demographics
- Census place
- Piqua, OH
- County
- Miami County · 85,667 people
- City population
- 25,237
- Metro
- Dayton-Kettering, OH
- Population (ZIP)
- 25,237
- Household income
- $69,188
- Rent vs Own
- Severe rent burden
- 748.0
Population outlook (Miami County) Hauer SSP2
- Today (2025)
- 107,816 people
- By 2030
- 108,896 · +1.0%
- By 2040
- 109,581 · +1.6%
- By 2050
- 108,110 · +0.3%
- By 2075
- 101,523 · -5.8%
- By 2100
- 85,787 · -20.4%
Race, ethnicity, and origin ACS 2023
- Neighborhood character
- Predominantly White (92%)
- Race & ethnicity
- White 92% Two or more races 3% Black 2% Hispanic / Latino 1%
- Common ancestry
- Iranian 2% Italian 2% Lithuanian 2%
- Foreign-born
- 1%
- Languages at home
- 99% English-only · Spanish 1% Vietnamese 0%
Political lean MEDSL · Miami
- 2024 margin
- Solid R (+45.1) · D 27.0% · R 72.1%
- 2008→2024 swing
- -16.6pp toward R · 2008: -28.5pp · 2024: -45.1pp
- All cycles
- 2024: R+45.1 2020: R+44.3 2016: R+45.6 2012: R+35.6 2008: R+28.5
Not yet ingested
- Civics
- —
Market trends
- HPI YoY
- ▼ -137.96%
- Current HPI
- 251.435
- Rent YoY
- —
- Metro
- Dayton-Kettering, OH
- State GDP YoY
- ▲ 1.98%
- F500 in state
- 48
Industry mix (Fortune 500 HQ in OH)
| Industry | F500 HQs | Revenue |
|---|---|---|
| Insurance | 3 | $145B |
|
||
| Industrial Machinery | 3 | $49B |
|
||
| Financial Services | 3 | $24B |
|
||
| Consumer Goods | 2 | $93B |
|
||
| Aerospace / Defense | 2 | $47B |
|
||
| Utilities | 2 | $33B |
|
||
Price history
-7.7% since first listed4 events — show timeline
- 2026-05-05 Price Changed $119,900 Dayton MLS
- 2026-05-05 Price Changed $119,900 WRIST
- 2026-04-01 Listed $129,900 WRIST
- 2026-04-01 Listed $129,900 Dayton MLS
Property tax history
-3.7%/yrLatest (2025): $635 · -18.4% YoY. Source: county tax records.
Cash-flow waterfall
monthlySold comps — $/sqft
last 12 mo · ≤1 miLoading sold comps…