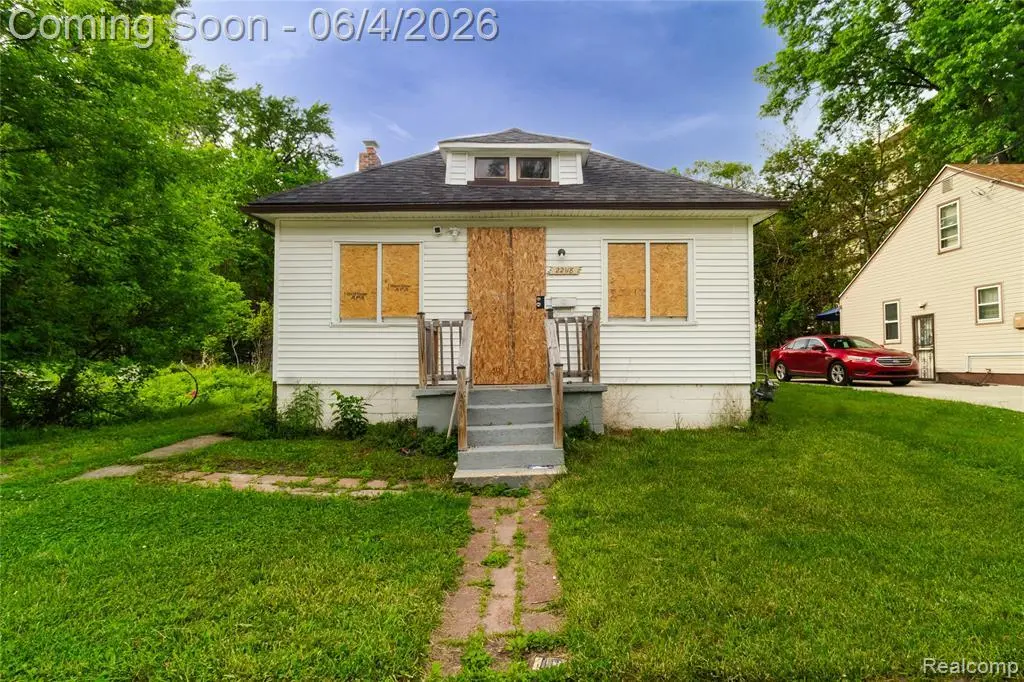
22118 Ulster St · Detroit, MI
Flood risk 4/10 · Minor
- FEMA flood zone
- X (unshaded)
- Chance of flooding over 30 yrs
- 0.22%
- Est. flood insurance / yr
- $473 – $860
Fire risk 1/10 · Minimal
- Est. fire insurance / yr
- $784 – $1,456
Heat risk 3/10 · Minor
- Hot days now (above 98°F)
- 7 days/yr
- Hot days in 30 yrs
- 15 days/yr
Wind risk 2/10 · Minimal
- Chance of severe wind over 30 yrs
- —
Air-quality risk 3/10 · Minor
- Unhealthy air days now
- 2 days/yr
- Unhealthy air days in 30 yrs
- 3 days/yr
Risk factors via First Street. Map © Google.
Why this score? — see what drove the C+ grade
The composite is a weighted blend of 9 inputs, each scored 0–100. Each bar is that input's sub-score; the figure is the points it added to the 100-point composite (weight × sub-score).
- Cash flow +30.0/30.0
- 1% rule +10.0/10.0
- DSCR +10.0/10.0
- Rent growth +4.5/5.0
- Livability +3.7/5.0
- Condition / age +2.5/5.0
- Schools +1.3/10.0
- ARV discount +0.0/15.0
- Appreciation +0.0/10.0
$54,000
🖨 Deal sheet 📄 Offer letter ✓ Due diligence
Listing remarks
Attention investors!! Here is your next acquisition, this property was previously fully updated in 2021, with just a TLC can be ready to move in again (might need paint, new carpet, etc. ). Features 2 bedrooms, bathroom with ceramic tile on walls and flooring, kitchen with wood cabinets and countertop. The property has a rear access for better convenience. Unfinished basement. Rents in the area around the $900 for a property like this one. Ideal for investor looking for a good ROI. Conveniently located in the Riverdale neighborhood, with easy access from McNichols Rd and Grand River Ave, just one block away from Crowell Recreation Center and two minutes away from Meijer supermarket.
Key facts
- 5,663 sq ft lot
- Built 1920
- Listed 15 days
Property features AI
Exterior
- Utilities: Public water; Natural gas; Forced air heating
- Home design: Residential, single-story; Built in 1920; Entry-level living spaces; Below-grade area present (657 below-grade sq. ft.)
- Construction: Vinyl siding; Basement foundation
- Exterior features: Paved street access; Frontage approx. 36 feet
Interior
- Kitchen: Entry-level kitchen (approx. 7 x 10)
- Bedrooms: Two entry-level bedrooms (10 x 10 and 9 x 10)
- Bathrooms: One full bathroom (entry level, approx. 6 x 5)
- Heating & cooling: Forced air heating; Natural gas fuel
- Interior features: 5 total rooms; Unfinished basement
- Laundry & utility: Basement present (unfinished)
Neighborhood map
What this means for you Summary
Snapshot
- This is a 2-bed/1.0-bath single-family listed at $54k.
Deal economics
- At list price, monthly cash flow is $362 ($4k/yr) — positive.
- The deal already cash-flows at list — no discount required.
- Meets the 1% rule at list price ($960 rent vs $54k).
- Recommended offer: $53k (1.5% below list) — sets the bar for market timing.
- Cap rate 14.3% vs local median 10.2% in Detroit — top-decile yield for the area; either an underpriced asset or a hidden risk that comps aren't pricing in. Stress-test before assuming the spread holds.
Location & tenants
- Location reads 73/100 on livability (#218 in MI) — a middle-class / working-renter tenant base. Strengths: amenities A+, commute A+, cost of living A+; Watch: schools F, crime F, employment F.
- Detroit Public Schools Community District (urban): math 10% / reading 24% proficiency, ranked #499 of 540 in MI (top 92%) — low school quality limits family demand, transient renter base, plan for 1-2y turnover; 90% free/reduced lunch — lower-income household profile, screen leases tightly.
- Market conditions: Rents rising fast (+8.0%/yr); 305 active listings in the ZIP; 22 comparable units currently listed for rent nearby; rentals at typical pace (median 24d on market — plan ~3-4 weeks tenant-placement turnaround); lower-income renter base — watch delinquency; 2,639 units permitted in Wayne County in 2024 (1,216 in 5+ unit buildings).
Forward outlook
- Local home prices are declining (-3.0%/yr); year-one equity from $373 of loan paydown is wiped out by about $2k of value loss. Plan a longer hold.
- Wayne County population projected at -17% by 2050 — secular population decline; favor cash flow + early exit over multi-decade hold.
- At projected returns (-3.0% appreciation + 8.0% rent growth), your $15k cash investment doubles in ~4 years — after that, you're playing with house money.
Negotiation context
- It's been on market 15 days — a 2% lower offer ($53k) is reasonable based on typical stale-listing flexibility.
- 2 sale attempts; this cycle's ask has dropped $26k (32%) from the opening price — seller is motivated, your offer sets the floor, not the list.
Risks & watch-outs
- Watch-outs: built in 1920 — expect roof / HVAC / electrical / plumbing capex.
Questions for the listing agent
- Built in 1920 — when were the roof, HVAC, electrical panel, plumbing, and water heater last replaced?
- Is there a deadline driving the sale (1031 exchange, divorce, estate, relocation)? That informs how much negotiation room exists.
- Schools are F-rated, which usually means shorter tenancies and higher turnover. Who's the typical renter profile here, and what's been the actual vacancy rate?
- Crime grade is F in this area — have there been break-ins, vandalism, or insurance claims at this property in the last 3 years? What carrier currently insures it and at what premium?
- What's the average days-on-market for RENTAL listings here right now (not sales)? A rising rental-DOM trend means longer vacancies and softer asking-rent achievability than the comps imply.
- What's the recent tenant-quality profile in this submarket — average credit score on applications, eviction rate, late-payment / NSF rate, and stable-employment percentage? A property-management company in the area should have these aggregated.
- How much new for-sale + rental construction is in the pipeline within 1–3 miles? Heavy new supply typically softens prices + rents 12–24 months out; constrained supply supports both.
Investment metrics
- 1% rule
- 1.78% ✓
- Cap rate
- 14.34%
- Cash-on-cash
- 28.75%
- DSCR
- 2.28
- GRM
- 4.7
CMA / ARV
- ARV (on-the-fly)
- $40,734
- Comps found
- 8
Show comp detail 8 sales within ~0.75 mi
| Address | Dist | Beds/Ba | Sqft | Sold | Price | $/sf | Match |
|---|---|---|---|---|---|---|---|
| 16816 Lamphere St | 0.23mi | 2/1.0 | 732 (+11%) | 3mo | $54,000 | $74 | 68 |
| 15341 Bramell St | 0.69mi | 2/1.0 | 644 (-2%) | 7mo | $12,000 | $19 | 58 |
| 16746 Bramell St | 0.28mi | 2/1.0 | 755 (+15%) | 7mo | $30,000 | $40 | 57 |
| 17185 Bentler St | 0.52mi | 2/1.0 | 690 (+5%) | 13mo | $43,000 | $62 | 56 |
| 15777 Chatham | 0.39mi | 2/1.0 | 696 (+6%) | 21mo | $10,000 | $14 | 54 |
| 16105 Chatham St | 0.28mi | 3/1.0 (+1) | 704 (+7%) | 21mo | $35,000 | $50 | 52 |
| 15853 Beaverland St | 0.43mi | 3/1.0 (+1) | 727 (+11%) | 12mo | $60,000 | $83 | 47 |
| 22503 Argus | 0.41mi | 2/1.0 | 744 (+13%) | 21mo | $62,500 | $84 | 41 |
Match score weights: distance 35% · size 25% · config 20% · recency 20%. Top-matched comps best support the ARV.
Projected returns pro-forma
-3.0% appreciation · 8.0% rent growth · sell at horizon
- IRR
- 28.8%
- Equity multiple
- 2.28×
- Total profit
- $19,423
- Equity at exit
- $8,052
- IRR
- 39.1%
- Equity multiple
- 5.62×
- Total profit
- $69,819
- Equity at exit
- $4,669
Cash invested: $15,120 (down + closing). Projections, not guarantees.
Landlord ↔ Tenant lean methodology
- Overall (STATE)
- 62 Landlord-Friendly
- State Michigan
- 62 Landlord-Friendly · EVEN
- County
- — inherits STATE
- City
- — inherits STATE
ZIP-level market 48219
- Home prices YoY
- -10.3%
- Rents YoY
- 8.0%
- Active inventory
- 305
- Price-to-rent
- 4.7×
Monthly cashflow live
- Estimated rent
- $960 high interval (Pro) →
- Mortgage (P&I)
- −$283
- Tax from tax record
- −$90 /mo · $1,081/yr
- Insurance
- −$22
- HOA
- −$0
- Vacancy / Maint / Mgmt
- −$201
- Net cashflow
- $362
Break-even live
UW: 25.0% down · 7.5% · 30yr · 1.5% tax · 5.0% vac · 8.0% maint · 8.0% mgmt
Financing live
Cash to close
- Down payment
- $13,500
- Closing costs
- $1,620
- Reserves months
- —
- Total cash needed
- —
Loan-product check · same deal, 3 products live
Conventional
25% down · 7.5% · 30yr
- Down + closing
- —
- Monthly P&I
- —
- Monthly cashflow
- —
- DSCR
- —
- Eligible?
- —
Personal DTI + credit; lowest rate.
DSCR
20% down · 8.5% · 30yr
- Down + closing
- —
- Monthly P&I
- —
- Monthly cashflow
- —
- DSCR
- —
- Eligible?
- —
No personal income docs; deal must DSCR.
Hard money
10% down · 12.0% · 12mo
- Down + closing
- —
- Monthly P&I
- —
- Monthly cashflow
- —
- DSCR
- —
- Eligible?
- —
Short-term bridge; refi at stabilization.
Rent comps 22 comps
| Address | Beds | Baths | Sqft | Rent | $/sqft | DOM | Units | Dist |
|---|---|---|---|---|---|---|---|---|
| 16700 Lahser Rd Apt 18 Detroit, MI | 2.0 | 1.0 | 750 | $900 | $1.20 | 43d | 1 | 0.18mi |
| 16854 Lahser Rd Detroit, MI | 1.0 | 1.0 | 680 | $885 | $1.30 | 12d | 1 | 0.29mi |
| 16885 Lahser Rd Apt 3A Detroit, MI | 1.0 | 1.0 | 700 | $750 | $1.07 | 43d | 1 | 0.30mi |
| 16885 Lahser Rd Unit 1A Detroit, MI | 1.0 | 1.0 | 650 | $750 | $1.15 | 5d | 1 | 0.31mi |
| 17274 Bentler St Detroit, MI | 2.0 | 1.0 | 700 | $850 | $1.21 | 43d | 2 | 0.63mi |
| 17274 Bentler St Detroit, MI | 2.0 | 1.0 | 700 | $838 | $1.20 | 24d | 2 | 0.63mi |
| 17274 Bentler St #46 Detroit, MI | 2.0 | 1.0 | 700 | $850 | $1.21 | 16d | 1 | 0.63mi |
| 17270 Bentler St Detroit, MI | 2.0 | 1.0 | 650 | $850 | $1.31 | 43d | 1 | 0.63mi |
| 17644 Lahser Rd Unit 7 Detroit, MI | 1.0 | 1.0 | 600 | $995 | $1.66 | 24d | 1 | 0.72mi |
| 18045 Lahser Rd Detroit, MI | 1.0 | 1.0 | 670 | $960 | $1.43 | 5d | 2 | 0.77mi |
| 24244 Dale St Unit 211 Detroit, MI | 1.0 | 1.0 | 550 | $800 | $1.45 | 24d | 1 | 0.80mi |
| 18025 Bentler St Detroit, MI | 3.0 | 1.0 | 728 | $1,250 | $1.72 | 24d | 1 | 0.83mi |
| 16194 Fielding St Unit 2 Detroit, MI | 2.0 | 1.0 | 750 | $950 | $1.27 | 15d | 1 | 0.88mi |
| 18350 Lahser Rd Detroit, MI | 1.0 | 1.0 | 600 | $950 | $1.58 | 43d | 1 | 0.93mi |
| 18400 Lahser Rd Detroit, MI | 1.0 | 1.0 | 620 | $950 | $1.53 | 24d | 1 | 0.97mi |
| 18450 Lahser Rd Apt 1 Detroit, MI | 1.0 | 1.0 | 650 | $820 | $1.26 | 5d | 1 | 1.00mi |
| 16581 Wormer St Detroit, MI | 2.0 | 1.0 | 720 | $1,100 | $1.53 | 43d | 1 | 1.01mi |
| 24235 W McNichols Rd Detroit, MI | 1.0 | 1.0 | 700 | $800 | $1.14 | 43d | 4 | 1.02mi |
| 18274 Fielding St Detroit, MI | 2.0 | 1.0 | 700 | $1,200 | $1.71 | 16d | 1 | 1.27mi |
| 24651 W McNichols Rd Detroit, MI | 1.0 | 1.0 | 700 | $800 | $1.14 | 43d | 4 | 1.29mi |
| 15143 Evergreen Rd Detroit, MI | 2.0 | 1.0 | 653 | $875 | $1.34 | 21d | 1 | 1.33mi |
| 15143 Evergreen Rd Detroit, MI | 2.0 | 1.0 | 653 | $875 | $1.34 | 24d | 1 | 1.33mi |
Listing history 13 events
-
2026-06-18days on market $54,000 Active 15 DOM
-
2026-06-17days on market $54,000 Active 14 DOM
-
2026-06-16days on market $54,000 Active 13 DOM
-
2026-06-15days on market $54,000 Active 12 DOM
-
2026-06-13days on market $54,000 Active 10 DOM
-
2026-06-13days on market $54,000 Active 9 DOM
-
2026-06-09days on market $54,000 Active 6 DOM
-
2026-06-08days on market $54,000 Active 5 DOM
-
2026-06-07days on market $54,000 Active 4 DOM
-
2026-06-04statusdays on market $54,000 Active 1 DOM
-
2026-06-03days on market $54,000 Coming Soon 2 DOM
-
2026-06-02remarks 691-char remark
-
2026-06-02$54,000 Coming Soon 1 DOM
ⓘ Source: listings_history table (triggers on properties + properties_extension) + one-shot
backfill from property_details.listing_events for pre-trigger history.
Tax reassessment forecast MI · Partial reset (capped growth)
- Current annual tax
- $1,081 · $90/mo
- Projected year-2 tax
- $1,081 · $90/mo
- Expected delta
- $0/yr ($0/mo · 0.0%)
ⓘ Screening estimate from a state-policy table — verify with the county assessor before closing.
Climate risk First Street
- Flood 4/10 Moderate FEMA zone X (unshaded) · 22% chance over 30 yrs
- Wildfire 1/10 Low
- Heat 3/10 Moderate 7 d/yr ≥98°F today · 15 d/yr by 30 yrs out
- Wind 2/10 Low
- Air quality 3/10 Moderate 2 unhealthy d/yr today · 3 by 30 yrs out
Nearby sold comps map
Loading sold comps map…
Walkable amenities ~0.75 mi
Loading nearby amenities…
Taxation est. · year 1
- Rental income
- $11,514
- − Mortgage interest
- −$3,025
- − Property taxes
- −$1,081
- − Insurance
- −$270
- − Repairs & maintenance
- −$921
- − Management
- −$921
- − Depreciation
- −$1,571
- Taxable income
- $3,726
- Est. tax owed @ 24.0%
- −$894
- After-tax cash flow
- $3,453/yr
For passive investors: Depreciation is non-cash, so a rental often shows a tax loss while cash-flowing — sheltering income. Rental losses are passive: they offset passive income freely, and up to $25,000/yr can offset ordinary (W-2) income if you actively participate and your MAGI is under $100k (phasing out to $0 by $150k); unused losses carry forward. On sale, claimed depreciation is recaptured at up to 25%, and gains may owe capital-gains tax (a 1031 exchange can defer both). Figures are a year-1 estimate at your 24.0% rate — not tax advice; consult a CPA.
Schools (NCES district)
- District
- Detroit Public Schools Community District
- NCES district ID
- 2601103
- Math proficiency
- 10% ▼ -2.00%
- Reading proficiency
- 24% ▲ 6.00%
- Median HH income
- $25,815
- Composite
- 13.06/100
- National rank
- #9564
- State rank
- #499 of 540 in MI
Livability — Detroit
- Score
- 73/100
- State rank
- #218
- US rank
- #5427
Category grades
Schools grade is shown separately in the Schools card above.
Census & demographics
- Census place
- Detroit, MI
- County
- Wayne County · 1,562,939 people
- City population
- 572,865
- Metro
- Detroit-Warren-Dearborn, MI
- Population (ZIP)
- 47,208
- Household income
- $43,655
- Rent vs Own
- Severe rent burden
- 3584.0
Population outlook (Wayne County) Hauer SSP2
- Today (2025)
- 1,675,273 people
- By 2030
- 1,620,300 · -3.3%
- By 2040
- 1,502,341 · -10.3%
- By 2050
- 1,384,039 · -17.4%
- By 2075
- 1,124,592 · -32.9%
- By 2100
- 881,193 · -47.4%
Race, ethnicity, and origin ACS 2023
- Neighborhood character
- Predominantly Black (88%)
- Race & ethnicity
- Black 88% White 5% Two or more races 4% Hispanic / Latino 1%
- Common ancestry
- Romanian 1% Lithuanian 1%
- Foreign-born
- 2% · Canada
- Languages at home
- 96% English-only · Spanish 1% French/Haitian/Cajun 1%
Political lean MEDSL · Wayne
- 2024 margin
- Strong D (+29.0) · D 62.7% · R 33.7% · Other 3.6%
- 2008→2024 swing
- -20.5pp toward R · 2008: 49.5pp · 2024: 29.0pp
- All cycles
- 2024: D+29.0 2020: D+38.1 2016: D+37.3 2012: D+46.9 2008: D+49.5
Not yet ingested
- Civics
- —
Market trends
- HPI YoY
- ▼ -65.06%
- Current HPI
- 563.3263
- Rent YoY
- ▲ 8.04%
- Metro
- Detroit-Warren-Dearborn, MI
- State GDP YoY
- ▲ 1.37%
- F500 in state
- 28
Industry mix (Fortune 500 HQ in MI)
| Industry | F500 HQs | Revenue |
|---|---|---|
| Automotive Parts | 3 | $48B |
|
||
| Automotive | 2 | $372B |
|
||
| Chemicals | 1 | $45B |
|
||
| Automotive Retail | 1 | $29B |
|
||
| Healthcare / Medical Devices | 1 | $23B |
|
||
| Automotive Technology | 1 | $20B |
|
||
Price history
-18.1% since first listed6 events — show timeline
- 2026-06-02 Coming Soon $54,000 MiRealSource-MiMLS
- 2025-10-01 Listing Removed — MiRealSource-MiMLS
- 2025-10-01 Listing Removed — REALCOMP
- 2025-04-18 Listed $80,000 MiRealSource-MiMLS
- 2025-04-18 Listed $80,000 REALCOMP
- 2021-03-16 Sold (Public Records) $65,900 Public Records
Property tax history
+3.6%/yrLatest (2025): $1,081 · -8.5% YoY. Source: county tax records.
Cash-flow waterfall
monthlySold comps — $/sqft
last 12 mo · ≤1 miLoading sold comps…