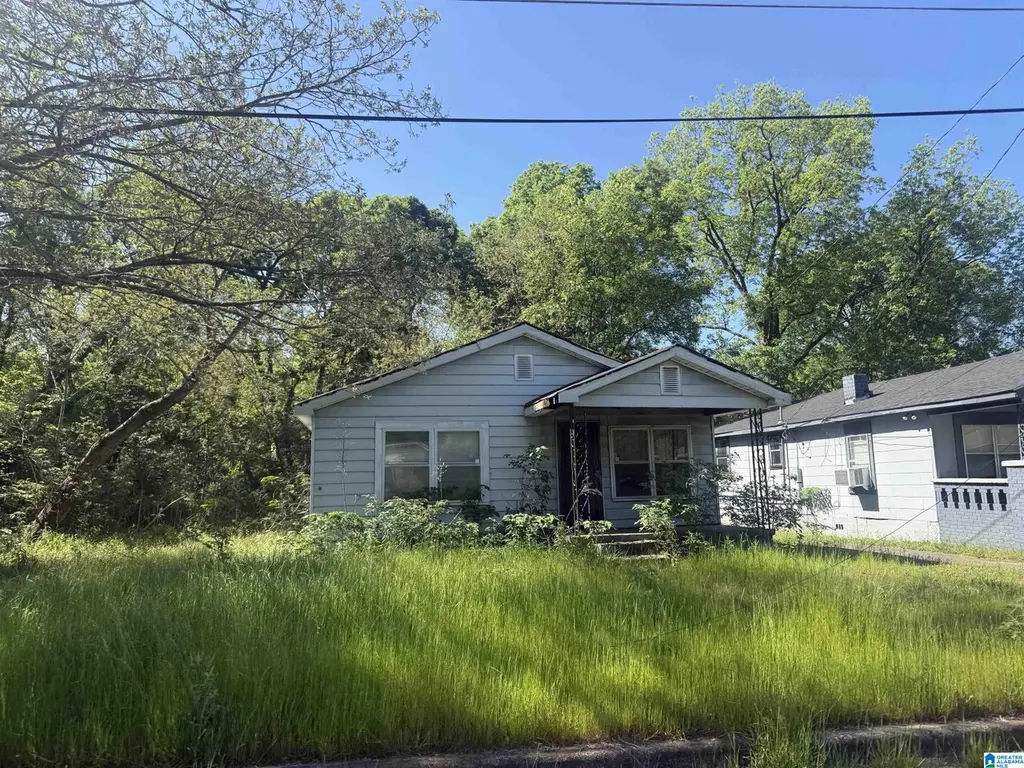
3725 44th Ave N · Birmingham, AL
Flood risk 1/10 · Minimal
- FEMA flood zone
- X (unshaded)
- Chance of flooding over 30 yrs
- 0.0%
- Est. flood insurance / yr
- $507 – $1,088
Fire risk 3/10 · Minor
- Est. fire insurance / yr
- $916 – $1,700
Heat risk 6/10 · Moderate
- Hot days now (above 106°F)
- 7 days/yr
- Hot days in 30 yrs
- 20 days/yr
Wind risk 6/10 · Moderate
- Chance of severe wind over 30 yrs
- 27.0%
Air-quality risk 5/10 · Moderate
- Unhealthy air days now
- 9 days/yr
- Unhealthy air days in 30 yrs
- 10 days/yr
Risk factors via First Street. Map © Google.
Why this score? — see what drove the A- grade
The composite is a weighted blend of 9 inputs, each scored 0–100. Each bar is that input's sub-score; the figure is the points it added to the 100-point composite (weight × sub-score).
- Cash flow +30.0/30.0
- ARV discount +15.0/15.0
- 1% rule +10.0/10.0
- DSCR +10.0/10.0
- Appreciation +10.0/10.0
- Livability +3.4/5.0
- Rent growth +2.5/5.0
- Condition / age +2.5/5.0
- Schools +0.9/10.0
$35,000
🖨 Deal sheet (PDF) 📄 Offer letter ✓ Due diligence
Listing remarks
Opportunity awaits with this investment property full of potential! This home is in need of repairs and updates, making it an ideal project for investors, flippers, or buyers looking to customize a property to their vision (CREATIVE OFFERS WILL NOT BE CONSIDERED). With the right improvements, this property could be transformed into a great income-producing asset or resale opportunity. Situated on a spacious lot, there’s plenty of room to reimagine the layout and maximize value. Conveniently located near local amenities, this is your chance to bring new life to a property and capitalize on its possibilities. Being sold as-is.
Key facts
- 5,662 sq ft lot
- Built 1957
- Listed 61 days
Property features AI
Finance
- Financial info: Down payment assistance available
- HOA & community: No association fees
Exterior
- Parking: Driveway parking; On-street parking
- Security: No security features reported
- Utilities: Public water; Connected sewer; Internet service availability unknown
- Home design: Existing construction; Single-story (all main level rooms listed); Siding (other)
- Construction: Slab foundation
- Exterior features: Front porch
Interior
- Kitchen: Kitchen on main level
- Bedrooms: Three bedrooms, all on the main level
- Flooring: Subflooring
- Bathrooms: One full bathroom with tub/shower combo
- Heating & cooling: No heat; No air conditioning
- Interior features: Ceilings: Other (see remarks); No interior special features reported
- Laundry & utility: No laundry details provided
Neighborhood map
What this means for you Summary
Snapshot
- This is a 2-bed/1.0-bath single-family listed at $35k.
Deal economics
- At list price, monthly cash flow is $520 ($6k/yr) — positive.
- The deal already cash-flows at list — no discount required.
- Meets the 1% rule at list price ($973 rent vs $35k).
- Recommended offer: $33k (6.0% below list) — sets the bar for market timing.
- Cap rate 24.1% vs local median 6.2% in Birmingham — top-decile yield for the area; either an underpriced asset or a hidden risk that comps aren't pricing in. Stress-test before assuming the spread holds.
Location & tenants
- Location reads 67/100 on livability (#78 in AL) — a middle-class / working-renter tenant base. Strengths: commute A+, cost of living A+, housing A+; Watch: amenities C-, crime F, employment F.
- Birmingham City (urban): math 4% / reading 20% proficiency, ranked #116 of 129 in AL (top 90%) — low school quality limits family demand, transient renter base, plan for 1-2y turnover; 82% free/reduced lunch — lower-income household profile, screen leases tightly.
- Zoned schools: Inglenook School (math 2% / reading 8%, grade F, #618 of 627 statewide, top 100%, 333 students, 91% FRL).
- Market conditions: 45 active listings in the ZIP; 26 comparable units currently listed for rent nearby; rentals lingering (median 46d on market — plan ~5-8 weeks vacancy on turnover, expect pricing pressure); 58% of comp listings sitting > 30 days — soft ceiling on asking rent; 2,114 units permitted in Jefferson County in 2024 (556 in 5+ unit buildings).
Forward outlook
- In year one you build about $4k of equity ($242 loan paydown + $4k appreciation (10.0% local appreciation)).
- Jefferson County population projected to shrink 4% by 2050 — rents likely to lag national; underwrite the cash flow, not the appreciation.
- At projected returns (10.0% appreciation + 3.0% rent growth), your $10k cash investment doubles in ~1 year — after that, you're playing with house money.
- By year 8, paydown + projected appreciation supports a ~$33k cash-out refi (75% LTV) — recoverable capital for the next deal without selling this one.
Negotiation context
- It's been on market 61 days — a 6% lower offer ($33k) is reasonable based on typical stale-listing flexibility.
Risks & watch-outs
- Watch-outs: built in 1957 — expect roof / HVAC / electrical / plumbing capex.
- Climate carrying-cost: major wind risk, 27% chance of damaging wind over 30y; extreme-heat days projected 7→20/yr by 2055 (HVAC capex compounding) — expect insurance premiums to compound above CPI over the hold.
Questions for the listing agent
- It's been on market 61 days. Have you received any prior offers? Is the seller open to a 6% concession, seller financing, or rate buy-down credit?
- Built in 1957 — when were the roof, HVAC, electrical panel, plumbing, and water heater last replaced?
- Why hasn't it sold? Are there any deal-killer items the seller is aware of (foundation, flood, title, zoning, code violations)?
- Is there a deadline driving the sale (1031 exchange, divorce, estate, relocation)? That informs how much negotiation room exists.
- Schools are F-rated, which usually means shorter tenancies and higher turnover. Who's the typical renter profile here, and what's been the actual vacancy rate?
- Crime grade is F in this area — have there been break-ins, vandalism, or insurance claims at this property in the last 3 years? What carrier currently insures it and at what premium?
- What's the average days-on-market for RENTAL listings here right now (not sales)? A rising rental-DOM trend means longer vacancies and softer asking-rent achievability than the comps imply.
- What's the recent tenant-quality profile in this submarket — average credit score on applications, eviction rate, late-payment / NSF rate, and stable-employment percentage? A property-management company in the area should have these aggregated.
- How much new for-sale + rental construction is in the pipeline within 1–3 miles? Heavy new supply typically softens prices + rents 12–24 months out; constrained supply supports both.
Investment metrics
- 1% rule
- 2.78% ✓
- Cap rate
- 24.13%
- Cash-on-cash
- 63.70%
- DSCR
- 3.83
- GRM
- 3.0
CMA / ARV
- ARV (median comp)
- $46,614
- List price
- $35,000
- Delta
- -24.92%
- Verdict
- UNDERPRICED
- Comps
- 20 within 1.0 mi
Show comp detail 9 sales within ~0.75 mi
| Address | Dist | Beds/Ba | Sqft | Sold | Price | $/sf | Match |
|---|---|---|---|---|---|---|---|
| 3708 42nd Ave N | 0.10mi | 3/1.0 (+1) | 876 (+6%) | 13mo | $54,900 | $63 | 69 |
| 3459 35th Ave N | 0.57mi | 2/1.0 | 864 (+5%) | 1mo | $60,000 | $69 | 65 |
| 226 Jefferson Blvd | 0.29mi | 1/1.0 (-1) | 910 (+10%) | 16mo | $22,000 | $24 | 51 |
| 1316 Spring St | 0.51mi | 2/1.0 | 920 (+11%) | 8mo | $34,000 | $37 | 50 |
| 4541 40th Pl | 0.70mi | 3/1.0 (+1) | 860 (+4%) | 24mo | $75,000 | $87 | 36 |
| 4503 40th Pl N | 0.68mi | 2/1.0 | 728 (-12%) | 18mo | $40,000 | $55 | 34 |
| 4509 40th Pl N | 0.68mi | 2/1.0 | 728 (-12%) | 18mo | $40,000 | $55 | 34 |
| 3912 39th Ave N | 0.69mi | 1/1.0 (-1) | 763 (-8%) | 20mo | $32,000 | $42 | 34 |
| 4521 40th Pl N | 0.69mi | 2/1.0 | 728 (-12%) | 18mo | $40,000 | $55 | 34 |
Match score weights: distance 35% · size 25% · config 20% · recency 20%. Top-matched comps best support the ARV.
Projected returns pro-forma
10.0% appreciation · 3.0% rent growth · sell at horizon
- IRR
- 75.4%
- Equity multiple
- 6.33×
- Total profit
- $52,214
- Equity at exit
- $31,531
- IRR
- 69.4%
- Equity multiple
- 14.03×
- Total profit
- $127,742
- Equity at exit
- $67,997
Cash invested: $9,800 (down + closing). Projections, not guarantees.
Landlord ↔ Tenant lean methodology
- Overall (STATE)
- 90 Strongly Landlord-Friendly
- State Alabama
- 90 Strongly Landlord-Friendly · R+15
- County
- — inherits STATE
- City
- — inherits STATE
ZIP-level market 35207
- Home prices YoY
- 18.7%
- Active inventory
- 45
- Price-to-rent
- 3.0×
Monthly cashflow live
- Estimated rent
- $973 high interval (Pro) →
- Mortgage (P&I)
- −$184
- Tax from tax record
- −$50 /mo · $605/yr
- Insurance
- −$15
- HOA
- −$0
- Lot rent
- −$0
- Vacancy / Maint / Mgmt
- −$204
- Net cashflow
- $520
Break-even live
Sensitivity live
| Price | -10% $540 | -5% $530 | +0% $520 | +5% $510 | +10% $500 |
|---|---|---|---|---|---|
| Rent | -10% $443 | -5% $482 | +0% $520 | +5% $559 | +10% $597 |
| Rate | -1.0pp $538 | -0.5pp $529 | base $520 | +0.5pp $511 | +1.0pp $502 |
UW: 25.0% down · 7.5% · 30yr · 1.5% tax · 5.0% vac · 8.0% maint · 8.0% mgmt
Financing live
Cash to close
- Down payment
- $8,750
- Closing costs
- $1,050
- Reserves months
- —
- Total cash needed
- —
Loan-product check · same deal, 3 products live
Conventional
25% down · 7.5% · 30yr
- Down + closing
- —
- Monthly P&I
- —
- Monthly cashflow
- —
- DSCR
- —
- Eligible?
- —
Personal DTI + credit; lowest rate.
DSCR
20% down · 8.5% · 30yr
- Down + closing
- —
- Monthly P&I
- —
- Monthly cashflow
- —
- DSCR
- —
- Eligible?
- —
No personal income docs; deal must DSCR.
Hard money
10% down · 12.0% · 12mo
- Down + closing
- —
- Monthly P&I
- —
- Monthly cashflow
- —
- DSCR
- —
- Eligible?
- —
Short-term bridge; refi at stabilization.
Rent comps 26 comps
| Address | Beds | Baths | Sqft | Rent | $/sqft | DOM | Units | Dist |
|---|---|---|---|---|---|---|---|---|
| 3708 42nd Ave N Birmingham, AL | 3.0 | 1.0 | 876 | $950 | $1.08 | 46d | 1 | 0.07mi |
| 4316 Gadsden St Birmingham, AL | 2.0 | 1.0 | 1048 | $1,100 | $1.05 | 5d | 1 | 0.31mi |
| 4244 Jackson St Birmingham, AL | 3.0 | 1.0 | 858 | $1,100 | $1.28 | 46d | 1 | 0.50mi |
| 1316 Spring St Birmingham, AL | 2.0 | 1.0 | 920 | $1,195 | $1.30 | 5d | 1 | 0.53mi |
| 3376 34th Ave N Birmingham, AL | 3.0 | 2.0 | 928 | $1,200 | $1.29 | 5d | 1 | 0.67mi |
| 3944 40th St N Unit A Birmingham, AL | 2.0 | 1.0 | 625 | $699 | $1.12 | 4d | 1 | 0.70mi |
| 3944 40th St N Unit A Birmingham, AL | 2.0 | 1.0 | 625 | $675 | $1.08 | 46d | 1 | 0.70mi |
| 4549 40th Pl N Birmingham, AL | 2.0 | 1.0 | 728 | $850 | $1.17 | 46d | 1 | 0.71mi |
| 3376 34th St N Birmingham, AL | 3.0 | 1.0 | 928 | $1,200 | $1.29 | 14d | 1 | 0.74mi |
| 3376 34th St N Birmingham, AL | 3.0 | 2.0 | 928 | $1,200 | $1.29 | 26d | 1 | 0.74mi |
| 3373 33rd Pl N Birmingham, AL | 3.0 | 1.0 | 912 | $1,150 | $1.26 | 5d | 1 | 0.77mi |
| 821 Overton Ave Unit B Birmingham, AL | 2.0 | 1.0 | 650 | $625 | $0.96 | 46d | 1 | 0.79mi |
| 4101 50th Ave N Unit B Birmingham, AL | 2.0 | 1.0 | 850 | $900 | $1.06 | 46d | 1 | 0.86mi |
| 4220 40th Ct N Birmingham, AL | 3.0 | 1.0 | 948 | $1,200 | $1.27 | 46d | 1 | 0.99mi |
| 4208 50th Ave N Birmingham, AL | 3.0 | 1.0 | 1104 | $1,200 | $1.09 | 46d | 1 | 1.00mi |
| 4236 39th Ave N Birmingham, AL | 3.0 | 2.0 | 1000 | $1,195 | $1.20 | 26d | 1 | 1.07mi |
| 4317 41st Ave N Birmingham, AL | 3.0 | 1.0 | 864 | $1,000 | $1.16 | 46d | 1 | 1.09mi |
| 1224 Maple St Birmingham, AL | 2.0 | 1.0 | 812 | $690 | $0.85 | 21d | 1 | 1.10mi |
| 1233 Elm Ave Unit a Birmingham, AL | 1.0 | 1.0 | 580 | $703 | $1.21 | 4d | 1 | 1.17mi |
| 1120 Hall St Birmingham, AL | 2.0 | 1.0 | 887 | $775 | $0.87 | 46d | 1 | 1.18mi |
| 1116 Hall St Birmingham, AL | 2.0 | 1.0 | 887 | $775 | $0.87 | 46d | 1 | 1.19mi |
| 3016 33rd Ct N Birmingham, AL | 3.0 | 1.0 | 1012 | $1,100 | $1.09 | 46d | 1 | 1.24mi |
| 1113 Elm Ave Unit c Birmingham, AL | 2.0 | 1.0 | 800 | $749 | $0.94 | 46d | 1 | 1.26mi |
| 1045 Waverly St Birmingham, AL | 3.0 | 1.0 | 1014 | $1,000 | $0.99 | 46d | 1 | 1.34mi |
| 1137 Sloan Ave Birmingham, AL | 2.0 | 1.0 | 750 | $750 | $1.00 | 17d | 1 | 1.43mi |
| 1415 Virginia St Birmingham, AL | 2.0 | 1.0 | 781 | $650 | $0.83 | 46d | 1 | 1.50mi |
Listing history 21 events
-
2026-06-22days on market $35,000 Active 61 DOM
-
2026-06-21days on market $35,000 Active 60 DOM
-
2026-06-19remarks 632-char remark
-
2026-06-18price $35,000 Active 57 DOM
-
2026-06-18days on market $40,000 Active 57 DOM
-
2026-06-17days on market $40,000 Active 56 DOM
-
2026-06-16days on market $40,000 Active 55 DOM
-
2026-06-15days on market $40,000 Active 54 DOM
-
2026-06-13days on market $40,000 Active 52 DOM
-
2026-06-10days on market $40,000 Active 49 DOM
-
2026-06-09days on market $40,000 Active 48 DOM
-
2026-06-08days on market $40,000 Active 47 DOM
-
2026-06-07days on market $40,000 Active 46 DOM
-
2026-06-03days on market $40,000 Active 42 DOM
-
2026-06-02days on market $40,000 Active 41 DOM
-
2026-06-01days on market $40,000 Active 40 DOM
-
2026-05-31days on market $40,000 Active 39 DOM
-
2026-04-22$40,000 Active 597-char remark
-
2024-05-22price $24,900
-
2024-04-08price $29,900
-
2023-12-05price $36,900
ⓘ Source: listings_history table (triggers on properties + properties_extension) + one-shot
backfill from property_details.listing_events for pre-trigger history.
Tax reassessment forecast AL · Resets to sale price
- Current annual tax
- $605 · $50/mo
- Projected year-2 tax
- $605 · $50/mo
- Expected delta
- $0/yr ($0/mo · 0.0%)
ⓘ Screening estimate from a state-policy table — verify with the county assessor before closing.
Climate risk First Street
- Flood 1/10 Low FEMA zone X (unshaded) · 0% chance over 30 yrs
- Wildfire 3/10 Moderate
- Heat 6/10 Major 7 d/yr ≥106°F today · 20 d/yr by 30 yrs out
- Wind 6/10 Major 27% chance of damaging wind over 30 yrs
- Air quality 5/10 Major 9 unhealthy d/yr today · 10 by 30 yrs out
Nearby sold comps map
Loading sold comps map…
Walkable amenities ~0.75 mi
Loading nearby amenities…
Taxation est. · year 1
- Rental income
- $11,677
- − Mortgage interest
- −$1,961
- − Property taxes
- −$605
- − Insurance
- −$175
- − Repairs & maintenance
- −$934
- − Management
- −$934
- − Depreciation
- −$1,018
- Taxable income
- $6,050
- Est. tax owed @ 24.0%
- −$1,452
- After-tax cash flow
- $4,791/yr
For passive investors: Depreciation is non-cash, so a rental often shows a tax loss while cash-flowing — sheltering income. Rental losses are passive: they offset passive income freely, and up to $25,000/yr can offset ordinary (W-2) income if you actively participate and your MAGI is under $100k (phasing out to $0 by $150k); unused losses carry forward. On sale, claimed depreciation is recaptured at up to 25%, and gains may owe capital-gains tax (a 1031 exchange can defer both). Figures are a year-1 estimate at your 24.0% rate — not tax advice; consult a CPA.
Schools (NCES district)
- District
- Birmingham City
- NCES district ID
- 0100390
- Math proficiency
- 4% ▼ -17.00%
- Reading proficiency
- 20% ▼ -4.00%
- Median HH income
- $31,988
- Composite
- 9.49/100
- National rank
- #9850
- State rank
- #116 of 129 in AL
Livability — Birmingham
- Score
- 67/100
- State rank
- #78
- US rank
- #10412
Category grades
Schools grade is shown separately in the Schools card above.
Census & demographics
- Census place
- Birmingham, AL
- City population
- 210,422
- Population (ZIP)
- 6,824
Population outlook (Jefferson County) Hauer SSP2
- Today (2025)
- 669,185 people
- By 2030
- 669,694 · +0.1%
- By 2040
- 661,388 · -1.2%
- By 2050
- 643,086 · -3.9%
- By 2075
- 577,267 · -13.7%
- By 2100
- 474,758 · -29.1%
Race, ethnicity, and origin ACS 2023
- Neighborhood character
- Predominantly Black (86%)
- Race & ethnicity
- Black 86% White 7% Hispanic / Latino 6%
- Hispanic origin (detail)
- Mexican 5%
- Common ancestry
- Romanian 1% Hispanic 1%
- Foreign-born
- 3% · Canada
- Languages at home
- 92% English-only · Spanish 6% French/Haitian/Cajun 1%
Political lean MEDSL · Jefferson
- 2024 margin
- D (+10.4) · D 54.6% · R 44.2% · Other 1.2%
- 2008→2024 swing
- +5.4pp toward D · 2008: 5.1pp · 2024: 10.4pp
- All cycles
- 2024: D+10.4 2020: D+13.2 2016: D+7.2 2012: D+6.0 2008: D+5.1
Not yet ingested
- Civics
- —
Market trends
- HPI YoY
- ▲ 35.95%
- Current HPI
- 228.5664
- Rent YoY
- —
- Metro
- —
- State GDP YoY
- ▲ 2.94%
- F500 in state
- 4
Industry mix (Fortune 500 HQ in AL)
| Industry | F500 HQs | Revenue |
|---|---|---|
| Financial Services | 1 | $8B |
|
||
| Healthcare | 1 | $5B |
|
||
Price history
-5.1% since first listed5 events — show timeline
- 2026-06-19 Price Changed $35,000 Greater Alabama MLS
- 2026-04-22 Listed $40,000 Greater Alabama MLS
- 2024-05-22 Price Changed $24,900 Greater Alabama MLS
- 2024-04-08 Price Changed $29,900 Greater Alabama MLS
- 2023-12-05 Price Changed $36,900 Greater Alabama MLS
Property tax history
+16.9%/yrLatest (2025): $605 · +0.0% YoY. Source: county tax records.
Cash-flow waterfall
monthlySold comps — $/sqft
last 12 mo · ≤1 miLoading sold comps…