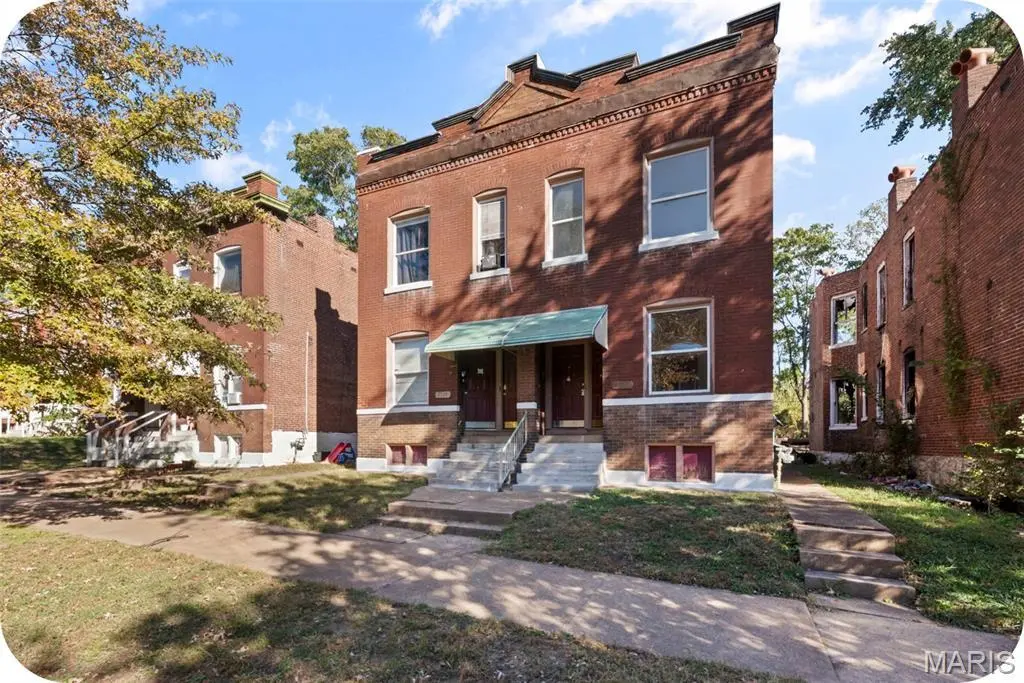
 Fourplex
3534 Pennsylvania Ave · St. Louis, MO
Flood risk No data
- FEMA flood zone
- —
- Chance of flooding over 30 yrs
- —
- Est. flood insurance / yr
- —
Fire risk No data
- Est. fire insurance / yr
- —
Heat risk No data
- Hot days now (above threshold)
- —
- Hot days in 30 yrs
- —
Wind risk No data
- Chance of severe wind over 30 yrs
- —
Air-quality risk No data
- Unhealthy air days now
- —
- Unhealthy air days in 30 yrs
- —
Risk factors via First Street. Map © Google.
Why this score? — see what drove the B grade
The composite is a weighted blend of 9 inputs, each scored 0–100. Each bar is that input's sub-score; the figure is the points it added to the 100-point composite (weight × sub-score).
- Cash flow +30.0/30.0
- ARV discount +13.5/15.0
- 1% rule +10.0/10.0
- DSCR +10.0/10.0
- Rent growth +3.7/5.0
- Livability +2.5/5.0
- Condition / age +2.5/5.0
- Schools +1.2/10.0
- Appreciation +0.0/10.0
$200,000
🖨 Deal sheet 📄 Offer letter ✓ Due diligence
Multi-family units
County records classify this as Multi-Family (2-4 Unit). Listing-text estimate: 4 units. confirmed
Listing remarks MLS
SHOWINGS ONLY WITH APPROVED CONTRACT - Enjoy instant cash flow with this professionally owned and managed 4-family building. Brand new roof (2017). All four 1-bedroom units are fully occupied at $495, $495, $475, and $450 per month. Detached 4-car garage has potential for another $200/mo in rent. Reliable tenants selected by a professional property manager. City occupancy permits provided for all units. Showings allowed with accepted offer. Building will be sold in AS-IS condition. Don't miss a great investment opportunity.
Key facts
- Bonus room
- Private front door
- Garage spaces
Tags
Property features AI
Finance
- Other: Property type: Residential income (2-4 units); Unit count: 1 unit type with 4 total units
- Financial info: No second mortgage reported; Lease considered: No
Exterior
- Parking: Detached or attached 2-car garage (2 garage spaces)
- Utilities: Electric service by Ameren; Electricity connected; Natural gas connected; Water connected; Sewer connected
- Home design: 2–4 unit residential income property; Total living area approximately 3,362 sq ft (assessor)
- Construction: Brick exterior; Stone foundation; Construction details from assessor
- Exterior features: Brick construction; Approximately 0.13-acre lot; No pool
Interior
- Bedrooms: One-bedroom units (4 units total)
- Bathrooms: One bathroom per unit
- Heating & cooling: Forced air heating; Window air conditioning units
- Interior features: Residential income property with multiple rental units
Neighborhood map
What this means for you Summary
Snapshot
- This is a 4 × 4-bed/1.0-bath units multifamily listed at $200k.
Deal economics
- At list price, monthly cash flow is $4k ($49k/yr) — positive. Per door: $1k/mo.
- The deal already cash-flows at list — no discount required.
- Meets the 1% rule at list price ($7k rent vs $200k).
- Recommended offer: $194k (3.0% below list) — sets the bar for market timing.
- Cap rate 30.6% vs local median 5.0% in St. Louis — top-decile yield for the area; either an underpriced asset or a hidden risk that comps aren't pricing in. Stress-test before assuming the spread holds.
Location & tenants
- Location reads: area grade B — affects rentability + tenant quality, not the cash-flow math above.
- St. Louis City (urban): math 10% / reading 18% proficiency, ranked #312 of 324 in MO (top 96%) — low school quality limits family demand, transient renter base, plan for 1-2y turnover; 80% free/reduced lunch — lower-income household profile, screen leases tightly.
- Zoned schools: Froebel Elem. (math 8% / reading 8%, grade F, #1,052 of 1,115 statewide, top 95%, 176 students, 98% FRL); Roosevelt High (math 2% / reading 8%, grade F, #517 of 521 statewide, top 100%, 460 students, 99% FRL) — zoned schools average 99% FRL vs 80% district-wide (18 pts higher); higher-poverty schools than district average — tighter screening recommended.
- Market conditions: Rents rising fast (+4.9%/yr); 240 active listings in the ZIP; 294 units permitted in St. Louis city in 2024 (227 in 5+ unit buildings).
- At $6,631/mo this rent would consume 138% of the median local household income ($58k/yr) (locally 1495% of renters already pay >50% of income on rent) — very limited rent-growth headroom before tenants either downsize or default.
Forward outlook
- Local home prices are declining (-3.0%/yr); year-one equity from $1k of loan paydown is wiped out by about $6k of value loss. Plan a longer hold.
- St. Louis County population projected to shrink 6% by 2050 — rents likely to lag national; underwrite the cash flow, not the appreciation.
- At projected returns (-3.0% appreciation + 4.9% rent growth), your $56k cash investment doubles in ~2 years — after that, you're playing with house money.
Negotiation context
- It's been on market 39 days — a 3% lower offer ($194k) is reasonable based on typical stale-listing flexibility.
- 5 sale attempts since 9y ago with the ask held roughly flat each time — persistent listings suggest the price (not the market) is what's stuck; bring a comps-based counter.
- Current owner paid $125k; list at $200k implies a 60% gain — meaningful room to come down on a strong offer.
Risks & watch-outs
- Watch-outs: built in 1907 — expect roof / HVAC / electrical / plumbing capex.
Questions for the listing agent
- It's been on market 39 days. Have you received any prior offers? Is the seller open to a 3% concession, seller financing, or rate buy-down credit?
- Can we see the unit-by-unit rent roll, current vacancy, and any below-market leases? What's the average tenancy length?
- What capital expenditures (roof, boiler, parking lot, exteriors) have been made in the last 5 years, and what's planned in the next 2?
- Built in 1907 — when were the roof, HVAC, electrical panel, plumbing, and water heater last replaced?
- Is there a deadline driving the sale (1031 exchange, divorce, estate, relocation)? That informs how much negotiation room exists.
- What's the average days-on-market for RENTAL listings here right now (not sales)? A rising rental-DOM trend means longer vacancies and softer asking-rent achievability than the comps imply.
- What's the recent tenant-quality profile in this submarket — average credit score on applications, eviction rate, late-payment / NSF rate, and stable-employment percentage? A property-management company in the area should have these aggregated.
- How much new apartment / multifamily construction is in the pipeline within 1–3 miles? Heavy new supply (>2% of stock underway) typically softens rents 12–24 months out; light construction supports rent growth.
Investment metrics
- 1% rule
- 3.32% ✓
- Cap rate
- 30.62%
- Cash-on-cash
- 86.87%
- DSCR
- 4.87
- GRM
- 2.5
CMA / ARV
- ARV (median comp)
- $230,631
- List price
- $200,000
- Delta
- -13.28%
- Verdict
- UNDERPRICED
- Comps
- 20 within 1.0 mi
Projected returns pro-forma
-3.0% appreciation · 4.89% rent growth · sell at horizon
- IRR
- 89.4%
- Equity multiple
- 5.26×
- Total profit
- $238,613
- Equity at exit
- $29,821
- IRR
- 92.8%
- Equity multiple
- 11.62×
- Total profit
- $594,956
- Equity at exit
- $17,292
Cash invested: $56,000 (down + closing). Projections, not guarantees.
Landlord ↔ Tenant lean methodology
- Overall (STATE)
- 81 Strongly Landlord-Friendly
- State Missouri
- 81 Strongly Landlord-Friendly · R+10
- County
- — inherits STATE
- City
- — inherits STATE
ZIP-level market 63118
- Rents YoY
- 4.9%
- Active inventory
- 240
- Price-to-rent
- 10.1×
Monthly cashflow live
- Estimated rent
- $6,631 high interval (Pro) →
- Mortgage (P&I)
- −$1,049
- Tax from tax record
- −$52 /mo · $629/yr
- Insurance
- −$83
- HOA
- −$0
- Vacancy / Maint / Mgmt
- −$1,393
- Net cashflow
- $4,054
Break-even live
4-unit breakdown (identical units grouped — click to expand)
| Units | Beds | Baths | Est. rent |
|---|---|---|---|
| 4× units | 4 | 1 | $6,632 |
| #1 | 4 | 1 | $1,658 |
| #2 | 4 | 1 | $1,658 |
| #3 | 4 | 1 | $1,658 |
| #4 | 4 | 1 | $1,658 |
| Total (4 units) | $6,631 | ||
UW: 25.0% down · 7.5% · 30yr · 1.5% tax · 5.0% vac · 8.0% maint · 8.0% mgmt
Financing live
Cash to close
- Down payment
- $50,000
- Closing costs
- $6,000
- Reserves months
- —
- Total cash needed
- —
Loan-product check · same deal, 3 products live
Conventional
25% down · 7.5% · 30yr
- Down + closing
- —
- Monthly P&I
- —
- Monthly cashflow
- —
- DSCR
- —
- Eligible?
- —
Personal DTI + credit; lowest rate.
DSCR
20% down · 8.5% · 30yr
- Down + closing
- —
- Monthly P&I
- —
- Monthly cashflow
- —
- DSCR
- —
- Eligible?
- —
No personal income docs; deal must DSCR.
Hard money
10% down · 12.0% · 12mo
- Down + closing
- —
- Monthly P&I
- —
- Monthly cashflow
- —
- DSCR
- —
- Eligible?
- —
Short-term bridge; refi at stabilization.
Listing history 30 events
-
2026-06-17status $200,000 Pending 39 DOM
-
2026-06-16days on market $200,000 Active 39 DOM
-
2026-06-15days on market $200,000 Active 38 DOM
-
2026-06-13days on market $200,000 Active 36 DOM
-
2026-06-09days on market $200,000 Active 32 DOM
-
2026-06-08days on market $200,000 Active 31 DOM
-
2026-06-07days on market $200,000 Active 30 DOM
-
2026-06-05days on market $200,000 Active 27 DOM
-
2026-06-03days on market $200,000 Active 26 DOM
-
2026-06-02days on market $200,000 Active 25 DOM
-
2026-06-01days on market $200,000 Active 24 DOM
-
2026-05-31days on market $200,000 Active 23 DOM
-
2026-05-08$200,000 Active 640-char remark
-
2025-11-11$225,000 Active
-
2024-06-09historical $750
-
2024-05-31$750
-
2024-01-11historical $750
-
2023-12-01$750
-
2017-10-04soldstatus $125,000
-
2017-09-28soldstatus Closed
Show marketing remark (529 chars)
SHOWINGS ONLY WITH APPROVED CONTRACT - Enjoy instant cash flow with this professionally owned and managed 4-family building. Brand new roof (2017). All four 1-bedroom units are fully occupied at $495, $495, $475, and $450 per month. Detached 4-car garage has potential for another $200/mo in rent. Reliable tenants selected by a professional property manager. City occupancy permits provided for all units. Showings allowed with accepted offer. Building will be sold in AS-IS condition. Don't miss a great investment opportunity.
-
2017-08-21historical Contingent (No Kickout)
Show marketing remark (529 chars)
SHOWINGS ONLY WITH APPROVED CONTRACT - Enjoy instant cash flow with this professionally owned and managed 4-family building. Brand new roof (2017). All four 1-bedroom units are fully occupied at $495, $495, $475, and $450 per month. Detached 4-car garage has potential for another $200/mo in rent. Reliable tenants selected by a professional property manager. City occupancy permits provided for all units. Showings allowed with accepted offer. Building will be sold in AS-IS condition. Don't miss a great investment opportunity.
-
2017-08-16$115,000 Active
Show marketing remark (529 chars)
SHOWINGS ONLY WITH APPROVED CONTRACT - Enjoy instant cash flow with this professionally owned and managed 4-family building. Brand new roof (2017). All four 1-bedroom units are fully occupied at $495, $495, $475, and $450 per month. Detached 4-car garage has potential for another $200/mo in rent. Reliable tenants selected by a professional property manager. City occupancy permits provided for all units. Showings allowed with accepted offer. Building will be sold in AS-IS condition. Don't miss a great investment opportunity.
-
2017-01-31soldstatus $96,000
-
2016-07-26soldstatus $64,500
-
2003-09-15soldstatus
-
2000-12-18soldstatus $44,000
-
2000-12-14soldstatus $102,000
-
1998-09-16soldstatus $46,500
-
1998-09-16soldstatus $68,000
-
1998-09-16soldstatus $68,000
ⓘ Source: listings_history table (triggers on properties + properties_extension) + one-shot
backfill from property_details.listing_events for pre-trigger history.
Tax reassessment forecast MO · Resets to sale price
- Current annual tax
- $629 · $52/mo
- Projected year-2 tax
- $1,940 · $162/mo
- Expected delta
- +$1,311/yr (+$109/mo · 208.4%)
ⓘ Screening estimate from a state-policy table — verify with the county assessor before closing.
Nearby sold comps map
Loading sold comps map…
Walkable amenities ~0.75 mi
Loading nearby amenities…
Taxation est. · year 1
- Rental income
- $79,572
- − Mortgage interest
- −$11,203
- − Property taxes
- −$629
- − Insurance
- −$1,000
- − Repairs & maintenance
- −$6,366
- − Management
- −$6,366
- − Depreciation
- −$5,818
- Taxable income
- $48,190
- Est. tax owed @ 24.0%
- −$11,566
- After-tax cash flow
- $37,081/yr
For passive investors: Depreciation is non-cash, so a rental often shows a tax loss while cash-flowing — sheltering income. Rental losses are passive: they offset passive income freely, and up to $25,000/yr can offset ordinary (W-2) income if you actively participate and your MAGI is under $100k (phasing out to $0 by $150k); unused losses carry forward. On sale, claimed depreciation is recaptured at up to 25%, and gains may owe capital-gains tax (a 1031 exchange can defer both). Figures are a year-1 estimate at your 24.0% rate — not tax advice; consult a CPA.
Schools (NCES district)
- District
- St. Louis City
- NCES district ID
- 2929280
- Math proficiency
- 10% ▼ -6.00%
- Reading proficiency
- 18% ▼ -3.00%
- Median HH income
- $35,685
- Composite
- 11.54/100
- National rank
- #9699
- State rank
- #312 of 324 in MO
Livability — St. Louis
No livability data for this city. (Only ~50 U.S. cities are tracked.)
Census & demographics
- Census place
- St. Louis, MO
- County
- Saint Louis City · 254,015 people
- City population
- 283,259
- Metro
- St. Louis, MO-IL
- Population (ZIP)
- 25,913
- Household income
- $57,762
- Rent vs Own
- Severe rent burden
- 1495.0
Population outlook (St. Louis County) Hauer SSP2
- Today (2025)
- 315,737 people
- By 2030
- 313,865 · -0.6%
- By 2040
- 305,439 · -3.3%
- By 2050
- 296,529 · -6.1%
- By 2075
- 271,028 · -14.2%
- By 2100
- 255,359 · -19.1%
Race, ethnicity, and origin ACS 2023
- Neighborhood character
- Diverse neighborhood (Simpson 0.63)
- Race & ethnicity
- White 44% Black 41% Two or more races 8% Hispanic / Latino 8% Asian 2%
- Hispanic origin (detail)
- Mexican 6%
- Common ancestry
- Slovak 2% Lithuanian 2% Romanian 2%
- Foreign-born
- 6% · Canada, Vietnam
- Languages at home
- 90% English-only · Spanish 5% Vietnamese 1% French/Haitian/Cajun 1%
Political lean MEDSL · St. Louis
- 2024 margin
- Solid D (+64.7) · D 81.4% · R 16.7% · Other 2.0%
- 2008→2024 swing
- -3.5pp toward R · 2008: 68.2pp · 2024: 64.7pp
- All cycles
- 2024: D+64.7 2020: D+66.2 2016: D+63.7 2012: D+66.6 2008: D+68.2
Not yet ingested
- Civics
- —
Market trends
- HPI YoY
- ▼ -347.51%
- Current HPI
- 171.5963
- Rent YoY
- ▲ 4.89%
- Metro
- St. Louis, MO-IL
- State GDP YoY
- ▲ 1.84%
- F500 in state
- 20
Industry mix (Fortune 500 HQ in MO)
| Industry | F500 HQs | Revenue |
|---|---|---|
| Healthcare | 1 | $163B |
|
||
| Insurance | 1 | $21B |
|
||
| Industrial Technology | 1 | $17B |
|
||
| Retail | 1 | $16B |
|
||
| Industrial Distribution | 1 | $10B |
|
||
| Utilities | 1 | $9B |
|
||
Price history
+330.1% since first listed19 events — show timeline
- 2026-06-17 Pending — MARIS as Distributed by MLS Grid
- 2026-05-08 Listed $200,000 MARIS as Distributed by MLS Grid
- 2025-11-11 Listed $225,000 MARIS as Distributed by MLS Grid
- 2024-06-09 Rental Removed $750 BUILDIUM
- 2024-05-31 Listed for Rent $750 BUILDIUM
- 2024-01-11 Rental Removed $750 BUILDIUM
- 2023-12-01 Listed for Rent $750 BUILDIUM
- 2017-10-04 Sold (Public Records) $125,000 Public Records
- 2017-09-28 Sold (MLS) — MARIS as Distributed by MLS Grid
- 2017-08-21 Contingent — MARIS as Distributed by MLS Grid
- 2017-08-16 Listed $115,000 MARIS as Distributed by MLS Grid
- 2017-01-31 Sold (Public Records) $96,000 Public Records
- 2016-07-26 Sold (Public Records) $64,500 Public Records
- 2003-09-15 Sold (Public Records) — Public Records
- 2000-12-18 Sold (Public Records) $44,000 Public Records
- 2000-12-14 Sold (Public Records) $102,000 Public Records
- 1998-09-16 Sold (Public Records) $68,000 Public Records
- 1998-09-16 Sold (Public Records) $68,000 Public Records
- 1998-09-16 Sold (Public Records) $46,500 Public Records
Property tax history
+3.0%/yrLatest (2024): $629 · +4.9% YoY. Source: county tax records.
Cash-flow waterfall
monthlySold comps — $/sqft
last 12 mo · ≤1 miLoading sold comps…