 Multi-family
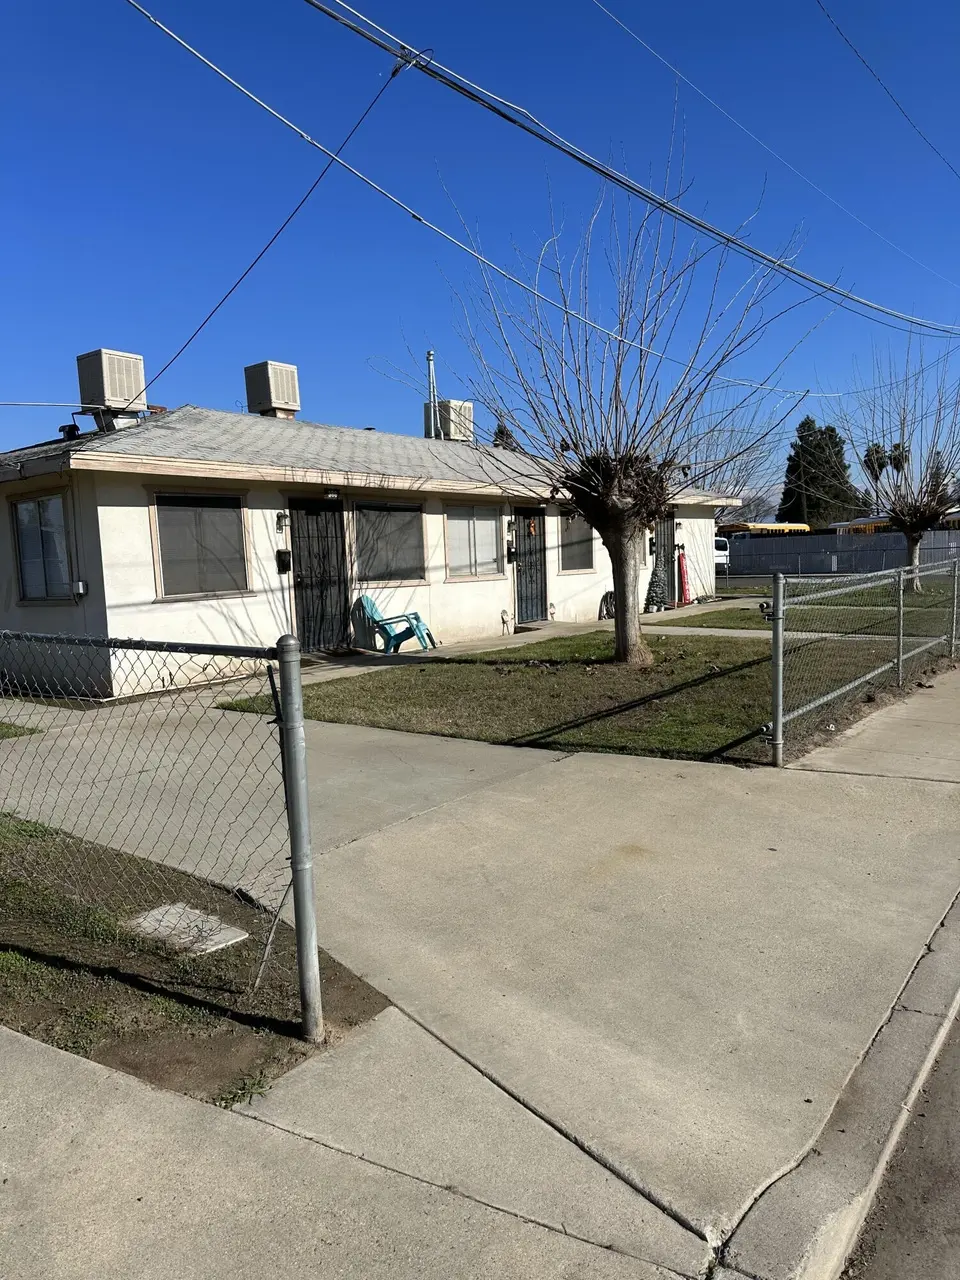
374 E Costner St Unit 1-5 · Farmersville, CA
Flood risk 7/10 · Major
- FEMA flood zone
- X (shaded)
- Chance of flooding over 30 yrs
- 0.97%
- Est. flood insurance / yr
- $507 – $1,088
Fire risk 7/10 · Major
- Est. fire insurance / yr
- $659 – $1,223
Heat risk 8/10 · Major
- Hot days now (above 105°F)
- 7 days/yr
- Hot days in 30 yrs
- 17 days/yr
Wind risk 1/10 · Minimal
- Chance of severe wind over 30 yrs
- —
Air-quality risk 10/10 · Severe
- Unhealthy air days now
- 44 days/yr
- Unhealthy air days in 30 yrs
- 50 days/yr
Risk factors via First Street. Map © Google.
Why this score? — see what drove the B grade
The composite is a weighted blend of 9 inputs, each scored 0–100. Each bar is that input's sub-score; the figure is the points it added to the 100-point composite (weight × sub-score).
- Cash flow +30.0/30.0
- 1% rule +10.0/10.0
- DSCR +10.0/10.0
- ARV discount +7.5/15.0
- Appreciation +3.5/10.0
- Livability +2.9/5.0
- Condition / age +2.8/5.0
- Rent growth +2.5/5.0
- Schools +1.3/10.0
$625,000
🖨 Deal sheet (PDF) 📄 Offer letter ✓ Due diligence
Multi-family units
County records classify this as Multi-Family (5+ Unit). Listing-text estimate: 1 unit. estimate disagrees with records
5+ unit building — per-unit beds/baths from public records are typically unavailable; the breakdown below (if shown) is an estimate from the listing text.
Listing remarks MLS
Exceptional Investment Opportunity in the heart of Farmersville. This multi-unit property offers strong rental income and modern updates throughout. Situated on a generous lot, this property features a well-maintained four-plex PLUS a separate stand alone home, making it perfect for investors seeking immediate cash flow and long term stability. Three of the units have been remodeled with updated interior finishes, improved flooring, updated kitchens, baths, and AC/Heating units, the fourth unit is in the process of being remodeled. Each unit is thoughtfully laid out to maximize comfort, natural light and easy living. In addition to the four-plex, the property includes a charming detached small home, which is ideal as an owners unit. This stand alone residence provides added privacy and versatility, significantly increasing total income potential. Whether you're expanding your portfolio or stepping into multi-family investing, 374 E. Costner delivers an unbeatable combination of updated units, reliable returns and long term value.
Key facts
- Generous lot
- Modern updates
- Strong rental income
Tags
Neighborhood map
What this means for you Summary
Snapshot
- This is a 6-bed/5.0-bath multifamily listed at $625k. Condition is rated average.
Deal economics
- At list price, monthly cash flow is $3k ($39k/yr) — positive.
- The deal already cash-flows at list — no discount required.
- Meets the 1% rule at list price ($10k rent vs $625k).
- Recommended offer: $569k (9.0% below list) — sets the bar for market timing.
Location & tenants
- Location reads 58/100 on livability (#723 in CA) — a working-class tenant base; expect higher turnover. Strengths: commute A+, housing A+; Watch: crime D+, cost of living D+, amenities F.
- Farmersville Unified (suburban): math 9% / reading 22% proficiency, ranked #492 of 517 in CA (top 95%) — low school quality limits family demand, transient renter base, plan for 1-2y turnover; 81% free/reduced lunch — lower-income household profile, screen leases tightly.
- Zoned schools: J. E. Hester Elementary (385 students, 90% FRL); Freedom Elementary (math 11% / reading 21%, grade F, #452 of 498 statewide, top 91%, 572 students, 86% FRL); Farmersville High (math 2% / reading 32%, grade F, #1,010 of 1,170 statewide, top 88%, 723 students, 80% FRL) — zoned schools at 85% FRL track the district average.
- Market conditions: 21 active listings in the ZIP; 1,447 units permitted in Tulare County in 2024 (307 in 5+ unit buildings).
Forward outlook
- Local home prices are declining (-3.0%/yr); year-one equity from $4k of loan paydown is wiped out by about $19k of value loss. Plan a longer hold.
- Tulare County population projected at +10% by 2050 — modest demand growth; plan on rents tracking national, not racing it.
- At projected returns (-3.0% appreciation + 3.0% rent growth), your $175k cash investment doubles in ~6 years — after that, you're playing with house money.
Negotiation context
- It's been on market 116 days — a 9% lower offer ($569k) is reasonable based on typical stale-listing flexibility.
Risks & watch-outs
- Watch-outs: flood insurance adds $66/mo.
- Climate carrying-cost: major flood risk; major wildfire risk; extreme-heat days projected 7→17/yr by 2055 (HVAC capex compounding) — expect insurance premiums to compound above CPI over the hold.
Questions for the listing agent
- It's been on market 116 days. Have you received any prior offers? Is the seller open to a 9% concession, seller financing, or rate buy-down credit?
- What's the actual annual flood-insurance premium (NFIP or private), and is the property in a SFHA with mandatory coverage?
- Why hasn't it sold? Are there any deal-killer items the seller is aware of (foundation, flood, title, zoning, code violations)?
- Is there a deadline driving the sale (1031 exchange, divorce, estate, relocation)? That informs how much negotiation room exists.
- Schools are F-rated, which usually means shorter tenancies and higher turnover. Who's the typical renter profile here, and what's been the actual vacancy rate?
- Crime grade is D in this area — have there been break-ins, vandalism, or insurance claims at this property in the last 3 years? What carrier currently insures it and at what premium?
- What's the average days-on-market for RENTAL listings here right now (not sales)? A rising rental-DOM trend means longer vacancies and softer asking-rent achievability than the comps imply.
- What's the recent tenant-quality profile in this submarket — average credit score on applications, eviction rate, late-payment / NSF rate, and stable-employment percentage? A property-management company in the area should have these aggregated.
- How much new apartment / multifamily construction is in the pipeline within 1–3 miles? Heavy new supply (>2% of stock underway) typically softens rents 12–24 months out; light construction supports rent growth.
Investment metrics
- 1% rule
- 1.55% ✓
- Cap rate
- 12.71%
- Cash-on-cash
- 22.90%
- DSCR
- 2.02
- GRM
- 5.4
CMA / ARV
- ARV (median comp)
- $228,436
- List price
- $625,000
- Delta
- 173.60%
- Verdict
- OVERPRICED
- Comps
- 7 within 1.0 mi
Show comp detail 1 sale within ~0.75 mi
| Address | Dist | Beds/Ba | Sqft | Sold | Price | $/sf | Match |
|---|---|---|---|---|---|---|---|
| 738 E Larry St | 0.21mi | 6/3.0 | 2,772 (-10%) | 6mo | $540,000 | $195 | 60 |
Match score weights: distance 35% · size 25% · config 20% · recency 20%. Top-matched comps best support the ARV.
Projected returns pro-forma
-3.0% appreciation · 3.0% rent growth · sell at horizon
- IRR
- 15.3%
- Equity multiple
- 1.61×
- Total profit
- $107,494
- Equity at exit
- $93,297
- IRR
- 24.0%
- Equity multiple
- 3.07×
- Total profit
- $362,903
- Equity at exit
- $54,224
Cash invested: $175,000 (down + closing). Projections, not guarantees.
Landlord ↔ Tenant lean methodology
- Overall (STATE)
- 18 Strongly Tenant-Friendly
- State California
- 18 Strongly Tenant-Friendly · D+13
- County
- — inherits STATE
- City
- — inherits STATE
ZIP-level market 93223
- Home prices YoY
- -0.8%
- Active inventory
- 21
- Price-to-rent
- 37.6×
Monthly cashflow live
- Estimated rent
- $9,695 medium interval (Pro) →
- Mortgage (P&I)
- −$3,278
- Tax est. 1.5%
- −$781 /mo · $9,375/yr
- Insurance
- −$260
- Flood insurance flood zone
- −$66 /mo · $798/yr
- HOA
- −$0
- Vacancy / Maint / Mgmt
- −$2,036
- Net cashflow
- $3,273
Break-even live
Sensitivity live
| Price | -10% $3,705 | -5% $3,489 | +0% $3,273 | +5% $3,057 | +10% $2,841 |
|---|---|---|---|---|---|
| Rent | -10% $2,507 | -5% $2,890 | +0% $3,273 | +5% $3,656 | +10% $4,039 |
| Rate | -1.0pp $3,588 | -0.5pp $3,432 | base $3,273 | +0.5pp $3,111 | +1.0pp $2,947 |
7-unit breakdown (identical units grouped — click to expand)
| Units | Beds | Baths | Est. rent |
|---|---|---|---|
| 7× units | 3 | 1 | $9,695 |
| #1 | 3 | 1 | $1,385 |
| #2 | 3 | 1 | $1,385 |
| #3 | 3 | 1 | $1,385 |
| #4 | 3 | 1 | $1,385 |
| #5 | 3 | 1 | $1,385 |
| #6 | 3 | 1 | $1,385 |
| #7 | 3 | 1 | $1,385 |
| Total (7 units) | $9,695 | ||
UW: 25.0% down · 7.5% · 30yr · 1.5% tax · 5.0% vac · 8.0% maint · 8.0% mgmt
Financing live
Cash to close
- Down payment
- $156,250
- Closing costs
- $18,750
- Reserves months
- —
- Total cash needed
- —
Loan-product check · same deal, 3 products live
Conventional
25% down · 7.5% · 30yr
- Down + closing
- —
- Monthly P&I
- —
- Monthly cashflow
- —
- DSCR
- —
- Eligible?
- —
Personal DTI + credit; lowest rate.
DSCR
20% down · 8.5% · 30yr
- Down + closing
- —
- Monthly P&I
- —
- Monthly cashflow
- —
- DSCR
- —
- Eligible?
- —
No personal income docs; deal must DSCR.
Hard money
10% down · 12.0% · 12mo
- Down + closing
- —
- Monthly P&I
- —
- Monthly cashflow
- —
- DSCR
- —
- Eligible?
- —
Short-term bridge; refi at stabilization.
Listing history 3 events
-
2026-05-31days on market $625,000 Active 116 DOM
-
2026-05-30days on market $625,000 Active 115 DOM
-
2025-12-10$625,000 Active 1045-char remark
Show marketing remark (1045 chars)
Exceptional Investment Opportunity in the heart of Farmersville. This multi-unit property offers strong rental income and modern updates throughout. Situated on a generous lot, this property features a well-maintained four-plex PLUS a separate stand alone home, making it perfect for investors seeking immediate cash flow and long term stability. Three of the units have been remodeled with updated interior finishes, improved flooring, updated kitchens, baths, and AC/Heating units, the fourth unit is in the process of being remodeled. Each unit is thoughtfully laid out to maximize comfort, natural light and easy living. In addition to the four-plex, the property includes a charming detached small home, which is ideal as an owners unit. This stand alone residence provides added privacy and versatility, significantly increasing total income potential. Whether you're expanding your portfolio or stepping into multi-family investing, 374 E. Costner delivers an unbeatable combination of updated units, reliable returns and long term value.
ⓘ Source: listings_history table (triggers on properties + properties_extension) + one-shot
backfill from property_details.listing_events for pre-trigger history.
Climate risk First Street
- Flood 7/10 Severe FEMA zone X (shaded) · 97% chance over 30 yrs
- Wildfire 7/10 Severe
- Heat 8/10 Severe 7 d/yr ≥105°F today · 17 d/yr by 30 yrs out
- Wind 1/10 Low
- Air quality 10/10 Extreme 44 unhealthy d/yr today · 50 by 30 yrs out
Nearby sold comps map
Loading sold comps map…
Walkable amenities ~0.75 mi
Loading nearby amenities…
Taxation est. · year 1
- Rental income
- $116,340
- − Mortgage interest
- −$35,010
- − Property taxes
- −$9,375
- − Insurance
- −$3,922
- − Repairs & maintenance
- −$9,307
- − Management
- −$9,307
- − Depreciation
- −$18,182
- Taxable income
- $31,237
- Est. tax owed @ 24.0%
- −$7,497
- After-tax cash flow
- $31,784/yr
For passive investors: Depreciation is non-cash, so a rental often shows a tax loss while cash-flowing — sheltering income. Rental losses are passive: they offset passive income freely, and up to $25,000/yr can offset ordinary (W-2) income if you actively participate and your MAGI is under $100k (phasing out to $0 by $150k); unused losses carry forward. On sale, claimed depreciation is recaptured at up to 25%, and gains may owe capital-gains tax (a 1031 exchange can defer both). Figures are a year-1 estimate at your 24.0% rate — not tax advice; consult a CPA.
Condition & rehab AI · 3 photos
This multi-family property presents an average condition with moderate rehabilitation needs, including exterior repairs and landscaping. High-impact updates like roof replacement and exterior improvements can significantly boost its resale and rental value.
Repairs flagged
- Moderate Exterior siding — Weathered appearance
- Moderate Roof — Aged appearance
Value-add opportunities
- Both Landscaping and exterior painting — Enhances curb appeal and property value
- Both Roof replacement — Improves structural integrity and property value
- Both Exterior siding repair — Enhances property appearance and value
Renovation cost estimate screening
| Repair item | Severity | Est. cost |
|---|---|---|
| Exterior siding · Weathered appearance | Moderate | $3,000–15,000 |
| Roof · Aged appearance | Moderate | $3,000–15,000 |
| Total estimated repair cost · 2 items | $6,000–30,000 |
Value-add ROI direction
- Both Landscaping and exterior painting — Enhances curb appeal and property value ↑
- Both Roof replacement — Improves structural integrity and property value ↑
- Both Exterior siding repair — Enhances property appearance and value ↑
ⓘ Cost ranges are severity-bucket heuristics (US national rule-of-thumb). Get contractor quotes + a written scope before underwriting a rehab budget.
Schools (NCES district)
- District
- Farmersville Unified
- NCES district ID
- 0600035
- Math proficiency
- 9% ▼ -6.00%
- Reading proficiency
- 22% ▼ -5.00%
- Median HH income
- $34,388
- Composite
- 12.64/100
- National rank
- #9609
- State rank
- #492 of 517 in CA
Livability — Farmersville
- Score
- 58/100
- State rank
- #723
- US rank
- #21420
Category grades
Schools grade is shown separately in the Schools card above.
Census & demographics
- Census place
- Farmersville, CA
- City population
- 10,359
- Population (ZIP)
- 10,359
Population outlook (Tulare County) Hauer SSP2
- Today (2025)
- 484,681 people
- By 2030
- 496,241 · +2.4%
- By 2040
- 518,507 · +7.0%
- By 2050
- 534,920 · +10.4%
- By 2075
- 548,417 · +13.2%
- By 2100
- 513,085 · +5.9%
Race, ethnicity, and origin ACS 2023
- Neighborhood character
- Predominantly Hispanic (89%)
- Race & ethnicity
- Hispanic / Latino 89% Two or more races 32% White 10% Native American 1%
- Hispanic origin (detail)
- Mexican 85%
- Common ancestry
- Lithuanian 1%
- Foreign-born
- 24% · Canada
- Languages at home
- 34% English-only · Spanish 66%
Political lean MEDSL · Tulare
- 2024 margin
- Strong R (+20.7) · D 38.5% · R 59.2% · Other 2.3%
- 2008→2024 swing
- -5.4pp toward R · 2008: -15.3pp · 2024: -20.7pp
- All cycles
- 2024: R+20.7 2020: R+7.8 2016: R+12.1 2012: R+17.8 2008: R+15.3
Not yet ingested
- Civics
- —
Market trends
- HPI YoY
- ▼ -3.00%
- Current HPI
- 387.1795
- Rent YoY
- —
- Metro
- —
- State GDP YoY
- ▲ 3.21%
- F500 in state
- 116
Industry mix (Fortune 500 HQ in CA)
| Industry | F500 HQs | Revenue |
|---|---|---|
| Technology | 27 | $1,492B |
|
||
| Financial Services | 3 | $174B |
|
||
| Retail | 3 | $44B |
|
||
| Insurance | 3 | $26B |
|
||
| Media / Entertainment | 2 | $115B |
|
||
| Pharmaceuticals / Biotech | 2 | $62B |
|
||
Price history
1 event — show timeline
- 2025-12-10 Listed $625,000 TCMLS
Cash-flow waterfall
monthlySold comps — $/sqft
last 12 mo · ≤1 miLoading sold comps…