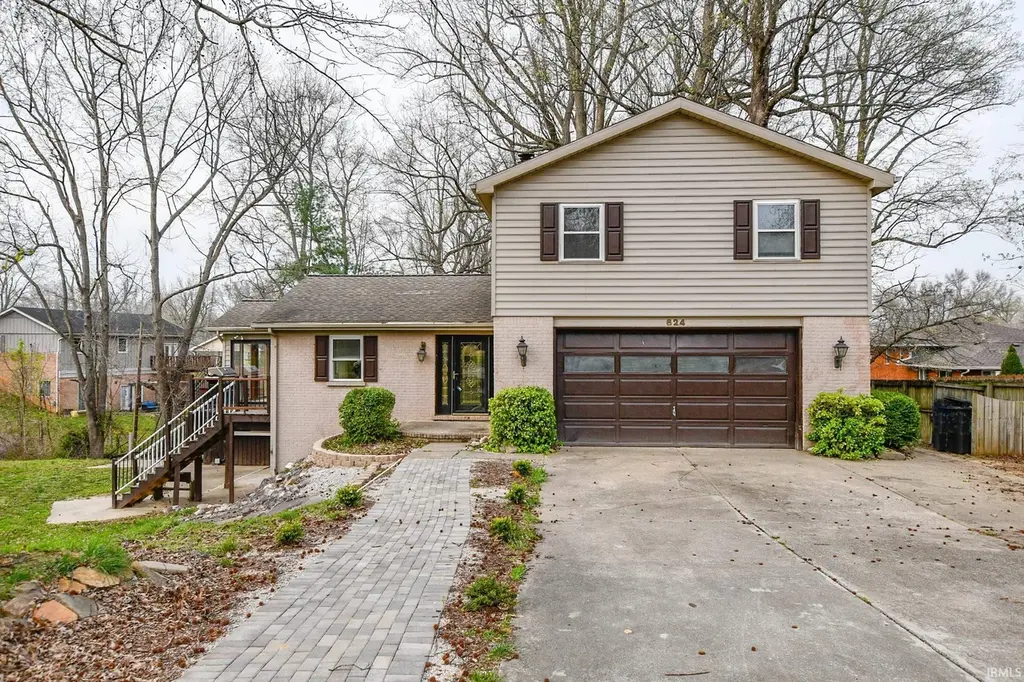
624 Forest Park Dr · Newburgh, IN
Flood risk 1/10 · Minimal
- FEMA flood zone
- X (unshaded)
- Chance of flooding over 30 yrs
- 0.0%
- Est. flood insurance / yr
- $473 – $860
Fire risk 1/10 · Minimal
- Est. fire insurance / yr
- $717 – $1,331
Heat risk 5/10 · Moderate
- Hot days now (above 106°F)
- 7 days/yr
- Hot days in 30 yrs
- 18 days/yr
Wind risk 2/10 · Minimal
- Chance of severe wind over 30 yrs
- 3.0%
Air-quality risk 3/10 · Minor
- Unhealthy air days now
- 3 days/yr
- Unhealthy air days in 30 yrs
- 4 days/yr
Risk factors via First Street. Map © Google.
Why this score? — see what drove the C- grade
The composite is a weighted blend of 9 inputs, each scored 0–100. Each bar is that input's sub-score; the figure is the points it added to the 100-point composite (weight × sub-score).
- Cash flow +16.7/30.0
- ARV discount +11.2/15.0
- DSCR +5.2/10.0
- Schools +4.9/10.0
- Rent growth +4.7/5.0
- Livability +4.0/5.0
- 1% rule +3.7/10.0
- Condition / age +2.5/5.0
- Appreciation +0.0/10.0
$274,000
🖨 Deal sheet 📄 Offer letter ✓ Due diligence
Listing remarks MLS
Enjoy luxury and comfort in this beautifully updated home, perfectly located near schools and shops. Home Highlights: Brand-new flooring, fresh paint, and updated plumbing. • Bright & Airy: Featuring new Patio doors and a stunning Sunroom for year-round relaxation. • Cozy Living: Two spacious living areas, including a lower-level retreat with a gas fireplace. • Private Suite: Owner’s sanctuary with a private full bath. Outdoor Paradise: • Escape at Home: Private backyard featuring a cabana and hot tub—perfect for entertaining or unwinding.
Key facts
- 0.41 acre lot
- 2 garage spots
- Built 1974
Neighborhood map
What this means for you Summary
Snapshot
- This is a 3-bed/2.5-bath single-family listed at $274k.
Deal economics
- At list price, monthly cash flow is $170 ($2k/yr) — positive.
- The deal already cash-flows at list — no discount required.
- To meet the 1% rule (rent ≥ 1% of price), the offer needs to be $239k (12.7% below list).
- Recommended offer: $239k (12.7% below list) — sets the bar for 1% rule.
- Cap rate 7.0% vs local median 3.9% in Newburgh — top-decile yield for the area; either an underpriced asset or a hidden risk that comps aren't pricing in. Stress-test before assuming the spread holds.
Location & tenants
- Location reads 80/100 on livability (#21 in IN, #1,922 nationally) — a professional / high-income tenant draw. Strengths: crime A+, cost of living A+, housing A+; Watch: amenities F, commute F.
- Warrick County School Corporation (suburban): math 54% / reading 59% proficiency, ranked #24 of 301 in IN (top 8%) — acceptable for families but not a draw, mixed tenant base, ~2y average lease.
- Market conditions: Rents rising fast (+8.7%/yr); 383 active listings in the ZIP; 3 comparable units currently listed for rent nearby; rentals leasing fast (median 14d on market — plan ~1-2 weeks tenant-placement turnaround); solid renter incomes; 249 units permitted in Warrick County in 2024 (0 in 5+ unit buildings).
- This rent runs 30% of the median local income ($94k/yr) — at the standard rent-burdened threshold; future hikes will face affordability resistance.
Forward outlook
- Local home prices are declining (-3.0%/yr); year-one equity from $2k of loan paydown is wiped out by about $8k of value loss. Plan a longer hold.
- Warrick County population projected at +9% by 2050 — modest demand growth; plan on rents tracking national, not racing it.
Negotiation context
- It's been on market 84 days — a 6% lower offer ($258k) is reasonable based on typical stale-listing flexibility.
- 3 sale attempts since 11y ago; this cycle's ask has dropped $20k (7%) from the opening price — seller is motivated, your offer sets the floor, not the list.
- Current owner paid $151k; list at $274k implies a 81% gain — meaningful room to come down on a strong offer.
Risks & watch-outs
- Climate carrying-cost: extreme-heat days projected 7→18/yr by 2055 (HVAC capex compounding) — expect insurance premiums to compound above CPI over the hold.
Questions for the listing agent
- It's been on market 84 days. Have you received any prior offers? Is the seller open to a 13% concession, seller financing, or rate buy-down credit?
- Built in 1974 — when were the roof, HVAC, electrical panel, plumbing, and water heater last replaced?
- Why hasn't it sold? Are there any deal-killer items the seller is aware of (foundation, flood, title, zoning, code violations)?
- Is there a deadline driving the sale (1031 exchange, divorce, estate, relocation)? That informs how much negotiation room exists.
- Schools are A-rated — typically a magnet for longer-tenancy family renters. What's the average tenant stay here, and is there a school-zone premium baked into asking?
- What's the average days-on-market for RENTAL listings here right now (not sales)? A rising rental-DOM trend means longer vacancies and softer asking-rent achievability than the comps imply.
- What's the recent tenant-quality profile in this submarket — average credit score on applications, eviction rate, late-payment / NSF rate, and stable-employment percentage? A property-management company in the area should have these aggregated.
- How much new for-sale + rental construction is in the pipeline within 1–3 miles? Heavy new supply typically softens prices + rents 12–24 months out; constrained supply supports both.
Investment metrics
- 1% rule
- 0.87% ✗
- Cap rate
- 7.04%
- Cash-on-cash
- 2.65%
- DSCR
- 1.12
- GRM
- 9.5
CMA / ARV
- ARV (median comp)
- $298,662
- List price
- $274,000
- Delta
- -8.26%
- Verdict
- FAIR
- Comps
- 20 within 1.0 mi
Show comp detail 12 sales within ~0.75 mi
| Address | Dist | Beds/Ba | Sqft | Sold | Price | $/sf | Match |
|---|---|---|---|---|---|---|---|
| 5944 Riceland Dr | 0.11mi | 4/3.0 (+1) | 2,263 (-1%) | 5mo | $307,000 | $136 | 82 |
| 7322 Lakevale Dr | 0.37mi | 3/2.0 | 2,232 (-2%) | 7mo | $365,000 | $164 | 71 |
| 623 Forest Park Dr | 0.03mi | 3/2.0 | 1,974 (-14%) | 10mo | $290,000 | $147 | 65 |
| 6888 Cottage Ln | 0.25mi | 3/2.0 | 2,001 (-12%) | 1mo | $389,900 | $195 | 65 |
| 5455 E Timberwood Dr | 0.51mi | 3/2.5 | 2,197 (-4%) | 7mo | $277,500 | $126 | 64 |
| 630 Bartlett Dr | 0.42mi | 3/1.5 | 2,132 (-7%) | 8mo | $245,000 | $115 | 58 |
| 7711 Woodland Dr | 0.47mi | 3/2.0 | 2,035 (-11%) | 1mo | $287,500 | $141 | 57 |
| 5497 E Sherwood Dr | 0.54mi | 4/2.0 (+1) | 2,115 (-8%) | 1mo | $305,000 | $144 | 54 |
| 8122 Roberts Ridge Rd | 0.69mi | 3/2.0 | 2,443 (+7%) | 8mo | $358,900 | $147 | 48 |
| 215 Hillcrest Dr | 0.53mi | 4/2.0 (+1) | 2,052 (-10%) | 5mo | $150,000 | $73 | 47 |
| 5455 Kenwood Cir | 0.62mi | 4/2.5 (+1) | 2,596 (+14%) | 1mo | $345,000 | $133 | 43 |
| 5366 Jeffries Ln | 0.61mi | 3/2.0 | 1,950 (-15%) | 7mo | $250,000 | $128 | 39 |
Match score weights: distance 35% · size 25% · config 20% · recency 20%. Top-matched comps best support the ARV.
Projected returns pro-forma
-3.0% appreciation · 8.0% rent growth · sell at horizon
- IRR
- -7.1%
- Equity multiple
- 0.73×
- Total profit
- $-21,034
- Equity at exit
- $40,854
- IRR
- 7.5%
- Equity multiple
- 1.69×
- Total profit
- $52,827
- Equity at exit
- $23,691
Cash invested: $76,720 (down + closing). Projections, not guarantees.
Landlord ↔ Tenant lean methodology
- Overall (STATE)
- 90 Strongly Landlord-Friendly
- State Indiana
- 90 Strongly Landlord-Friendly · R+11
- County
- — inherits STATE
- City
- — inherits STATE
ZIP-level market 47630
- Rents YoY
- 8.7%
- Active inventory
- 383
- Price-to-rent
- 9.5×
Monthly cashflow live
- Estimated rent
- $2,392 medium interval (Pro) →
- Mortgage (P&I)
- −$1,437
- Tax from tax record
- −$169 /mo · $2,025/yr
- Insurance
- −$114
- HOA
- −$0
- Vacancy / Maint / Mgmt
- −$502
- Net cashflow
- $170
Break-even live
UW: 25.0% down · 7.5% · 30yr · 1.5% tax · 5.0% vac · 8.0% maint · 8.0% mgmt
Financing live
Cash to close
- Down payment
- $68,500
- Closing costs
- $8,220
- Reserves months
- —
- Total cash needed
- —
Loan-product check · same deal, 3 products live
Conventional
25% down · 7.5% · 30yr
- Down + closing
- —
- Monthly P&I
- —
- Monthly cashflow
- —
- DSCR
- —
- Eligible?
- —
Personal DTI + credit; lowest rate.
DSCR
20% down · 8.5% · 30yr
- Down + closing
- —
- Monthly P&I
- —
- Monthly cashflow
- —
- DSCR
- —
- Eligible?
- —
No personal income docs; deal must DSCR.
Hard money
10% down · 12.0% · 12mo
- Down + closing
- —
- Monthly P&I
- —
- Monthly cashflow
- —
- DSCR
- —
- Eligible?
- —
Short-term bridge; refi at stabilization.
Rent comps 3 comps
| Address | Beds | Baths | Sqft | Rent | $/sqft | DOM | Units | Dist |
|---|---|---|---|---|---|---|---|---|
| 5200 E Timberwood Dr Newburgh, IN | 4.0 | 3.0 | 1643 | $2,200 | $1.34 | 13d | 1 | 0.76mi |
| 5041 E Sherwood Dr Newburgh, IN | 3.0 | 2.5 | 2077 | $2,350 | $1.13 | 13d | 1 | 0.96mi |
| 603 W Water St Newburgh, IN | 3.0 | 2.0 | 2810 | $3,700 | $1.32 | 43d | 1 | 1.39mi |
Listing history 24 events
-
2026-06-18days on market $274,000 Active 84 DOM
-
2026-06-17days on market $274,000 Active 83 DOM
-
2026-06-16days on market $274,000 Active 82 DOM
-
2026-06-15days on market $274,000 Active 81 DOM
-
2026-06-14days on market $274,000 Active 79 DOM
-
2026-06-13days on market $274,000 Active 78 DOM
-
2026-06-10days on market $274,000 Active 76 DOM
-
2026-06-09days on market $274,000 Active 75 DOM
-
2026-06-08days on market $274,000 Active 74 DOM
-
2026-06-07days on market $274,000 Active 73 DOM
-
2026-06-02days on market $274,000 Active 68 DOM
-
2026-06-01pricedays on market $274,000 Active 67 DOM
-
2026-05-31days on market $279,000 Active 66 DOM
-
2026-05-30days on market $279,000 Active 65 DOM
-
2026-04-13price $279,000 583-char remark
Show marketing remark (583 chars)
Enjoy luxury and comfort in this beautifully updated home, perfectly located near schools and shops. Home Highlights: Brand-new flooring, fresh paint, and updated plumbing. • Bright & Airy: Featuring new Patio doors and a stunning Sunroom for year-round relaxation. • Cozy Living: Two spacious living areas, including a lower-level retreat with a gas fireplace. • Private Suite: Owner’s sanctuary with a private full bath. Outdoor Paradise: • Escape at Home: Private backyard featuring a cabana and hot tub—perfect for entertaining or unwinding.
-
2026-03-31price $289,000 583-char remark
Show marketing remark (583 chars)
Enjoy luxury and comfort in this beautifully updated home, perfectly located near schools and shops. Home Highlights: Brand-new flooring, fresh paint, and updated plumbing. • Bright & Airy: Featuring new Patio doors and a stunning Sunroom for year-round relaxation. • Cozy Living: Two spacious living areas, including a lower-level retreat with a gas fireplace. • Private Suite: Owner’s sanctuary with a private full bath. Outdoor Paradise: • Escape at Home: Private backyard featuring a cabana and hot tub—perfect for entertaining or unwinding.
-
2026-03-25$294,000 Active 583-char remark
Show marketing remark (583 chars)
Enjoy luxury and comfort in this beautifully updated home, perfectly located near schools and shops. Home Highlights: Brand-new flooring, fresh paint, and updated plumbing. • Bright & Airy: Featuring new Patio doors and a stunning Sunroom for year-round relaxation. • Cozy Living: Two spacious living areas, including a lower-level retreat with a gas fireplace. • Private Suite: Owner’s sanctuary with a private full bath. Outdoor Paradise: • Escape at Home: Private backyard featuring a cabana and hot tub—perfect for entertaining or unwinding.
-
2025-09-15price $274,900
-
2025-08-22price $279,000
-
2025-07-18price $284,500
-
2025-07-10$298,500 Active
-
2024-04-26soldstatus $151,070
-
2015-05-05soldstatus $145,000
-
2015-01-06$145,000
ⓘ Source: listings_history table (triggers on properties + properties_extension) + one-shot
backfill from property_details.listing_events for pre-trigger history.
Tax reassessment forecast IN · Partial reset (capped growth)
- Current annual tax
- $2,025 · $169/mo
- Projected year-2 tax
- $2,177 · $181/mo
- Expected delta
- +$152/yr (+$13/mo · 7.5%)
ⓘ Screening estimate from a state-policy table — verify with the county assessor before closing.
Climate risk First Street
- Flood 1/10 Low FEMA zone X (unshaded) · 0% chance over 30 yrs
- Wildfire 1/10 Low
- Heat 5/10 Major 7 d/yr ≥106°F today · 18 d/yr by 30 yrs out
- Wind 2/10 Low 3% chance of damaging wind over 30 yrs
- Air quality 3/10 Moderate 3 unhealthy d/yr today · 4 by 30 yrs out
Nearby sold comps map
Loading sold comps map…
Walkable amenities ~0.75 mi
Loading nearby amenities…
Taxation est. · year 1
- Rental income
- $28,699
- − Mortgage interest
- −$15,348
- − Property taxes
- −$2,025
- − Insurance
- −$1,370
- − Repairs & maintenance
- −$2,296
- − Management
- −$2,296
- − Depreciation
- −$7,971
- Taxable loss
- −$2,607
- Est. tax savings @ 24.0%
- +$626
- After-tax cash flow
- $2,660/yr
For passive investors: Depreciation is non-cash, so a rental often shows a tax loss while cash-flowing — sheltering income. Rental losses are passive: they offset passive income freely, and up to $25,000/yr can offset ordinary (W-2) income if you actively participate and your MAGI is under $100k (phasing out to $0 by $150k); unused losses carry forward. On sale, claimed depreciation is recaptured at up to 25%, and gains may owe capital-gains tax (a 1031 exchange can defer both). Figures are a year-1 estimate at your 24.0% rate — not tax advice; consult a CPA.
Schools (NCES district)
- District
- Warrick County School Corporation
- NCES district ID
- 1812390
- Math proficiency
- 54% ▼ -8.00%
- Reading proficiency
- 59% ▼ -6.00%
- Median HH income
- $62,801
- Composite
- 49.38/100
- National rank
- #2014
- State rank
- #24 of 301 in IN
Livability — Newburgh
- Score
- 80/100
- State rank
- #21
- US rank
- #1922
Category grades
Schools grade is shown separately in the Schools card above.
Census & demographics
- Census place
- Newburgh, IN
- County
- Warrick County · 39,818 people
- City population
- 39,818
- Metro
- Evansville, IN-KY
- Population (ZIP)
- 39,818
- Household income
- $94,162
- Rent vs Own
- Severe rent burden
- 770.0
Population outlook (Warrick County) Hauer SSP2
- Today (2025)
- 66,569 people
- By 2030
- 68,404 · +2.8%
- By 2040
- 71,131 · +6.9%
- By 2050
- 72,743 · +9.3%
- By 2075
- 76,088 · +14.3%
- By 2100
- 72,261 · +8.6%
Race, ethnicity, and origin ACS 2023
- Neighborhood character
- Predominantly White (88%)
- Race & ethnicity
- White 88% Two or more races 5% Black 3% Hispanic / Latino 3% Asian 3%
- Common ancestry
- Italian 3% Lithuanian 2% Romanian 2%
- Foreign-born
- 5% · Canada, China
- Languages at home
- 96% English-only · Spanish 2% Other Indo-European 1%
Political lean MEDSL · Warrick
- 2024 margin
- Solid R (+30.2) · D 34.1% · R 64.3% · Other 1.5%
- 2008→2024 swing
- -17.4pp toward R · 2008: -12.8pp · 2024: -30.2pp
- All cycles
- 2024: R+30.2 2020: R+27.8 2016: R+33.9 2012: R+26.6 2008: R+12.8
Not yet ingested
- Civics
- —
Market trends
- HPI YoY
- ▼ -187.44%
- Current HPI
- 185.7643
- Rent YoY
- ▲ 8.69%
- Metro
- Evansville, IN-KY
- State GDP YoY
- ▲ 2.90%
- F500 in state
- 18
Industry mix (Fortune 500 HQ in IN)
| Industry | F500 HQs | Revenue |
|---|---|---|
| Industrial Machinery | 2 | $37B |
|
||
| Healthcare | 1 | $177B |
|
||
| Pharmaceuticals | 1 | $45B |
|
||
| Metals / Steel | 1 | $18B |
|
||
| Agriculture | 1 | $17B |
|
||
| Packaging | 1 | $12B |
|
||
Price history
+92.4% since first listed10 events — show timeline
- 2026-04-13 Price Changed $279,000 IRMLS
- 2026-03-31 Price Changed $289,000 IRMLS
- 2026-03-25 Listed $294,000 IRMLS
- 2025-09-15 Price Changed $274,900 IRMLS
- 2025-08-22 Price Changed $279,000 IRMLS
- 2025-07-18 Price Changed $284,500 IRMLS
- 2025-07-10 Listed $298,500 IRMLS
- 2024-04-26 Sold (Public Records) $151,070 Public Records
- 2015-05-05 Sold (MLS) $145,000 IRMLS
- 2015-01-06 Listed $145,000 IRMLS
Property tax history
+4.1%/yrLatest (2024): $2,025 · +6.0% YoY. Source: county tax records.
Cash-flow waterfall
monthlySold comps — $/sqft
last 12 mo · ≤1 miLoading sold comps…