2323 47th Ave NE · Salem, OR
Flood risk 1/10 · Minimal
- FEMA flood zone
- X (unshaded)
- Chance of flooding over 30 yrs
- 0.0%
- Est. flood insurance / yr
- $507 – $1,088
Fire risk 1/10 · Minimal
- Est. fire insurance / yr
- $498 – $926
Heat risk 3/10 · Minor
- Hot days now (above 92°F)
- 7 days/yr
- Hot days in 30 yrs
- 14 days/yr
Wind risk 1/10 · Minimal
- Chance of severe wind over 30 yrs
- —
Air-quality risk 10/10 · Severe
- Unhealthy air days now
- 13 days/yr
- Unhealthy air days in 30 yrs
- 14 days/yr
Risk factors via First Street. Map © Google.
Why this score? — see what drove the B grade
The composite is a weighted blend of 9 inputs, each scored 0–100. Each bar is that input's sub-score; the figure is the points it added to the 100-point composite (weight × sub-score).
- Cash flow +30.0/30.0
- 1% rule +10.0/10.0
- DSCR +10.0/10.0
- ARV discount +9.6/15.0
- Livability +4.0/5.0
- Schools +3.7/10.0
- Rent growth +2.5/5.0
- Condition / age +2.5/5.0
- Appreciation +0.0/10.0
$100,000
🖨 Deal sheet (PDF) 📄 Offer letter ✓ Due diligence
Listing remarks MLS
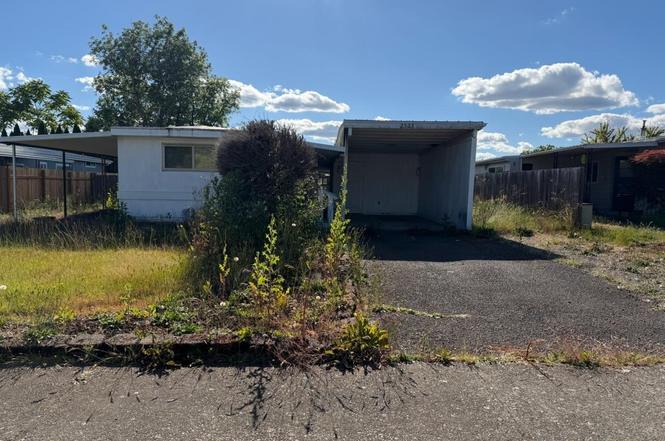
Existing manufactured home sustained fire damage and potential environmental risks contributing no value to the property. Home will need to be removed by buyer after closing. Great opportunity to place a new manufactured home, subject to HOA and applicable approval requirements.HOA amenities include clubhouse, Billiard room, pool access, RV lot for additional fee. Buyer to perform due diligence regarding removal and replacement options and community requirements. Do not go on property without agent present.
Key facts
- Pool access
- Clubhouse
- Billiard room
Tags
Property features AI
Finance
- Other: Lot approximately 5,000–6,999 sq ft (about 0.12 acres); Parcel number 126851
- HOA & community: Managed by Greentree Community Association; Quarterly association fee of $150
Exterior
- Utilities: Electricity; Public water; Public sewer
- Home design: Manufactured home on permanent foundation; Single-story (main living on one level); Residential property in fixer condition; No notable view
- Construction: Built in 1975
- Exterior features: Aluminum exterior; Metal siding; Metal roof
Interior
- Kitchen: Kitchen on main level
- Bedrooms: Primary bedroom on main level; Second bedroom
- Bathrooms: One full bathroom (main level)
- Heating & cooling: Forced air heating; No central cooling
- Interior features: Family room; Dining room; Living room; Great room
Neighborhood map
What this means for you Summary
Snapshot
- This is a 2-bed/1.0-bath manufactured listed at $100k.
Deal economics
- At list price, monthly cash flow is $602 ($7k/yr) — positive.
- The deal already cash-flows at list — no discount required.
- Meets the 1% rule at list price ($2k rent vs $100k).
- Cap rate 13.5% vs local median 2.9% in Salem — top-decile yield for the area; either an underpriced asset or a hidden risk that comps aren't pricing in. Stress-test before assuming the spread holds.
Location & tenants
- Location reads 79/100 on livability (#59 in OR, #2,084 nationally) — a middle-class / working-renter tenant base. Strengths: amenities A+, commute A+, housing A+; Watch: crime F.
- Salem-Keizer SD 24J (urban): math 34% / reading 47% proficiency, ranked #103 of 183 in OR (top 56%) — families likely to look elsewhere, expect single-tenant / working-renter base with shorter leases.
- Zoned schools: Cesar E Chavez Elementary (573 students, 69% FRL); Stephens Middle School (1,024 students, 72% FRL); Mckay High School (2,311 students, 102% FRL) — zoned schools average 81% FRL vs 53% district-wide (28 pts higher); higher-poverty schools than district average — tighter screening recommended.
- Market conditions: 176 active listings in the ZIP; 40 comparable units currently listed for rent nearby; rentals at typical pace (median 25d on market — plan ~3-4 weeks tenant-placement turnaround); 1,591 units permitted in Marion County in 2024 (716 in 5+ unit buildings).
Forward outlook
- Local home prices are declining (-3.0%/yr); year-one equity from $691 of loan paydown is wiped out by about $3k of value loss. Plan a longer hold.
- Marion County population projected at +17% by 2050 — long-run rental-demand tailwind backs the buy-and-hold thesis.
- At projected returns (-3.0% appreciation + 3.0% rent growth), your $28k cash investment doubles in ~5 years — after that, you're playing with house money.
Negotiation context
- Only 4 days on market — expect competitive offers; lowballing is unlikely to land.
- 3 sale attempts since 2y ago with the ask held roughly flat each time — persistent listings suggest the price (not the market) is what's stuck; bring a comps-based counter.
Questions for the listing agent
- Built in 1975 — when were the roof, HVAC, electrical panel, plumbing, and water heater last replaced?
- What does the HOA fee cover, when was the last increase, and are there any pending special assessments or reserve-fund shortfalls?
- Is there a deadline driving the sale (1031 exchange, divorce, estate, relocation)? That informs how much negotiation room exists.
- Schools are D-rated, which usually means shorter tenancies and higher turnover. Who's the typical renter profile here, and what's been the actual vacancy rate?
- Crime grade is F in this area — have there been break-ins, vandalism, or insurance claims at this property in the last 3 years? What carrier currently insures it and at what premium?
- What's the average days-on-market for RENTAL listings here right now (not sales)? A rising rental-DOM trend means longer vacancies and softer asking-rent achievability than the comps imply.
- What's the recent tenant-quality profile in this submarket — average credit score on applications, eviction rate, late-payment / NSF rate, and stable-employment percentage? A property-management company in the area should have these aggregated.
- How much new for-sale + rental construction is in the pipeline within 1–3 miles? Heavy new supply typically softens prices + rents 12–24 months out; constrained supply supports both.
Investment metrics
- 1% rule
- 1.57% ✓
- Cap rate
- 13.51%
- Cash-on-cash
- 25.79%
- DSCR
- 2.15
- GRM
- 5.3
CMA / ARV
- ARV (on-the-fly)
- $104,958
- Comps found
- 12
Show comp detail 12 sales within ~0.75 mi
| Address | Dist | Beds/Ba | Sqft | Sold | Price | $/sf | Match |
|---|---|---|---|---|---|---|---|
| 2163 47th Ct NE | 0.11mi | 2/1.5 | 1,029 (0%) | 2mo | $150,000 | $146 | 92 |
| 1935 Icabod St NE | 0.28mi | 2/2.0 | 1,056 (+3%) | 2mo | $210,000 | $199 | 77 |
| 3054 Surfwood Dr | 0.60mi | 3/2.0 (+1) | 1,026 (-0%) | 2mo | $325,000 | $317 | 61 |
| 4490 Angie Marie Way | 0.39mi | 2/2.0 | 1,080 (+5%) | 10mo | $83,500 | $77 | 61 |
| 4490 Angie Marie Way #16 | 0.39mi | 2/2.0 | 1,080 (+5%) | 10mo | $83,900 | $78 | 61 |
| 4585 Angie Marie Way NE | 0.35mi | 2/2.0 | 1,109 (+8%) | 10mo | $89,000 | $80 | 58 |
| 1736 Icabod Ct | 0.45mi | 2/1.0 | 960 (-7%) | 13mo | $300,000 | $313 | 57 |
| 4915 Swegle Rd #63 | 0.56mi | 2/2.0 | 950 (-8%) | 5mo | $73,500 | $77 | 53 |
| 4915 Swegle Rd NE #15 | 0.56mi | 3/2.0 (+1) | 1,152 (+12%) | 2mo | $57,500 | $50 | 43 |
| 4915 Swegle Rd NE #45 | 0.56mi | 2/2.0 | 1,152 (+12%) | 8mo | $56,300 | $49 | 43 |
| 3134 Comber Ct NE | 0.65mi | 2/1.5 | 924 (-10%) | 14mo | $94,000 | $102 | 39 |
| 3232 Sandal Ct NE | 0.73mi | 2/2.0 | 1,152 (+12%) | 9mo | $237,500 | $206 | 34 |
Match score weights: distance 35% · size 25% · config 20% · recency 20%. Top-matched comps best support the ARV.
Projected returns pro-forma
-3.0% appreciation · 3.0% rent growth · sell at horizon
- IRR
- 19.4%
- Equity multiple
- 1.79×
- Total profit
- $22,111
- Equity at exit
- $14,910
- IRR
- 27.7%
- Equity multiple
- 3.45×
- Total profit
- $68,562
- Equity at exit
- $8,646
Cash invested: $28,000 (down + closing). Projections, not guarantees.
Landlord ↔ Tenant lean methodology
- Overall (STATE)
- 28 Tenant-Leaning
- State Oregon
- 28 Tenant-Leaning · D+6
- County
- — inherits STATE
- City
- — inherits STATE
ZIP-level market 97305
- Active inventory
- 176
- Price-to-rent
- 5.3×
Monthly cashflow live
- Estimated rent
- $1,566 high interval (Pro) →
- Mortgage (P&I)
- −$524
- Tax from tax record
- −$19 /mo · $231/yr
- Insurance
- −$42
- HOA
- −$50
- Vacancy / Maint / Mgmt
- −$329
- Net cashflow
- $602
Break-even live
Sensitivity live
| Price | -10% $658 | -5% $630 | +0% $602 | +5% $573 | +10% $545 |
|---|---|---|---|---|---|
| Rent | -10% $478 | -5% $540 | +0% $602 | +5% $664 | +10% $725 |
| Rate | -1.0pp $652 | -0.5pp $627 | base $602 | +0.5pp $576 | +1.0pp $549 |
UW: 25.0% down · 7.5% · 30yr · 1.5% tax · 5.0% vac · 8.0% maint · 8.0% mgmt
Financing live
Cash to close
- Down payment
- $25,000
- Closing costs
- $3,000
- Reserves months
- —
- Total cash needed
- —
Loan-product check · same deal, 3 products live
Conventional
25% down · 7.5% · 30yr
- Down + closing
- —
- Monthly P&I
- —
- Monthly cashflow
- —
- DSCR
- —
- Eligible?
- —
Personal DTI + credit; lowest rate.
DSCR
20% down · 8.5% · 30yr
- Down + closing
- —
- Monthly P&I
- —
- Monthly cashflow
- —
- DSCR
- —
- Eligible?
- —
No personal income docs; deal must DSCR.
Hard money
10% down · 12.0% · 12mo
- Down + closing
- —
- Monthly P&I
- —
- Monthly cashflow
- —
- DSCR
- —
- Eligible?
- —
Short-term bridge; refi at stabilization.
Rent comps 40 comps
| Address | Beds | Baths | Sqft | Rent | $/sqft | DOM | Units | Dist |
|---|---|---|---|---|---|---|---|---|
| 4768 El Cedro Loop NE Salem, OR | 3.0 | 2.0 | 1344 | $1,895 | $1.41 | 45d | 1 | 0.08mi |
| 4359 Rodeo Dr NE Salem, OR | 3.0 | 2.0 | 1170 | $2,245 | $1.92 | 23d | 1 | 0.40mi |
| 1973 45th Ave NE Salem, OR | 2.0 | 1.0–2.0 | 1043 | $1,360 | $1.30 | 15d | 2 | 0.44mi |
| 4889 Saunter Loop NE Salem, OR | 3.0 | 1.5 | 1186 | $1,925 | $1.62 | 45d | 1 | 0.45mi |
| 4252 Ash Grove Dr NE Salem, OR | 3.0 | 2.0 | 1357 | $2,100 | $1.55 | 15d | 1 | 0.60mi |
| 4824 Falcon Ct NE Salem, OR | 3.0 | 1.5 | 1246 | $1,995 | $1.60 | 25d | 1 | 0.61mi |
| 4200 Sunnyview Rd NE Salem, OR | 2.0 | 1.0–2.0 | 880 | $1,445 | $1.64 | 25d | 1 | 0.63mi |
| 4154 Sunnyview Rd NE Salem, OR | 1.0–2.0 | 1.0 | 806 | $1,375 | $1.71 | 15d | 6 | 0.72mi |
| 2500 Lancaster Dr NE Salem, OR | 1.0–2.0 | 1.0 | 771 | $1,350 | $1.75 | 15d | 11 | 0.75mi |
| 2500 Lancaster Dr NE Unit 35 Salem, OR | 2.0 | 1.0 | 890 | $1,295 | $1.46 | 45d | 1 | 0.75mi |
| 4712 Silverton Rd NE Salem, OR | 2.0 | 2.0 | 952 | $1,495 | $1.57 | 15d | 5 | 0.79mi |
| 4116 Market St NE Salem, OR | 2.0 | 1.0 | 858 | $1,350 | $1.57 | 45d | 1 | 0.81mi |
| 4116 Market St NE Salem, OR | 2.0 | 1.0 | 858 | $1,350 | $1.57 | 15d | 1 | 0.81mi |
| 4098 Market St NE Unit MT21 Salem, OR | 2.0 | 1.0 | 900 | $1,275 | $1.42 | 25d | 1 | 0.83mi |
| 4840 Cheryl Lynn Way NE Salem, OR | 2.0 | 1.0 | 756 | $1,100 | $1.46 | 15d | 2 | 0.87mi |
| 3563 Silver Park Pl NE Salem, OR | 2.0 | 1.0 | 828 | $1,080 | $1.30 | 45d | 1 | 0.88mi |
| 3910-3930 Sunnyview Rd NE Salem, OR | 3.0 | 2.5 | 1300 | $1,845 | $1.42 | 15d | 6 | 0.91mi |
| 2489 Coral Ave NE Salem, OR | 1.0–2.0 | 1.0 | 817 | $1,301 | $1.59 | 15d | 11 | 0.92mi |
| 3654 47th Ave NE Unit 3654-D Salem, OR | 2.0 | 1.0 | 900 | $1,150 | $1.28 | 45d | 1 | 0.95mi |
| 4470 Conser Way NE Salem, OR | 2.0 | 2.0 | 925 | $1,395 | $1.51 | 15d | 3 | 0.96mi |
| 3864 Sunnyview Rd NE Salem, OR | 2.0 | 1.0 | 835 | $1,135 | $1.36 | 15d | 7 | 0.98mi |
| 3739 Beverly Ave NE Salem, OR | 2.0 | 1.0 | 838 | $1,275 | $1.52 | 23d | 2 | 0.98mi |
| 3450 Silvercedar Pl NE Salem, OR | 2.0 | 1.0 | 828 | $1,105 | $1.33 | 45d | 1 | 1.00mi |
| 2800 Fisher Rd NE Salem, OR | 2.0 | 1.0 | 856 | $1,270 | $1.48 | 23d | 2 | 1.00mi |
| 3240 Harold Dr NE Salem, OR | 1.0–3.0 | 1.0–2.0 | 972 | $1,572 | $1.62 | 25d | 13 | 1.00mi |
| 3240 Harold Dr NE Unit 3236-311 Salem, OR | 2.0 | 2.0 | 1060 | $1,650 | $1.56 | 45d | 1 | 1.00mi |
| 3240 Harold Dr NE Unit 3260-302 Salem, OR | 1.0 | 1.0 | 752 | $1,295 | $1.72 | 45d | 1 | 1.00mi |
| 3240 Harold Dr NE Unit 3255-122 Salem, OR | 3.0 | 2.0 | 1192 | $1,850 | $1.55 | 45d | 1 | 1.00mi |
| 4455 Seaton Ln NE Salem, OR | 2.0–3.0 | 2.0 | 1087 | $1,241 | $1.14 | 15d | 5 | 1.03mi |
| 3454 Chiefs Ct NE Salem, OR | 2.0 | 1.5 | 880 | $1,650 | $1.88 | 25d | 1 | 1.03mi |
| 4495 Pacifica Way NE Salem, OR | 2.0 | 2.0 | 900 | $1,445 | $1.61 | 15d | 1 | 1.10mi |
| 1415 Lancaster Dr NE Unit 16 Salem, OR | 2.0 | 1.0 | 850 | $1,250 | $1.47 | 45d | 1 | 1.11mi |
| 1415 Lancaster Dr NE Unit 33 Salem, OR | 2.0 | 1.0 | 850 | $1,225 | $1.44 | 45d | 1 | 1.11mi |
| 1415 Lancaster Dr NE Unit 18 Salem, OR | 2.0 | 1.0 | 850 | $1,200 | $1.41 | 45d | 1 | 1.11mi |
| 3211 Autumn Chase Way NE Unit 330-09203 Salem, OR | 2.0 | 1.0 | 916 | $1,300 | $1.42 | 25d | 1 | 1.12mi |
| 3211 Autumn Chase Way NE Unit 330-10204 Salem, OR | 2.0 | 1.0 | 916 | $1,400 | $1.53 | 25d | 1 | 1.12mi |
| 1415 Lancaster Dr NE Unit 21 Salem, OR | 2.0 | 1.0 | 850 | $1,225 | $1.44 | 15d | 1 | 1.12mi |
| 3420 Monarch Dr NE Unit 3422 Salem, OR | 2.0 | 1.0 | 910 | $1,250 | $1.37 | 15d | 1 | 1.17mi |
| 3370 Beacon Ct NE Salem, OR | 3.0 | 1.0 | 936 | $2,100 | $2.24 | 45d | 1 | 1.23mi |
| 2015 Debbie Way NE Unit 2045 Salem, OR | 3.0 | 1.0 | 1008 | $1,825 | $1.81 | 15d | 1 | 1.27mi |
HOA detail
- Monthly dues
- $50 · $600/yr
- Likely covers
- cablepool
Listing history 3 events
-
2026-06-21days on market $100,000 Active 4 DOM
-
2026-06-18remarks 513-char remark
-
2026-06-18$100,000 Active 1 DOM
ⓘ Source: listings_history table (triggers on properties + properties_extension) + one-shot
backfill from property_details.listing_events for pre-trigger history.
Tax reassessment forecast OR · Resets to sale price
- Current annual tax
- $231 · $19/mo
- Projected year-2 tax
- $970 · $81/mo
- Expected delta
- +$739/yr (+$62/mo · 320.1%)
ⓘ Screening estimate from a state-policy table — verify with the county assessor before closing.
Climate risk First Street
- Flood 1/10 Low FEMA zone X (unshaded) · 0% chance over 30 yrs
- Wildfire 1/10 Low
- Heat 3/10 Moderate 7 d/yr ≥92°F today · 14 d/yr by 30 yrs out
- Wind 1/10 Low
- Air quality 10/10 Extreme 13 unhealthy d/yr today · 14 by 30 yrs out
Nearby sold comps map
Loading sold comps map…
Walkable amenities ~0.75 mi
Loading nearby amenities…
Taxation est. · year 1
- Rental income
- $18,791
- − Mortgage interest
- −$5,602
- − Property taxes
- −$231
- − Insurance
- −$500
- − Repairs & maintenance
- −$1,503
- − Management
- −$1,503
- − HOA
- −$600
- − Depreciation
- −$2,909
- Taxable income
- $5,943
- Est. tax owed @ 24.0%
- −$1,426
- After-tax cash flow
- $5,795/yr
For passive investors: Depreciation is non-cash, so a rental often shows a tax loss while cash-flowing — sheltering income. Rental losses are passive: they offset passive income freely, and up to $25,000/yr can offset ordinary (W-2) income if you actively participate and your MAGI is under $100k (phasing out to $0 by $150k); unused losses carry forward. On sale, claimed depreciation is recaptured at up to 25%, and gains may owe capital-gains tax (a 1031 exchange can defer both). Figures are a year-1 estimate at your 24.0% rate — not tax advice; consult a CPA.
Schools (NCES district)
- District
- Salem-Keizer SD 24J
- NCES district ID
- 4110820
- Math proficiency
- 34% ▼ -1.00%
- Reading proficiency
- 47% ▼ -2.00%
- Median HH income
- $48,632
- Composite
- 37.16/100
- National rank
- #9017
- State rank
- #103 of 183 in OR
Livability — Salem
- Score
- 79/100
- State rank
- #59
- US rank
- #2084
Category grades
Schools grade is shown separately in the Schools card above.
Census & demographics
- Census place
- Salem, OR
- City population
- 193,601
- Population (ZIP)
- 45,044
Population outlook (Marion County) Hauer SSP2
- Today (2025)
- 360,940 people
- By 2030
- 375,178 · +3.9%
- By 2040
- 400,914 · +11.1%
- By 2050
- 422,187 · +17.0%
- By 2075
- 460,305 · +27.5%
- By 2100
- 464,025 · +28.6%
Race, ethnicity, and origin ACS 2023
- Neighborhood character
- Diverse neighborhood (Simpson 0.61)
- Race & ethnicity
- Hispanic / Latino 44% White 44% Two or more races 16% Asian 3% Pacific Islander 3% Native American 3% Black 1%
- Hispanic origin (detail)
- Mexican 41%
- Common ancestry
- Italian 2% Slovak 2% Scotch-Irish 2%
- Foreign-born
- 23% · Canada, China
- Languages at home
- 57% English-only · Spanish 35% Other Asian/Pacific 3% Russian/Polish/Slavic 2%
Political lean MEDSL · Marion
- 2024 margin
- Toss-up / Even · D 47.5% · R 49.5% · Other 3.0%
- 2008→2024 swing
- -4.2pp toward R · 2008: 2.2pp · 2024: -2.0pp
- All cycles
- 2024: R+2.0 2020: D+1.1 2016: R+5.0 2012: R+3.5 2008: D+2.2
Not yet ingested
- Civics
- —
Market trends
- HPI YoY
- ▼ -328.50%
- Current HPI
- 296.3428
- Rent YoY
- —
- Metro
- —
- State GDP YoY
- ▲ 2.05%
- F500 in state
- 2
Industry mix (Fortune 500 HQ in OR)
| Industry | F500 HQs | Revenue |
|---|---|---|
| Consumer Goods | 1 | $51B |
|
||
Price history
-33.3% since first listed5 events — show timeline
- 2026-06-17 Listed $100,000 RMLS
- 2026-06-17 Listed $100,000 WVMLS
- 2024-06-19 Listing Removed — WVMLS
- 2024-06-10 Contingent — WVMLS
- 2024-06-07 Listed $149,900 WVMLS
Property tax history
+4.9%/yrLatest (2020): $231 · +3.6% YoY. Source: county tax records.
Cash-flow waterfall
monthlySold comps — $/sqft
last 12 mo · ≤1 miLoading sold comps…