 🏗️ New Construction
Ashville Plan · Daytona Beach, FL
Flood risk 6/10 · Moderate
- FEMA flood zone
- X (unshaded)
- Chance of flooding over 30 yrs
- 0.56%
- Est. flood insurance / yr
- $507 – $1,088
Fire risk 2/10 · Minimal
- Est. fire insurance / yr
- $947 – $1,759
Heat risk 9/10 · Severe
- Hot days now (above 105°F)
- 4 days/yr
- Hot days in 30 yrs
- 11 days/yr
Wind risk 10/10 · Severe
- Chance of severe wind over 30 yrs
- 99.0%
Air-quality risk 2/10 · Minimal
- Unhealthy air days now
- 2 days/yr
- Unhealthy air days in 30 yrs
- 2 days/yr
Risk factors via First Street. Map © Google.
Why this score? — see what drove the B grade
The composite is a weighted blend of 9 inputs, each scored 0–100. Each bar is that input's sub-score; the figure is the points it added to the 100-point composite (weight × sub-score).
- Cash flow +30.0/30.0
- DSCR +10.0/10.0
- 1% rule +9.0/10.0
- ARV discount +7.5/15.0
- Livability +4.2/5.0
- Schools +3.9/10.0
- Condition / age +3.8/5.0
- Rent growth +2.0/5.0
- Appreciation +0.0/10.0
$131,900
🖨 Deal sheet 📄 Offer letter ✓ Due diligence
Listing remarks
55+ age qualified community. Active senior community, 40+. Call office for details! Discover the Ashville model - a remarkable energy-certified home that boasts a smart thermostat and an upgraded LED lighting package. With a split floor plan, this stunning residence features two cozy bedrooms at the front of the house, while the luxurious master suite is privately tucked away at the rear. The well-appointed kitchen showcases a generously-sized center island, complete with cabinetry and seating, as well as a stainless steel farmhouse sink with a convenient pulldown gooseneck faucet that marries functionality with beauty. An ample dining area adjacent to the kitchen is perfect for entertain
Key facts
- Split floor plan
- Smart thermostat
- Center island
Tags
Neighborhood map
What this means for you Summary
Snapshot
- This is a 3-bed/2.0-bath manufactured listed at $132k. Condition is rated good.
Deal economics
- At list price, monthly cash flow is $547 ($7k/yr) — positive.
- The deal already cash-flows at list — no discount required.
- Meets the 1% rule at list price ($2k rent vs $132k).
- Recommended offer: $124k (6.0% below list) — sets the bar for market timing.
Location & tenants
- Location reads 83/100 on livability (#46 in FL, #867 nationally) — a professional / high-income tenant draw. Strengths: amenities A+, commute A+, cost of living A+; Watch: schools D+, employment D-.
- Volusia (suburban): math 44% / reading 49% proficiency, ranked #47 of 73 in FL (top 64%) — families likely to look elsewhere, expect single-tenant / working-renter base with shorter leases.
- Market conditions: Rents soft (-2.0%/yr); 280 active listings in the ZIP; 28 comparable units currently listed for rent nearby; rentals at typical pace (median 19d on market — plan ~3-4 weeks tenant-placement turnaround); 3,402 units permitted in Volusia County in 2024 (681 in 5+ unit buildings).
- This rent runs 39% of the median local income ($57k/yr) — at the standard rent-burdened threshold; future hikes will face affordability resistance.
Forward outlook
- Local home prices are declining (-3.0%/yr); year-one equity from $912 of loan paydown is wiped out by about $4k of value loss. Plan a longer hold.
- Volusia County population projected at +19% by 2050 — long-run rental-demand tailwind backs the buy-and-hold thesis.
- At projected returns (-3.0% appreciation + 0.0% rent growth), your $37k cash investment doubles in ~10 years — after that, you're playing with house money.
Negotiation context
- It's been on market 84 days — a 6% lower offer ($124k) is reasonable based on typical stale-listing flexibility.
Risks & watch-outs
- Climate carrying-cost: major flood risk; severe wind risk, 99% chance of damaging wind over 30y; extreme-heat days projected 4→11/yr by 2055 (HVAC capex compounding) — expect insurance premiums to compound above CPI over the hold.
Questions for the listing agent
- It's been on market 84 days. Have you received any prior offers? Is the seller open to a 6% concession, seller financing, or rate buy-down credit?
- Why hasn't it sold? Are there any deal-killer items the seller is aware of (foundation, flood, title, zoning, code violations)?
- Is there a deadline driving the sale (1031 exchange, divorce, estate, relocation)? That informs how much negotiation room exists.
- Schools are D-rated, which usually means shorter tenancies and higher turnover. Who's the typical renter profile here, and what's been the actual vacancy rate?
- What's the average days-on-market for RENTAL listings here right now (not sales)? A rising rental-DOM trend means longer vacancies and softer asking-rent achievability than the comps imply.
- What's the recent tenant-quality profile in this submarket — average credit score on applications, eviction rate, late-payment / NSF rate, and stable-employment percentage? A property-management company in the area should have these aggregated.
- How much new for-sale + rental construction is in the pipeline within 1–3 miles? Heavy new supply typically softens prices + rents 12–24 months out; constrained supply supports both.
Investment metrics
- 1% rule
- 1.40% ✓
- Cap rate
- 11.27%
- Cash-on-cash
- 17.77%
- DSCR
- 1.79
- GRM
- 6.0
CMA / ARV
No comps found within radius.
Projected returns pro-forma
-3.0% appreciation · 0.0% rent growth · sell at horizon
- IRR
- 5.8%
- Equity multiple
- 1.22×
- Total profit
- $8,081
- Equity at exit
- $19,667
- IRR
- 12.3%
- Equity multiple
- 1.84×
- Total profit
- $31,098
- Equity at exit
- $11,404
Cash invested: $36,932 (down + closing). Projections, not guarantees.
Landlord ↔ Tenant lean methodology
- Overall (STATE)
- 87 Strongly Landlord-Friendly
- State Florida
- 87 Strongly Landlord-Friendly · R+3
- County
- — inherits STATE
- City
- — inherits STATE
ZIP-level market 32119
- Rents YoY
- -2.0%
- Active inventory
- 280
- Price-to-rent
- 6.0×
Monthly cashflow live
- Estimated rent
- $1,846 high interval (Pro) →
- Mortgage (P&I)
- −$692
- Tax est. 1.5%
- −$165 /mo · $1,978/yr
- Insurance
- −$55
- HOA
- −$0
- Vacancy / Maint / Mgmt
- −$388
- Net cashflow
- $547
Break-even live
UW: 25.0% down · 7.5% · 30yr · 1.5% tax · 5.0% vac · 8.0% maint · 8.0% mgmt
Financing live
Cash to close
- Down payment
- $32,975
- Closing costs
- $3,957
- Reserves months
- —
- Total cash needed
- —
Loan-product check · same deal, 3 products live
Conventional
25% down · 7.5% · 30yr
- Down + closing
- —
- Monthly P&I
- —
- Monthly cashflow
- —
- DSCR
- —
- Eligible?
- —
Personal DTI + credit; lowest rate.
DSCR
20% down · 8.5% · 30yr
- Down + closing
- —
- Monthly P&I
- —
- Monthly cashflow
- —
- DSCR
- —
- Eligible?
- —
No personal income docs; deal must DSCR.
Hard money
10% down · 12.0% · 12mo
- Down + closing
- —
- Monthly P&I
- —
- Monthly cashflow
- —
- DSCR
- —
- Eligible?
- —
Short-term bridge; refi at stabilization.
Rent comps 28 comps
| Address | Beds | Baths | Sqft | Rent | $/sqft | DOM | Units | Dist |
|---|---|---|---|---|---|---|---|---|
| 10 Harbor Cove Ct Daytona Beach, FL | 3.0 | 2.0 | 1456 | $1,499 | $1.03 | 23d | 1 | 0.17mi |
| 17 Kimberly Ct Daytona Beach, FL | 2.0 | 2.0 | 896 | $1,299 | $1.45 | 23d | 1 | 0.18mi |
| 2208 Flourescent Way South Daytona, FL | 3.0 | 2.5 | 1400 | $2,300 | $1.64 | 23d | 1 | 0.56mi |
| 900 Boulder Dr South Daytona, FL | 2.0 | 1.0 | 939 | $1,850 | $1.97 | 23d | 1 | 0.58mi |
| 2313 Incandescent Way Unit 1 South Daytona, FL | 3.0 | 2.5 | 1500 | $1,900 | $1.27 | 14d | 1 | 0.62mi |
| 2085 Oak Meadow Cir South Daytona, FL | 3.0 | 2.0 | 1632 | $1,900 | $1.16 | 14d | 1 | 0.65mi |
| 1505 Edgewater Rd Daytona Beach, FL | 3.0 | 2.0 | 1209 | $1,800 | $1.49 | 23d | 1 | 0.69mi |
| 1952 Menger Cir South Daytona, FL | 3.0 | 2.0 | 1600 | $2,300 | $1.44 | 23d | 1 | 0.73mi |
| 1756 S Clyde Morris Blvd Daytona Beach, FL | 1.0–2.0 | 1.0–2.0 | 850 | $1,650 | $1.94 | 23d | 8 | 0.74mi |
| 793 Aspen Dr South Daytona, FL | 2.0 | 2.0 | 1300 | $1,940 | $1.49 | 23d | 1 | 0.78mi |
| 716 Boston Ave South Daytona, FL | 2.0 | 2.0 | 1373 | $2,100 | $1.53 | 14d | 1 | 0.84mi |
| 1400 Hancock Blvd Daytona Beach, FL | 1.0–2.0 | 1.0–2.0 | 800 | $1,483 | $1.85 | 11d | 11 | 0.86mi |
| 121 Westwood Dr Daytona Beach, FL | 3.0 | 2.0 | 1548 | $2,300 | $1.49 | 14d | 1 | 0.87mi |
| 1436 Suwanee Rd Daytona Beach, FL | 4.0 | 2.0 | 1823 | $2,500 | $1.37 | 23d | 1 | 0.90mi |
| 1420 New Bellevue Ave Daytona Beach, FL | 1.0–2.0 | 1.0–2.0 | 800 | $1,554 | $1.94 | 11d | 9 | 0.94mi |
| 1200 Floral Springs Blvd Port Orange, FL | 1.0–3.0 | 1.0–2.0 | 1047 | $2,175 | $2.08 | 11d | 81 | 1.00mi |
| 110 Dolphin Fleet Cir Daytona Beach, FL | 1.0–3.0 | 1.0–2.5 | 1125 | $2,124 | $1.89 | 11d | 20 | 1.04mi |
| 100 Lakewood Village Cir Daytona Beach, FL | 2.0 | 1.5 | 1212 | $1,800 | $1.49 | 14d | 1 | 1.05mi |
| 910 Carey Dr South Daytona, FL | 3.0 | 2.0 | 1529 | $2,500 | $1.64 | 23d | 1 | 1.10mi |
| 1270 Reed Canal Rd Port Orange, FL | 1.0–3.0 | 1.0–2.0 | 1001 | $2,137 | $2.13 | 11d | 29 | 1.20mi |
| 1174 Margina Ave Daytona Beach, FL | 3.0 | 2.0 | 1190 | $2,340 | $1.97 | 23d | 1 | 1.21mi |
| 535 Olive St South Daytona, FL | 2.0 | 1.0 | 1024 | $1,725 | $1.68 | 11d | 1 | 1.25mi |
| 3537 Forest Branch Dr Unit A Port Orange, FL | 3.0 | 2.0 | 1352 | $1,950 | $1.44 | 11d | 1 | 1.27mi |
| 524 Pelican Bay Dr Daytona Beach, FL | 3.0 | 2.0 | 1768 | $2,095 | $1.18 | 14d | 1 | 1.34mi |
| 524 Pelican Bay Dr Daytona Beach, FL | 3.0 | 2.0 | 1768 | $2,095 | $1.18 | 23d | 1 | 1.34mi |
| 1401 Reed Canal Rd Port Orange, FL | 1.0–3.0 | 1.0–2.0 | 1045 | $2,125 | $2.03 | 14d | 25 | 1.37mi |
| 940 Lockhart St Daytona Beach, FL | 3.0 | 2.0 | 1071 | $1,850 | $1.73 | 19d | 1 | 1.48mi |
| 122 Blue Heron Dr Unit D Daytona Beach, FL | 2.0 | 2.0 | 1242 | $1,750 | $1.41 | 23d | 1 | 1.48mi |
Listing history 15 events
-
2026-06-18days on market $131,900 Active 84 DOM
-
2026-06-17days on market $131,900 Active 83 DOM
-
2026-06-16days on market $131,900 Active 82 DOM
-
2026-06-15days on market $131,900 Active 81 DOM
-
2026-06-14days on market $131,900 Active 79 DOM
-
2026-06-10pricedays on market $131,900 Active 76 DOM
-
2026-06-09days on market $133,900 Active 75 DOM
-
2026-06-08days on market $133,900 Active 74 DOM
-
2026-06-07days on market $133,900 Active 73 DOM
-
2026-06-05days on market $133,900 Active 70 DOM
-
2026-06-03days on market $133,900 Active 69 DOM
-
2026-06-03days on market $133,900 Active 68 DOM
-
2026-06-01days on market $133,900 Active 67 DOM
-
2026-05-31days on market $133,900 Active 66 DOM
-
2026-05-31days on market $133,900 Active 65 DOM
ⓘ Source: listings_history table (triggers on properties + properties_extension) + one-shot
backfill from property_details.listing_events for pre-trigger history.
Climate risk First Street
- Flood 6/10 Major FEMA zone X (unshaded) · 56% chance over 30 yrs
- Wildfire 2/10 Low
- Heat 9/10 Extreme 4 d/yr ≥105°F today · 11 d/yr by 30 yrs out
- Wind 10/10 Extreme 99% chance of damaging wind over 30 yrs
- Air quality 2/10 Low 2 unhealthy d/yr today · 2 by 30 yrs out
Nearby sold comps map
Loading sold comps map…
Walkable amenities ~0.75 mi
Loading nearby amenities…
Taxation est. · year 1
- Rental income
- $22,154
- − Mortgage interest
- −$7,388
- − Property taxes
- −$1,978
- − Insurance
- −$660
- − Repairs & maintenance
- −$1,772
- − Management
- −$1,772
- − Depreciation
- −$3,837
- Taxable income
- $4,746
- Est. tax owed @ 24.0%
- −$1,139
- After-tax cash flow
- $5,425/yr
For passive investors: Depreciation is non-cash, so a rental often shows a tax loss while cash-flowing — sheltering income. Rental losses are passive: they offset passive income freely, and up to $25,000/yr can offset ordinary (W-2) income if you actively participate and your MAGI is under $100k (phasing out to $0 by $150k); unused losses carry forward. On sale, claimed depreciation is recaptured at up to 25%, and gains may owe capital-gains tax (a 1031 exchange can defer both). Figures are a year-1 estimate at your 24.0% rate — not tax advice; consult a CPA.
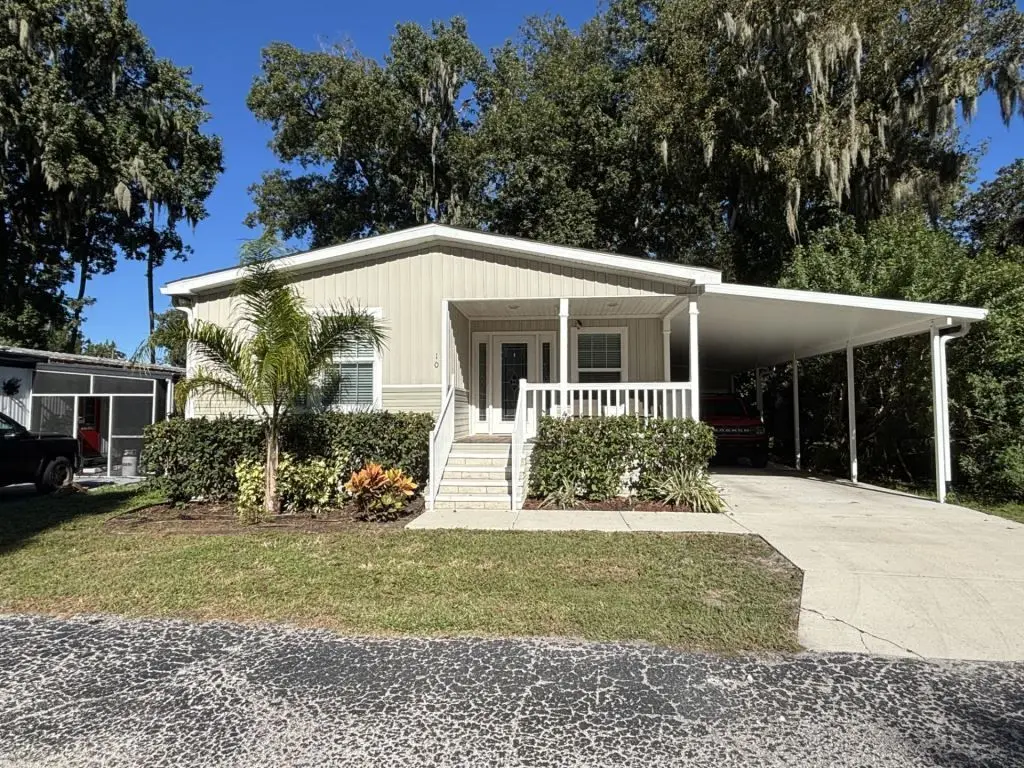
Condition & rehab AI · 1 photo
This Ashville model manufactured home in Daytona Beach, FL, is in good condition with a good exterior and interior. It has a split floor plan and energy-efficient features. A fresh coat of paint on the exterior siding and a thorough gutter inspection would significantly enhance its curb appeal and value.
Value-add opportunities
- Both Paint exterior siding — Enhances curb appeal and can increase both resale and rental value.
- Both Inspect and clean gutters — Prevents water damage and improves the home's overall appearance, boosting both resale and rental value.
Renovation cost estimate screening
Value-add ROI direction
- Both Paint exterior siding — Enhances curb appeal and can increase both resale and rental value. ↑
- Both Inspect and clean gutters — Prevents water damage and improves the home's overall appearance, boosting both resale and rental value. ↑
ⓘ Cost ranges are severity-bucket heuristics (US national rule-of-thumb). Get contractor quotes + a written scope before underwriting a rehab budget.
Schools (NCES district)
- District
- Volusia
- NCES district ID
- 1201920
- Math proficiency
- 44% ▼ -9.00%
- Reading proficiency
- 49% ▼ -3.00%
- Median HH income
- $42,946
- Composite
- 39.2/100
- National rank
- #4019
- State rank
- #47 of 73 in FL
Livability — Daytona Beach
- Score
- 83/100
- State rank
- #46
- US rank
- #867
Category grades
Schools grade is shown separately in the Schools card above.
Census & demographics
- Census place
- Daytona Beach, FL
- County
- Volusia County · 556,871 people
- City population
- 67,539
- Metro
- Deltona-Daytona Beach-Ormond Beach, FL
- Population (ZIP)
- 22,348
- Household income
- $56,862
- Rent vs Own
- Severe rent burden
- 1158.0
Population outlook (Volusia County) Hauer SSP2
- Today (2025)
- 572,749 people
- By 2030
- 598,695 · +4.5%
- By 2040
- 644,880 · +12.6%
- By 2050
- 681,451 · +19.0%
- By 2075
- 759,957 · +32.7%
- By 2100
- 778,902 · +36.0%
Race, ethnicity, and origin ACS 2023
- Neighborhood character
- Predominantly White (75%)
- Race & ethnicity
- White 75% Black 10% Hispanic / Latino 9% Two or more races 5% Asian 2%
- Hispanic origin (detail)
- Puerto Rican 4%
- Common ancestry
- Lithuanian 2% Slovak 2% Romanian 2%
- Foreign-born
- 9% · Canada, South Korea, Jamaica
- Languages at home
- 87% English-only · Spanish 7% Other Indo-European 2% German/W. Germanic 1%
Political lean MEDSL · Volusia
- 2024 margin
- Strong R (+21.8) · D 38.7% · R 60.5%
- 2008→2024 swing
- -27.4pp toward R · 2008: 5.7pp · 2024: -21.8pp
- All cycles
- 2024: R+21.8 2020: R+14.1 2016: R+13.1 2012: R+1.2 2008: D+5.7
Not yet ingested
- Civics
- —
Market trends
- HPI YoY
- ▼ -247.99%
- Current HPI
- 309.304
- Rent YoY
- ▼ -2.01%
- Metro
- Deltona-Daytona Beach-Ormond Beach, FL
- State GDP YoY
- ▲ 3.28%
- F500 in state
- 36
Industry mix (Fortune 500 HQ in FL)
| Industry | F500 HQs | Revenue |
|---|---|---|
| Industrial Technology | 2 | $29B |
|
||
| Insurance | 2 | $17B |
|
||
| Retail | 1 | $60B |
|
||
| Technology Distribution | 1 | $58B |
|
||
| Homebuilding | 1 | $35B |
|
||
| Technology Manufacturing | 1 | $35B |
|
||
Cash-flow waterfall
monthlySold comps — $/sqft
last 12 mo · ≤1 miLoading sold comps…