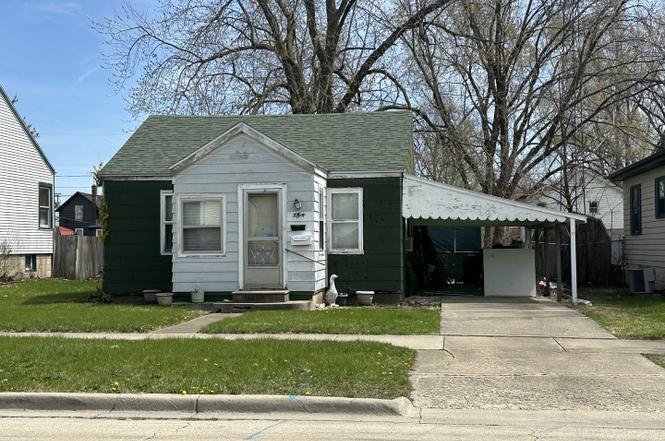
184 S Forest Ave · Bradley, IL
Flood risk 1/10 · Minimal
- FEMA flood zone
- X (unshaded)
- Chance of flooding over 30 yrs
- 0.0%
- Est. flood insurance / yr
- $473 – $860
Fire risk 1/10 · Minimal
- Est. fire insurance / yr
- $804 – $1,492
Heat risk 3/10 · Minor
- Hot days now (above 105°F)
- 7 days/yr
- Hot days in 30 yrs
- 16 days/yr
Wind risk 2/10 · Minimal
- Chance of severe wind over 30 yrs
- 1.0%
Air-quality risk 2/10 · Minimal
- Unhealthy air days now
- 1 days/yr
- Unhealthy air days in 30 yrs
- 1 days/yr
Risk factors via First Street. Map © Google.
Why this score? — see what drove the B+ grade
The composite is a weighted blend of 9 inputs, each scored 0–100. Each bar is that input's sub-score; the figure is the points it added to the 100-point composite (weight × sub-score).
- Cash flow +30.0/30.0
- ARV discount +15.0/15.0
- 1% rule +10.0/10.0
- DSCR +10.0/10.0
- Livability +3.3/5.0
- Rent growth +2.5/5.0
- Condition / age +2.5/5.0
- Schools +1.8/10.0
- Appreciation +0.0/10.0
$80,000
🖨 Deal sheet (PDF) 📄 Offer letter ✓ Due diligence
Listing remarks
Being sold as is. The garage measures about 16 x 21.5 and there is a building attached that was for chickens previously. currently is within the backyard fencing and is used for storage. The unheated front porch is not considered in the sq feet.
Key facts
- 7,250 sq ft lot
- Garage
- Built 1948
Property features AI
Finance
- Other: Parcel number: 17092912601500; Located in Bradley (Township: Bourbonnais)
- HOA & community: No master association fee required
Exterior
- Parking: Detached garage (approximately 1.5 garage/total parking spaces)
- Utilities: Public water; Public sewer; Electric service with fuses
- Home design: Detached single-family home; One-story; Fee simple ownership; Built prior to 1978 (approximately 71-80 years old)
- Construction: Asphalt roof; Block foundation; Other construction materials
- Exterior features: Fenced yard; Mature trees; Lot dimensions approximately 50 x 145
Interior
- Kitchen: Kitchen with eating area/table space (9 x 13); Vinyl flooring in kitchen
- Bedrooms: Master bedroom on main level (11 x 13); Additional bedrooms (numbers listed but specific levels not provided)
- Flooring: Hardwood flooring in living areas
- Bathrooms: One full bathroom
- Heating & cooling: Natural gas forced-air heating
- Interior features: First-floor bedroom; First-floor full bathroom; Attic with pull-down stairs; Crawl space basement; Four total rooms
- Laundry & utility: Main-level laundry (8 x 11)
Neighborhood map
What this means for you Summary
Snapshot
- This is a 1-bed/1.0-bath single-family listed at $80k.
Deal economics
- At list price, monthly cash flow is $471 ($6k/yr) — positive.
- The deal already cash-flows at list — no discount required.
- Meets the 1% rule at list price ($1k rent vs $80k).
- Recommended offer: $70k (12.0% below list) — sets the bar for market timing.
- Cap rate 13.4% vs local median 4.5% in Bradley — top-decile yield for the area; either an underpriced asset or a hidden risk that comps aren't pricing in. Stress-test before assuming the spread holds.
Location & tenants
- Location reads 66/100 on livability (#569 in IL) — a middle-class / working-renter tenant base. Strengths: cost of living A+, housing A+; Watch: employment D+, amenities D, health & safety F.
- Bradley Bourbonnais Chsd 307 (suburban): math 15% / reading 24% proficiency, ranked #413 of 620 in IL (top 67%) — low school quality limits family demand, transient renter base, plan for 1-2y turnover.
- Zoned schools: Bradley East Elem School (529 students, 0% FRL); Bradley Central Middle School (math 4% / reading 22%, grade F, #540 of 665 statewide, top 82%, 407 students, 0% FRL); Bradley-Bourbonnais C High School (math 15% / reading 24%, grade F, #397 of 693 statewide, top 61%, 1,921 students, 0% FRL).
- Market conditions: 21 active listings in the ZIP; 1 comparable units currently listed for rent nearby; 145 units permitted in Kankakee County in 2024 (5 in 5+ unit buildings).
Forward outlook
- Local home prices are declining (-3.0%/yr); year-one equity from $553 of loan paydown is wiped out by about $2k of value loss. Plan a longer hold.
- Kankakee County population projected at -19% by 2050 — secular population decline; favor cash flow + early exit over multi-decade hold.
- At projected returns (-3.0% appreciation + 3.0% rent growth), your $22k cash investment doubles in ~5 years — after that, you're playing with house money.
Negotiation context
- It's been on market 369 days — a 12% lower offer ($70k) is reasonable based on typical stale-listing flexibility.
- 2 sale attempts with the ask held roughly flat each time — persistent listings suggest the price (not the market) is what's stuck; bring a comps-based counter.
Risks & watch-outs
- Watch-outs: built in 1948 — expect roof / HVAC / electrical / plumbing capex.
Questions for the listing agent
- It's been on market 369 days. Have you received any prior offers? Is the seller open to a 12% concession, seller financing, or rate buy-down credit?
- Built in 1948 — when were the roof, HVAC, electrical panel, plumbing, and water heater last replaced?
- Why hasn't it sold? Are there any deal-killer items the seller is aware of (foundation, flood, title, zoning, code violations)?
- Is there a deadline driving the sale (1031 exchange, divorce, estate, relocation)? That informs how much negotiation room exists.
- Schools are F-rated, which usually means shorter tenancies and higher turnover. Who's the typical renter profile here, and what's been the actual vacancy rate?
- What's the average days-on-market for RENTAL listings here right now (not sales)? A rising rental-DOM trend means longer vacancies and softer asking-rent achievability than the comps imply.
- What's the recent tenant-quality profile in this submarket — average credit score on applications, eviction rate, late-payment / NSF rate, and stable-employment percentage? A property-management company in the area should have these aggregated.
- How much new for-sale + rental construction is in the pipeline within 1–3 miles? Heavy new supply typically softens prices + rents 12–24 months out; constrained supply supports both.
Investment metrics
- 1% rule
- 1.72% ✓
- Cap rate
- 13.36%
- Cash-on-cash
- 25.23%
- DSCR
- 2.12
- GRM
- 4.8
CMA / ARV
- ARV (on-the-fly)
- $143,352
- Comps found
- 8
Show comp detail 8 sales within ~0.75 mi
| Address | Dist | Beds/Ba | Sqft | Sold | Price | $/sf | Match |
|---|---|---|---|---|---|---|---|
| 265 S Forest Ave | 0.07mi | 2/2.0 (+1) | 840 (+6%) | 10mo | $200,000 | $238 | 69 |
| 1232 Riverlane Dr | 0.44mi | 2/1.0 (+1) | 808 (+2%) | 6mo | $175,280 | $217 | 66 |
| 395 N Cleveland Ave | 0.35mi | 2/1.0 (+1) | 796 (+0%) | 23mo | $152,000 | $191 | 59 |
| 283 N Blaine Ave | 0.24mi | 2/1.0 (+1) | 824 (+4%) | 22mo | $115,000 | $140 | 59 |
| 272 S Blaine Ave | 0.11mi | 2/1.0 (+1) | 868 (+10%) | 22mo | $155,000 | $179 | 56 |
| 1040 W South St | 0.30mi | 2/1.0 (+1) | 884 (+12%) | 8mo | $160,000 | $181 | 55 |
| 562 W Drummond Dr | 0.73mi | 2/1.0 (+1) | 900 (+14%) | 1mo | $162,000 | $180 | 38 |
| 447 S Michigan Ave | 0.54mi | 2/1.0 (+1) | 900 (+14%) | 12mo | $153,000 | $170 | 37 |
Match score weights: distance 35% · size 25% · config 20% · recency 20%. Top-matched comps best support the ARV.
Projected returns pro-forma
-3.0% appreciation · 3.0% rent growth · sell at horizon
- IRR
- 18.8%
- Equity multiple
- 1.76×
- Total profit
- $17,090
- Equity at exit
- $11,928
- IRR
- 27.2%
- Equity multiple
- 3.40×
- Total profit
- $53,745
- Equity at exit
- $6,917
Cash invested: $22,400 (down + closing). Projections, not guarantees.
Landlord ↔ Tenant lean methodology
- Overall (STATE)
- 43 Moderately Tenant-Leaning
- State Illinois
- 43 Moderately Tenant-Leaning · D+7
- County
- — inherits STATE
- City
- — inherits STATE
ZIP-level market 60915
- Active inventory
- 21
- Price-to-rent
- 4.8×
Monthly cashflow live
- Estimated rent
- $1,375 medium interval (Pro) →
- Mortgage (P&I)
- −$420
- Tax from tax record
- −$162 /mo · $1,949/yr
- Insurance
- −$33
- HOA
- −$0
- Vacancy / Maint / Mgmt
- −$289
- Net cashflow
- $471
Break-even live
Sensitivity live
| Price | -10% $516 | -5% $494 | +0% $471 | +5% $448 | +10% $426 |
|---|---|---|---|---|---|
| Rent | -10% $362 | -5% $417 | +0% $471 | +5% $525 | +10% $580 |
| Rate | -1.0pp $511 | -0.5pp $491 | base $471 | +0.5pp $450 | +1.0pp $429 |
UW: 25.0% down · 7.5% · 30yr · 1.5% tax · 5.0% vac · 8.0% maint · 8.0% mgmt
Financing live
Cash to close
- Down payment
- $20,000
- Closing costs
- $2,400
- Reserves months
- —
- Total cash needed
- —
Loan-product check · same deal, 3 products live
Conventional
25% down · 7.5% · 30yr
- Down + closing
- —
- Monthly P&I
- —
- Monthly cashflow
- —
- DSCR
- —
- Eligible?
- —
Personal DTI + credit; lowest rate.
DSCR
20% down · 8.5% · 30yr
- Down + closing
- —
- Monthly P&I
- —
- Monthly cashflow
- —
- DSCR
- —
- Eligible?
- —
No personal income docs; deal must DSCR.
Hard money
10% down · 12.0% · 12mo
- Down + closing
- —
- Monthly P&I
- —
- Monthly cashflow
- —
- DSCR
- —
- Eligible?
- —
Short-term bridge; refi at stabilization.
Rent comps 1 comps
| Address | Beds | Baths | Sqft | Rent | $/sqft | DOM | Units | Dist |
|---|---|---|---|---|---|---|---|---|
| 1017 N Schuyler Ave Unit 3 Kankakee, IL | 2.0 | 1.0 | 800 | $1,375 | $1.72 | 45d | 1 | 0.99mi |
Listing history 19 events
-
2026-06-19days on market $80,000 Active 369 DOM
-
2026-06-18days on market $80,000 Active 368 DOM
-
2026-06-17days on market $80,000 Active 367 DOM
-
2026-06-16days on market $80,000 Active 366 DOM
-
2026-06-15days on market $80,000 Active 365 DOM
-
2026-06-14days on market $80,000 Active 363 DOM
-
2026-06-13days on market $80,000 Active 362 DOM
-
2026-06-10days on market $80,000 Active 360 DOM
-
2026-06-09days on market $80,000 Active 359 DOM
-
2026-06-08days on market $80,000 Active 358 DOM
-
2026-06-07days on market $80,000 Active 357 DOM
-
2026-06-05days on market $80,000 Active 354 DOM
-
2026-06-02days on market $80,000 Active 352 DOM
-
2026-06-01days on market $80,000 Active 351 DOM
-
2026-05-31days on market $80,000 Active 350 DOM
-
2026-05-30days on market $80,000 Active 349 DOM
-
2025-08-18status Active
-
2025-07-01historical
-
2025-04-27$80,000 Active
ⓘ Source: listings_history table (triggers on properties + properties_extension) + one-shot
backfill from property_details.listing_events for pre-trigger history.
Tax reassessment forecast IL · Partial reset (capped growth)
- Current annual tax
- $1,949 · $162/mo
- Projected year-2 tax
- $1,949 · $162/mo
- Expected delta
- $0/yr ($0/mo · 0.0%)
ⓘ Screening estimate from a state-policy table — verify with the county assessor before closing.
Climate risk First Street
- Flood 1/10 Low FEMA zone X (unshaded) · 0% chance over 30 yrs
- Wildfire 1/10 Low
- Heat 3/10 Moderate 7 d/yr ≥105°F today · 16 d/yr by 30 yrs out
- Wind 2/10 Low 100% chance of damaging wind over 30 yrs
- Air quality 2/10 Low 1 unhealthy d/yr today · 1 by 30 yrs out
Nearby sold comps map
Loading sold comps map…
Walkable amenities ~0.75 mi
Loading nearby amenities…
Taxation est. · year 1
- Rental income
- $16,500
- − Mortgage interest
- −$4,481
- − Property taxes
- −$1,949
- − Insurance
- −$400
- − Repairs & maintenance
- −$1,320
- − Management
- −$1,320
- − Depreciation
- −$2,327
- Taxable income
- $4,702
- Est. tax owed @ 24.0%
- −$1,129
- After-tax cash flow
- $4,523/yr
For passive investors: Depreciation is non-cash, so a rental often shows a tax loss while cash-flowing — sheltering income. Rental losses are passive: they offset passive income freely, and up to $25,000/yr can offset ordinary (W-2) income if you actively participate and your MAGI is under $100k (phasing out to $0 by $150k); unused losses carry forward. On sale, claimed depreciation is recaptured at up to 25%, and gains may owe capital-gains tax (a 1031 exchange can defer both). Figures are a year-1 estimate at your 24.0% rate — not tax advice; consult a CPA.
Schools (NCES district)
- District
- Bradley Bourbonnais Chsd 307
- NCES district ID
- 1706960
- Math proficiency
- 15% ▼ -6.00%
- Reading proficiency
- 24% ▼ -6.00%
- Median HH income
- $59,302
- Composite
- 18.35/100
- National rank
- #8945
- State rank
- #413 of 620 in IL
Livability — Bradley
- Score
- 66/100
- State rank
- #569
- US rank
- #11945
Category grades
Schools grade is shown separately in the Schools card above.
Census & demographics
- Census place
- Bradley, IL
- City population
- 10,217
- Population (ZIP)
- 10,217
Population outlook (Kankakee County) Hauer SSP2
- Today (2025)
- 105,479 people
- By 2030
- 101,792 · -3.5%
- By 2040
- 93,479 · -11.4%
- By 2050
- 85,061 · -19.4%
- By 2075
- 67,314 · -36.2%
- By 2100
- 52,439 · -50.3%
Race, ethnicity, and origin ACS 2023
- Neighborhood character
- Predominantly White (80%)
- Race & ethnicity
- White 80% Hispanic / Latino 14% Two or more races 9% Black 3%
- Hispanic origin (detail)
- Mexican 14%
- Common ancestry
- Romanian 10% Lithuanian 6% Slovak 2%
- Foreign-born
- 4% · Canada
- Languages at home
- 86% English-only · Spanish 11% French/Haitian/Cajun 1% Other Indo-European 1%
Political lean MEDSL · Kankakee
- 2024 margin
- Strong R (+20.8) · D 38.7% · R 59.5% · Other 1.8%
- 2008→2024 swing
- -25.4pp toward R · 2008: 4.6pp · 2024: -20.8pp
- All cycles
- 2024: R+20.8 2020: R+16.5 2016: R+13.3 2012: R+3.4 2008: D+4.6
Not yet ingested
- Civics
- —
Market trends
- HPI YoY
- ▼ -136.35%
- Current HPI
- 178.3271
- Rent YoY
- —
- Metro
- —
- State GDP YoY
- ▲ 1.59%
- F500 in state
- 60
Industry mix (Fortune 500 HQ in IL)
| Industry | F500 HQs | Revenue |
|---|---|---|
| Insurance | 4 | $201B |
|
||
| Consumer Goods | 4 | $87B |
|
||
| Industrial Machinery | 3 | $64B |
|
||
| Healthcare | 2 | $55B |
|
||
| Retail / Pharmacy | 1 | $148B |
|
||
| Agriculture / Food | 1 | $86B |
|
||
Price history
3 events — show timeline
- 2025-08-18 Relisted — MRED as Distributed by MLS Grid
- 2025-07-01 Listing Removed — MRED as Distributed by MLS Grid
- 2025-04-27 Listed $80,000 MRED as Distributed by MLS Grid
Property tax history
+31.7%/yrLatest (2024): $1,949 · +8.3% YoY. Source: county tax records.
Cash-flow waterfall
monthlySold comps — $/sqft
last 12 mo · ≤1 miLoading sold comps…