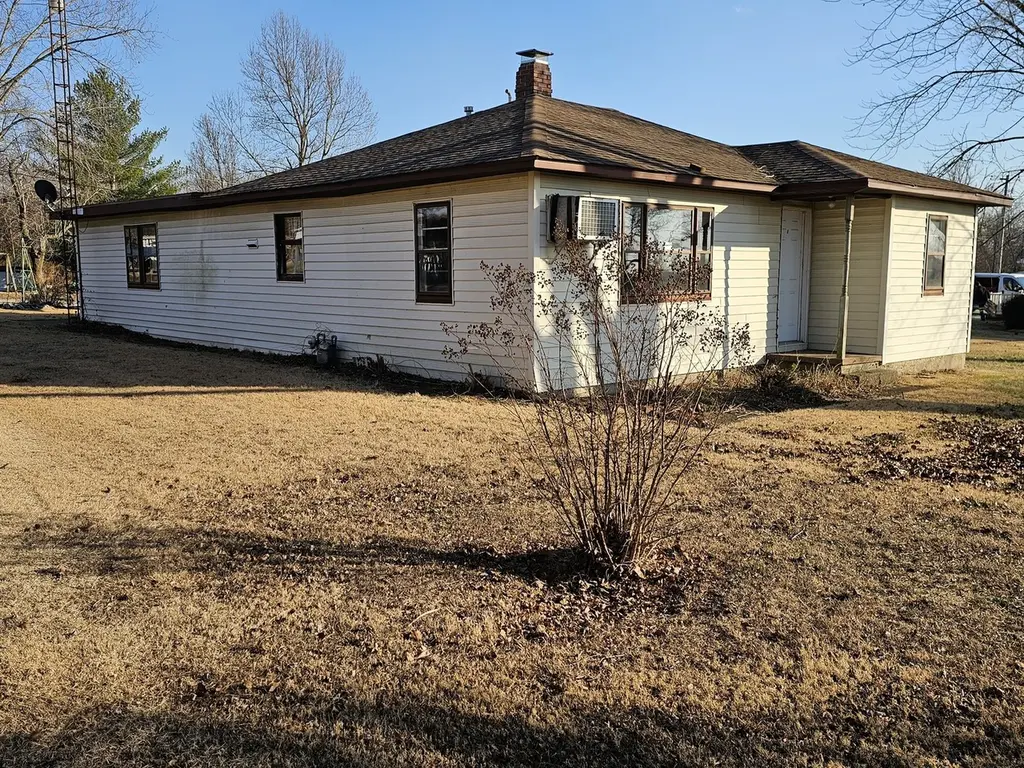
607 S Broadway · Waltonville, IL
Flood risk 1/10 · Minimal
- FEMA flood zone
- X (unshaded)
- Chance of flooding over 30 yrs
- 0.0%
- Est. flood insurance / yr
- $473 – $860
Fire risk 1/10 · Minimal
- Est. fire insurance / yr
- $804 – $1,492
Heat risk 4/10 · Minor
- Hot days now (above 106°F)
- 7 days/yr
- Hot days in 30 yrs
- 20 days/yr
Wind risk 2/10 · Minimal
- Chance of severe wind over 30 yrs
- 2.0%
Air-quality risk 2/10 · Minimal
- Unhealthy air days now
- 1 days/yr
- Unhealthy air days in 30 yrs
- 3 days/yr
Risk factors via First Street. Map © Google.
Why this score? — see what drove the A- grade
The composite is a weighted blend of 9 inputs, each scored 0–100. Each bar is that input's sub-score; the figure is the points it added to the 100-point composite (weight × sub-score).
- Cash flow +30.0/30.0
- ARV discount +15.0/15.0
- 1% rule +10.0/10.0
- DSCR +10.0/10.0
- Appreciation +5.0/10.0
- Schools +3.4/10.0
- Livability +3.0/5.0
- Rent growth +2.5/5.0
- Condition / age +2.5/5.0
$74,500
🖨 Deal sheet 📄 Offer letter ✓ Due diligence
Listing remarks MLS
Cozy Affordable Home - $84,500 Welcome to your new opportunity! This charming home features 2 bedrooms plus a large additional room that could easily serve as a 3rd bedroom to fit your needs. The kitchen opens to the family room, creating a functional and inviting space for everyday living and entertaining. Enjoy your morning in the living room with a large front window that fills the space with natural light. Practical living is made easy with a spacious utility room, perfect for laundry and extra storage. Recent upgrades include a newer gas furnace, central air, and hot water heater, giving you comfort and peace of mind. Outside you'll find an oversized detached carport and a large storage building - excellent for toys, tools, or hobby space. Located just minutes from scenic Rend Lake, this property offers small-town convenience with a rural setting. Whether you're looking for a great rental investment or an Airbnb opportunity, this home's location near outdoor recreation makes it highly marketable. While some updates may be desired, at $84,500, you can afford to personalize this home and add value.
Key facts
- Hot water heater
- Newer gas furnace
- Central air
Tags
Neighborhood map
What this means for you Summary
Snapshot
- This is a 3-bed/1.0-bath single-family listed at $74k.
Deal economics
- At list price, monthly cash flow is $370 ($4k/yr) — positive.
- The deal already cash-flows at list — no discount required.
- Meets the 1% rule at list price ($1k rent vs $74k).
- Recommended offer: $66k (12.0% below list) — sets the bar for market timing.
Location & tenants
- Location reads 59/100 on livability (#1,072 in IL) — a working-class tenant base; expect higher turnover. Strengths: cost of living A+, housing A+; Watch: employment D, schools F, crime D-.
- Waltonville CUSD 1 (rural): math 25% / reading 50% proficiency, ranked #370 of 919 in IL (top 40%) — families likely to look elsewhere, expect single-tenant / working-renter base with shorter leases.
- Market conditions: 4 active listings in the ZIP; 6 units permitted in Jefferson County in 2024 (0 in 5+ unit buildings).
Forward outlook
- In year one you build about $3k of equity ($515 loan paydown + $2k appreciation (3.0% local appreciation)).
- Jefferson County population projected at -14% by 2050 — secular population decline; favor cash flow + early exit over multi-decade hold.
- At projected returns (3.0% appreciation + 3.0% rent growth), your $21k cash investment doubles in ~3 years — after that, you're playing with house money.
Negotiation context
- It's been on market 146 days — a 12% lower offer ($66k) is reasonable based on typical stale-listing flexibility.
Risks & watch-outs
- Watch-outs: built in 1920 — expect roof / HVAC / electrical / plumbing capex.
Questions for the listing agent
- It's been on market 146 days. Have you received any prior offers? Is the seller open to a 12% concession, seller financing, or rate buy-down credit?
- Built in 1920 — when were the roof, HVAC, electrical panel, plumbing, and water heater last replaced?
- Why hasn't it sold? Are there any deal-killer items the seller is aware of (foundation, flood, title, zoning, code violations)?
- Is there a deadline driving the sale (1031 exchange, divorce, estate, relocation)? That informs how much negotiation room exists.
- Schools are F-rated, which usually means shorter tenancies and higher turnover. Who's the typical renter profile here, and what's been the actual vacancy rate?
- Crime grade is D in this area — have there been break-ins, vandalism, or insurance claims at this property in the last 3 years? What carrier currently insures it and at what premium?
- What's the average days-on-market for RENTAL listings here right now (not sales)? A rising rental-DOM trend means longer vacancies and softer asking-rent achievability than the comps imply.
- What's the recent tenant-quality profile in this submarket — average credit score on applications, eviction rate, late-payment / NSF rate, and stable-employment percentage? A property-management company in the area should have these aggregated.
- How much new for-sale + rental construction is in the pipeline within 1–3 miles? Heavy new supply typically softens prices + rents 12–24 months out; constrained supply supports both.
Investment metrics
- 1% rule
- 1.50% ✓
- Cap rate
- 12.26%
- Cash-on-cash
- 21.30%
- DSCR
- 1.95
- GRM
- 5.5
CMA / ARV
- ARV (median comp)
- $104,094
- List price
- $74,500
- Delta
- -28.43%
- Verdict
- UNDERPRICED
- Comps
- 6 within 1.0 mi
Show comp detail 2 sales within ~0.75 mi
| Address | Dist | Beds/Ba | Sqft | Sold | Price | $/sf | Match |
|---|---|---|---|---|---|---|---|
| 204 W Main St | 0.23mi | 4/2.0 (+1) | 1,440 (-3%) | 7mo | $121,500 | $84 | 70 |
| 211 W Union St | 0.39mi | 3/2.0 | 1,680 (+14%) | 23mo | $169,000 | $101 | 36 |
Match score weights: distance 35% · size 25% · config 20% · recency 20%. Top-matched comps best support the ARV.
Projected returns pro-forma
3.0% appreciation · 3.0% rent growth · sell at horizon
- IRR
- 27.6%
- Equity multiple
- 2.56×
- Total profit
- $32,569
- Equity at exit
- $33,498
- IRR
- 28.1%
- Equity multiple
- 4.98×
- Total profit
- $82,934
- Equity at exit
- $51,625
Cash invested: $20,860 (down + closing). Projections, not guarantees.
Landlord ↔ Tenant lean methodology
- Overall (STATE)
- 43 Moderately Tenant-Leaning
- State Illinois
- 43 Moderately Tenant-Leaning · D+7
- County
- — inherits STATE
- City
- — inherits STATE
ZIP-level market 62894
- Active inventory
- 4
- Price-to-rent
- 5.5×
Monthly cashflow live
- Estimated rent
- $1,120 medium interval (Pro) →
- Mortgage (P&I)
- −$391
- Tax est. 1.5%
- −$93 /mo · $1,118/yr
- Insurance
- −$31
- HOA
- −$0
- Vacancy / Maint / Mgmt
- −$235
- Net cashflow
- $370
Break-even live
UW: 25.0% down · 7.5% · 30yr · 1.5% tax · 5.0% vac · 8.0% maint · 8.0% mgmt
Financing live
Cash to close
- Down payment
- $18,625
- Closing costs
- $2,235
- Reserves months
- —
- Total cash needed
- —
Loan-product check · same deal, 3 products live
Conventional
25% down · 7.5% · 30yr
- Down + closing
- —
- Monthly P&I
- —
- Monthly cashflow
- —
- DSCR
- —
- Eligible?
- —
Personal DTI + credit; lowest rate.
DSCR
20% down · 8.5% · 30yr
- Down + closing
- —
- Monthly P&I
- —
- Monthly cashflow
- —
- DSCR
- —
- Eligible?
- —
No personal income docs; deal must DSCR.
Hard money
10% down · 12.0% · 12mo
- Down + closing
- —
- Monthly P&I
- —
- Monthly cashflow
- —
- DSCR
- —
- Eligible?
- —
Short-term bridge; refi at stabilization.
Listing history 16 events
-
2026-06-18days on market $74,500 Active 146 DOM
-
2026-06-17days on market $74,500 Active 145 DOM
-
2026-06-16days on market $74,500 Active 144 DOM
-
2026-06-15days on market $74,500 Active 143 DOM
-
2026-06-13days on market $74,500 Active 141 DOM
-
2026-06-12pricedays on market $74,500 Active 140 DOM
-
2026-06-09days on market $84,500 Active 137 DOM
-
2026-06-08days on market $84,500 Active 136 DOM
-
2026-06-07days on market $84,500 Active 135 DOM
-
2026-06-07days on market $84,500 Active 134 DOM
-
2026-06-04days on market $84,500 Active 131 DOM
-
2026-06-02days on market $84,500 Active 130 DOM
-
2026-06-01days on market $84,500 Active 129 DOM
-
2026-05-31days on market $84,500 Active 128 DOM
-
2026-05-31days on market $84,500 Active 127 DOM
-
2026-01-23$84,500 Active 1118-char remark
Show marketing remark (1118 chars)
Cozy Affordable Home - $84,500 Welcome to your new opportunity! This charming home features 2 bedrooms plus a large additional room that could easily serve as a 3rd bedroom to fit your needs. The kitchen opens to the family room, creating a functional and inviting space for everyday living and entertaining. Enjoy your morning in the living room with a large front window that fills the space with natural light. Practical living is made easy with a spacious utility room, perfect for laundry and extra storage. Recent upgrades include a newer gas furnace, central air, and hot water heater, giving you comfort and peace of mind. Outside you'll find an oversized detached carport and a large storage building - excellent for toys, tools, or hobby space. Located just minutes from scenic Rend Lake, this property offers small-town convenience with a rural setting. Whether you're looking for a great rental investment or an Airbnb opportunity, this home's location near outdoor recreation makes it highly marketable. While some updates may be desired, at $84,500, you can afford to personalize this home and add value.
ⓘ Source: listings_history table (triggers on properties + properties_extension) + one-shot
backfill from property_details.listing_events for pre-trigger history.
Climate risk First Street
- Flood 1/10 Low FEMA zone X (unshaded) · 0% chance over 30 yrs
- Wildfire 1/10 Low
- Heat 4/10 Moderate 7 d/yr ≥106°F today · 20 d/yr by 30 yrs out
- Wind 2/10 Low 2% chance of damaging wind over 30 yrs
- Air quality 2/10 Low 1 unhealthy d/yr today · 3 by 30 yrs out
Nearby sold comps map
Loading sold comps map…
Walkable amenities ~0.75 mi
Loading nearby amenities…
Taxation est. · year 1
- Rental income
- $13,444
- − Mortgage interest
- −$4,173
- − Property taxes
- −$1,118
- − Insurance
- −$372
- − Repairs & maintenance
- −$1,075
- − Management
- −$1,075
- − Depreciation
- −$2,167
- Taxable income
- $3,462
- Est. tax owed @ 24.0%
- −$831
- After-tax cash flow
- $3,611/yr
For passive investors: Depreciation is non-cash, so a rental often shows a tax loss while cash-flowing — sheltering income. Rental losses are passive: they offset passive income freely, and up to $25,000/yr can offset ordinary (W-2) income if you actively participate and your MAGI is under $100k (phasing out to $0 by $150k); unused losses carry forward. On sale, claimed depreciation is recaptured at up to 25%, and gains may owe capital-gains tax (a 1031 exchange can defer both). Figures are a year-1 estimate at your 24.0% rate — not tax advice; consult a CPA.
Schools (NCES district)
- District
- Waltonville CUSD 1
- NCES district ID
- 1740650
- Math proficiency
- 25% ▼ -10.00%
- Reading proficiency
- 50% ▲ 5.00%
- Median HH income
- $45,209
- Composite
- 34.44/100
- National rank
- #10158
- State rank
- #370 of 919 in IL
Livability — Waltonville
- Score
- 59/100
- State rank
- #1072
- US rank
- #20489
Category grades
Schools grade is shown separately in the Schools card above.
Census & demographics
- Census place
- Waltonville, IL
- City population
- 814
- Population (ZIP)
- 814
Population outlook (Jefferson County) Hauer SSP2
- Today (2025)
- 36,818 people
- By 2030
- 35,764 · -2.9%
- By 2040
- 33,649 · -8.6%
- By 2050
- 31,557 · -14.3%
- By 2075
- 26,055 · -29.2%
- By 2100
- 19,237 · -47.8%
Race, ethnicity, and origin ACS 2023
- Neighborhood character
- Predominantly White (96%)
- Race & ethnicity
- White 96% Black 2% Two or more races 2%
- Common ancestry
- Romanian 11% Lithuanian 3% Slovak 3%
Political lean MEDSL · Jefferson
- 2024 margin
- Solid R (+47.8) · D 25.5% · R 73.3% · Other 1.3%
- 2008→2024 swing
- -37.0pp toward R · 2008: -10.7pp · 2024: -47.8pp
- All cycles
- 2024: R+47.8 2020: R+45.1 2016: R+43.2 2012: R+22.9 2008: R+10.7
Not yet ingested
- Civics
- —
Market trends
- HPI YoY
- —
- Current HPI
- —
- Rent YoY
- —
- Metro
- —
- State GDP YoY
- ▲ 1.59%
- F500 in state
- 60
Industry mix (Fortune 500 HQ in IL)
| Industry | F500 HQs | Revenue |
|---|---|---|
| Insurance | 4 | $201B |
|
||
| Consumer Goods | 4 | $87B |
|
||
| Industrial Machinery | 3 | $64B |
|
||
| Healthcare | 2 | $55B |
|
||
| Retail / Pharmacy | 1 | $148B |
|
||
| Agriculture / Food | 1 | $86B |
|
||
Price history
1 event — show timeline
- 2026-01-23 Listed $84,500 MRED as Distributed by MLS Grid
Property tax history
-3.3%/yrLatest (2024): $45 · -6.7% YoY. Source: county tax records.
Cash-flow waterfall
monthlySold comps — $/sqft
last 12 mo · ≤1 miLoading sold comps…