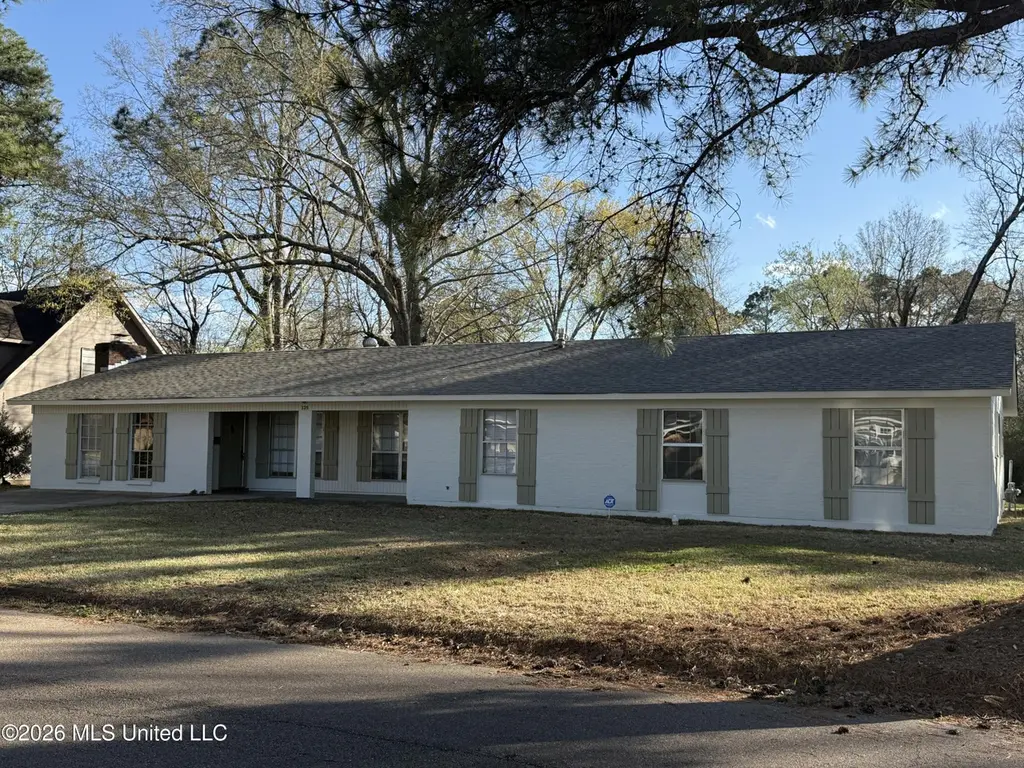
335 Valley Vista Dr #335 · Jackson, MS
Flood risk 1/10 · Minimal
- FEMA flood zone
- AE
- Chance of flooding over 30 yrs
- 0.0%
- Est. flood insurance / yr
- $1,737 – $8,500
Fire risk 1/10 · Minimal
- Est. fire insurance / yr
- $1,241 – $2,305
Heat risk 7/10 · Major
- Hot days now (above 108°F)
- 7 days/yr
- Hot days in 30 yrs
- 20 days/yr
Wind risk 8/10 · Major
- Chance of severe wind over 30 yrs
- 80.0%
Air-quality risk 2/10 · Minimal
- Unhealthy air days now
- 0 days/yr
- Unhealthy air days in 30 yrs
- 1 days/yr
Risk factors via First Street. Map © Google.
Why this score? — see what drove the B- grade
The composite is a weighted blend of 9 inputs, each scored 0–100. Each bar is that input's sub-score; the figure is the points it added to the 100-point composite (weight × sub-score).
- Cash flow +28.6/30.0
- DSCR +10.0/10.0
- 1% rule +7.9/10.0
- ARV discount +7.9/15.0
- Rent growth +4.5/5.0
- Condition / age +3.8/5.0
- Livability +3.4/5.0
- Schools +1.1/10.0
- Appreciation +0.0/10.0
$169,900
🖨 Deal sheet 📄 Offer letter ✓ Due diligence
Listing remarks MLS
Comfortable and Conveniently Located!! Fresh Paint!! 4/2 ready for you!
Key facts
- 0.41 acre lot
- Garage
- Built 1962
Neighborhood map
What this means for you Summary
Snapshot
- This is a 4-bed/2.0-bath single-family listed at $170k. Condition is rated good.
Deal economics
- At list price, monthly cash flow is $136 ($2k/yr) — positive.
- The deal already cash-flows at list — no discount required.
- Meets the 1% rule at list price ($2k rent vs $170k).
- Recommended offer: $160k (6.0% below list) — sets the bar for market timing.
Location & tenants
- Location reads 68/100 on livability (#66 in MS) — a middle-class / working-renter tenant base. Strengths: commute A+, cost of living A+, housing A+; Watch: schools F, amenities F, employment F.
- Jackson Public School District (urban): math 9% / reading 18% proficiency, ranked #112 of 130 in MS (top 86%) — low school quality limits family demand, transient renter base, plan for 1-2y turnover; 88% free/reduced lunch — lower-income household profile, screen leases tightly.
- Market conditions: Rents rising fast (+7.9%/yr); 221 active listings in the ZIP; 9 comparable units currently listed for rent nearby; rentals at typical pace (median 23d on market — plan ~3-4 weeks tenant-placement turnaround); 167 units permitted in Hinds County in 2024 (0 in 5+ unit buildings).
- This rent runs 38% of the median local income ($69k/yr) — at the standard rent-burdened threshold; future hikes will face affordability resistance.
Forward outlook
- Local home prices are declining (-3.0%/yr); year-one equity from $1k of loan paydown is wiped out by about $5k of value loss. Plan a longer hold.
- Hinds County population projected to shrink 6% by 2050 — rents likely to lag national; underwrite the cash flow, not the appreciation.
- At projected returns (-3.0% appreciation + 7.9% rent growth), your $48k cash investment doubles in ~9 years — after that, you're playing with house money.
Negotiation context
- It's been on market 73 days — a 6% lower offer ($160k) is reasonable based on typical stale-listing flexibility.
Risks & watch-outs
- Watch-outs: flood insurance adds $427/mo.
- Climate carrying-cost: in FEMA flood zone AE (mandatory federal flood insurance); severe wind risk, 80% chance of damaging wind over 30y; extreme-heat days projected 7→20/yr by 2055 (HVAC capex compounding) — expect insurance premiums to compound above CPI over the hold.
Questions for the listing agent
- It's been on market 73 days. Have you received any prior offers? Is the seller open to a 6% concession, seller financing, or rate buy-down credit?
- Built in 1962 — when were the roof, HVAC, electrical panel, plumbing, and water heater last replaced?
- What's the actual annual flood-insurance premium (NFIP or private), and is the property in a SFHA with mandatory coverage?
- Why hasn't it sold? Are there any deal-killer items the seller is aware of (foundation, flood, title, zoning, code violations)?
- Is there a deadline driving the sale (1031 exchange, divorce, estate, relocation)? That informs how much negotiation room exists.
- Schools are F-rated, which usually means shorter tenancies and higher turnover. Who's the typical renter profile here, and what's been the actual vacancy rate?
- What's the average days-on-market for RENTAL listings here right now (not sales)? A rising rental-DOM trend means longer vacancies and softer asking-rent achievability than the comps imply.
- What's the recent tenant-quality profile in this submarket — average credit score on applications, eviction rate, late-payment / NSF rate, and stable-employment percentage? A property-management company in the area should have these aggregated.
- How much new for-sale + rental construction is in the pipeline within 1–3 miles? Heavy new supply typically softens prices + rents 12–24 months out; constrained supply supports both.
Investment metrics
- 1% rule
- 1.29% ✓
- Cap rate
- 10.26%
- Cash-on-cash
- 14.18%
- DSCR
- 1.63
- GRM
- 6.4
CMA / ARV
- ARV (median comp)
- $171,479
- List price
- $169,900
- Delta
- -0.92%
- Verdict
- FAIR
- Comps
- 20 within 1.0 mi
Show comp detail 12 sales within ~0.75 mi
| Address | Dist | Beds/Ba | Sqft | Sold | Price | $/sf | Match |
|---|---|---|---|---|---|---|---|
| 5255 Parkway Dr | 0.07mi | 5/3.0 (+1) | 2,165 (-5%) | 4mo | $179,900 | $83 | 75 |
| 5320 Meadow Oaks Pk Dr | 0.56mi | 4/2.0 | 2,314 (+1%) | 3mo | $223,000 | $96 | 69 |
| 5805 E Sedgwick Ct | 0.43mi | 4/2.0 | 2,093 (-8%) | 1mo | $165,000 | $79 | 65 |
| 209 Valley Vista Dr | 0.26mi | 4/2.5 | 2,080 (-9%) | 7mo | $97,000 | $47 | 65 |
| 5865 E Sedgwick Ct | 0.50mi | 3/2.0 (-1) | 2,164 (-5%) | 5mo | $149,000 | $69 | 58 |
| 5130 Sunnyvale Dr | 0.57mi | 4/2.5 | 2,154 (-6%) | 7mo | $205,900 | $96 | 56 |
| 5165 Shirlwood Dr | 0.44mi | 5/2.5 (+1) | 2,588 (+13%) | 0mo | $160,000 | $62 | 50 |
| 122 Sugaloch Cv | 0.64mi | 3/2.0 (-1) | 2,140 (-6%) | 6mo | $245,000 | $114 | 49 |
| 5525 Meadow Oaks Park Dr | 0.59mi | 4/2.5 | 2,476 (+8%) | 9mo | $249,900 | $101 | 49 |
| 110 Parkway Dr | 0.55mi | 3/2.0 (-1) | 2,082 (-9%) | 9mo | $204,900 | $98 | 47 |
| 160 Chelsea Ct | 0.70mi | 3/2.0 (-1) | 2,367 (+4%) | 13mo | $189,900 | $80 | 46 |
| 5824 Old Canton Rd | 0.47mi | 4/3.0 | 2,030 (-11%) | 12mo | $221,000 | $109 | 45 |
Match score weights: distance 35% · size 25% · config 20% · recency 20%. Top-matched comps best support the ARV.
Projected returns pro-forma
-3.0% appreciation · 7.9% rent growth · sell at horizon
- IRR
- -3.8%
- Equity multiple
- 0.85×
- Total profit
- $-7,216
- Equity at exit
- $25,333
- IRR
- 11.9%
- Equity multiple
- 2.21×
- Total profit
- $57,703
- Equity at exit
- $14,690
Cash invested: $47,572 (down + closing). Projections, not guarantees.
Landlord ↔ Tenant lean methodology
- Overall (STATE)
- 90 Strongly Landlord-Friendly
- State Mississippi
- 90 Strongly Landlord-Friendly · R+11
- County
- — inherits STATE
- City
- — inherits STATE
ZIP-level market 39211
- Rents YoY
- 7.9%
- Active inventory
- 221
- Price-to-rent
- 6.4×
Monthly cashflow live
- Estimated rent
- $2,198 high interval (Pro) →
- Mortgage (P&I)
- −$891
- Tax est. 1.5%
- −$212 /mo · $2,548/yr
- Insurance
- −$71
- Flood insurance flood zone
- −$427 /mo · $5,118/yr
- HOA
- −$0
- Vacancy / Maint / Mgmt
- −$462
- Net cashflow
- $136
Break-even live
UW: 25.0% down · 7.5% · 30yr · 1.5% tax · 5.0% vac · 8.0% maint · 8.0% mgmt
Financing live
Cash to close
- Down payment
- $42,475
- Closing costs
- $5,097
- Reserves months
- —
- Total cash needed
- —
Loan-product check · same deal, 3 products live
Conventional
25% down · 7.5% · 30yr
- Down + closing
- —
- Monthly P&I
- —
- Monthly cashflow
- —
- DSCR
- —
- Eligible?
- —
Personal DTI + credit; lowest rate.
DSCR
20% down · 8.5% · 30yr
- Down + closing
- —
- Monthly P&I
- —
- Monthly cashflow
- —
- DSCR
- —
- Eligible?
- —
No personal income docs; deal must DSCR.
Hard money
10% down · 12.0% · 12mo
- Down + closing
- —
- Monthly P&I
- —
- Monthly cashflow
- —
- DSCR
- —
- Eligible?
- —
Short-term bridge; refi at stabilization.
Rent comps 9 comps
| Address | Beds | Baths | Sqft | Rent | $/sqft | DOM | Units | Dist |
|---|---|---|---|---|---|---|---|---|
| 5855 Canton Park Dr Jackson, MS | 4.0 | 2.0 | 1955 | $1,675 | $0.86 | 23d | 1 | 0.52mi |
| 5855 Canton Park Dr Jackson, MS | 4.0 | 2.0 | 2401 | $1,675 | $0.70 | 13d | 1 | 0.52mi |
| 2009 Lake Trace Dr Jackson, MS | 4.0 | 2.0 | 2028 | $1,950 | $0.96 | 13d | 1 | 1.09mi |
| 1046 Newland St Jackson, MS | 4.0 | 2.5 | 2700 | $3,200 | $1.19 | 23d | 1 | 1.10mi |
| 6231 Waterford Dr Jackson, MS | 4.0 | 3.5 | 2892 | $2,200 | $0.76 | 23d | 1 | 1.28mi |
| 117 Rolling Creek Dr Jackson, MS | 4.0 | 2.5 | 2459 | $2,700 | $1.10 | 23d | 1 | 1.29mi |
| 5125 Old Canton Rd Jackson, MS | 3.0 | 3.0 | 2025 | $2,100 | $1.04 | 23d | 1 | 1.30mi |
| 47 Moss Forest Cir Jackson, MS | 4.0 | 3.0 | 2624 | $3,000 | $1.14 | 13d | 1 | 1.40mi |
| 212 Pimlico Pl Jackson, MS | 3.0 | 2.0 | 1600 | $900 | $0.56 | 13d | 1 | 1.48mi |
Listing history 9 events
-
2026-06-07statusdays on market $169,900 Pending 73 DOM
-
2026-06-05days on market $169,900 Active 72 DOM
-
2026-06-03days on market $169,900 Active 71 DOM
-
2026-06-02days on market $169,900 Active 70 DOM
-
2026-06-01days on market $169,900 Active 69 DOM
-
2026-05-31days on market $169,900 Active 68 DOM
-
2026-05-30days on market $169,900 Active 67 DOM
-
2026-04-03price $169,900 74-char remark
Show marketing remark (74 chars)
Comfortable and Conveniently Located!! Fresh Paint!! 4/2 ready for you!
-
2026-03-24$179,000 Active 74-char remark
Show marketing remark (74 chars)
Comfortable and Conveniently Located!! Fresh Paint!! 4/2 ready for you!
ⓘ Source: listings_history table (triggers on properties + properties_extension) + one-shot
backfill from property_details.listing_events for pre-trigger history.
Climate risk First Street
- Flood 1/10 Low FEMA zone AE · 0% chance over 30 yrs
- Wildfire 1/10 Low
- Heat 7/10 Severe 7 d/yr ≥108°F today · 20 d/yr by 30 yrs out
- Wind 8/10 Severe 80% chance of damaging wind over 30 yrs
- Air quality 2/10 Low 0 unhealthy d/yr today · 1 by 30 yrs out
Nearby sold comps map
Loading sold comps map…
Walkable amenities ~0.75 mi
Loading nearby amenities…
Taxation est. · year 1
- Rental income
- $26,376
- − Mortgage interest
- −$9,517
- − Property taxes
- −$2,548
- − Insurance
- −$5,968
- − Repairs & maintenance
- −$2,110
- − Management
- −$2,110
- − Depreciation
- −$4,943
- Taxable loss
- −$820
- Est. tax savings @ 24.0%
- +$197
- After-tax cash flow
- $1,826/yr
For passive investors: Depreciation is non-cash, so a rental often shows a tax loss while cash-flowing — sheltering income. Rental losses are passive: they offset passive income freely, and up to $25,000/yr can offset ordinary (W-2) income if you actively participate and your MAGI is under $100k (phasing out to $0 by $150k); unused losses carry forward. On sale, claimed depreciation is recaptured at up to 25%, and gains may owe capital-gains tax (a 1031 exchange can defer both). Figures are a year-1 estimate at your 24.0% rate — not tax advice; consult a CPA.
Condition & rehab AI · 12 photos
This home is in good condition with fresh paint and a well-maintained exterior. It has potential for further updates to the flooring and kitchen cabinets to increase its value.
Repairs flagged
- Minor ceiling fans — light switches are visible
- Minor light switches — light switches are visible
Value-add opportunities
- Both Painting the exterior — Fresh paint is mentioned in the listing remarks
- Both Updating the flooring — Brick flooring could be replaced with hardwood or tile
- Both Updating the kitchen cabinets — White cabinets could be replaced with modern ones
Renovation cost estimate screening
| Repair item | Severity | Est. cost |
|---|---|---|
| ceiling fans · light switches are visible | Minor | $500–3,000 |
| light switches · light switches are visible | Minor | $500–3,000 |
| Total estimated repair cost · 2 items | $1,000–6,000 |
Value-add ROI direction
- Both Painting the exterior — Fresh paint is mentioned in the listing remarks ↑
- Both Updating the flooring — Brick flooring could be replaced with hardwood or tile ↑
- Both Updating the kitchen cabinets — White cabinets could be replaced with modern ones ↑
ⓘ Cost ranges are severity-bucket heuristics (US national rule-of-thumb). Get contractor quotes + a written scope before underwriting a rehab budget.
Schools (NCES district)
- District
- Jackson Public School District
- NCES district ID
- 2802190
- Math proficiency
- 9% ▼ -14.00%
- Reading proficiency
- 18% ▼ -7.00%
- Median HH income
- $33,234
- Composite
- 10.89/100
- National rank
- #9755
- State rank
- #112 of 130 in MS
Livability — Jackson
- Score
- 68/100
- State rank
- #66
- US rank
- #9695
Category grades
Schools grade is shown separately in the Schools card above.
Census & demographics
- Census place
- Jackson, MS
- County
- Hinds County · 167,040 people
- City population
- 140,204
- Metro
- Jackson, MS
- Population (ZIP)
- 23,838
- Household income
- $69,426
- Rent vs Own
- Severe rent burden
- 736.0
Population outlook (Hinds County) Hauer SSP2
- Today (2025)
- 242,528 people
- By 2030
- 241,113 · -0.6%
- By 2040
- 235,557 · -2.9%
- By 2050
- 226,946 · -6.4%
- By 2075
- 199,995 · -17.5%
- By 2100
- 164,165 · -32.3%
Race, ethnicity, and origin ACS 2023
- Neighborhood character
- Majority Black (59%)
- Race & ethnicity
- Black 59% White 36% Hispanic / Latino 3% Two or more races 2%
- Common ancestry
- Serbian 2% Italian 2% Slovak 1%
- Foreign-born
- 2% · Canada, China
- Languages at home
- 96% English-only · Spanish 3% Chinese 1%
Political lean MEDSL · Hinds
- 2024 margin
- Solid D (+46.1) · D 72.4% · R 26.3% · Other 1.4%
- 2008→2024 swing
- +7.1pp toward D · 2008: 39.0pp · 2024: 46.1pp
- All cycles
- 2024: D+46.1 2020: D+48.3 2016: D+43.7 2012: D+45.1 2008: D+39.0
Not yet ingested
- Civics
- —
Market trends
- HPI YoY
- ▼ -135.99%
- Current HPI
- 145.5192
- Rent YoY
- ▲ 7.90%
- Metro
- Jackson, MS
- State GDP YoY
- —
- F500 in state
- 0
Price history
-5.1% since first listed2 events — show timeline
- 2026-04-03 Price Changed $169,900 MLSU
- 2026-03-24 Listed $179,000 MLSU
Cash-flow waterfall
monthlySold comps — $/sqft
last 12 mo · ≤1 miLoading sold comps…