 🏷️ Likely Rental
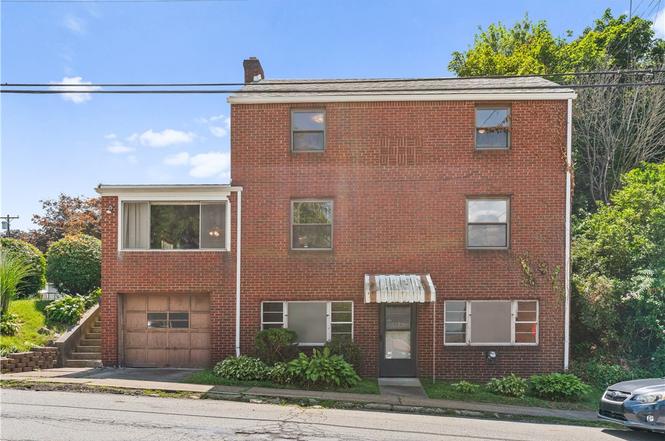
406 Juniper St · Versailles, PA
Flood risk 1/10 · Minimal
- FEMA flood zone
- X (unshaded)
- Chance of flooding over 30 yrs
- 0.0%
- Est. flood insurance / yr
- $473 – $860
Fire risk 1/10 · Minimal
- Est. fire insurance / yr
- $511 – $949
Heat risk 4/10 · Minor
- Hot days now (above 97°F)
- 7 days/yr
- Hot days in 30 yrs
- 19 days/yr
Wind risk 2/10 · Minimal
- Chance of severe wind over 30 yrs
- —
Air-quality risk 5/10 · Moderate
- Unhealthy air days now
- 9 days/yr
- Unhealthy air days in 30 yrs
- 11 days/yr
Risk factors via First Street. Map © Google.
Why this score? — see what drove the C grade
The composite is a weighted blend of 9 inputs, each scored 0–100. Each bar is that input's sub-score; the figure is the points it added to the 100-point composite (weight × sub-score).
- Cash flow +20.4/30.0
- ARV discount +15.0/15.0
- DSCR +6.5/10.0
- 1% rule +5.4/10.0
- Livability +3.9/5.0
- Rent growth +2.5/5.0
- Condition / age +2.5/5.0
- Schools +1.6/10.0
- Appreciation +0.0/10.0
$110,000
🖨 Deal sheet (PDF) 📄 Offer letter ✓ Due diligence
Listing remarks MLS
LARGE ENCLOSED PORCH CONVENIENT LOCATION TENANT OCCUPIED
Key facts
- Cozy gas fireplace
- Formal dining room
- Large living room
Tags
Property features AI
Finance
- HOA & community: Public transportation nearby
Exterior
- Parking: Attached garage with garage door opener; Built-in parking (total listed as 1)
- Utilities: Public water service; Public sewer service
- Home design: 2-story brick house; Resale property
- Construction: Brick construction; Asphalt roof; Home warranty included
- Exterior features: Public water; Public sewer; Lot approximately 0.1515 acres
Interior
- Kitchen: Cooktop; Stove; Microwave; Refrigerator; Some gas appliances
- Bedrooms: Upper-level bedrooms (two listed at 9x12 and one at 9x12; another upper room 10x13 listed without type)
- Flooring: Hardwood; Laminate
- Bathrooms: One full bathroom
- Heating & cooling: Forced-air gas heating; Central air conditioning
- Interior features: Unfinished walk-up basement; Gas fireplace in the living/family room
- Laundry & utility: Washer; Dryer
Neighborhood map
What this means for you Summary
Snapshot
- This is a 3-bed/1.5-bath single-family listed at $110k.
Deal economics
- At list price, monthly cash flow is $143 ($2k/yr) — positive.
- The deal already cash-flows at list — no discount required.
- Meets the 1% rule at list price ($1k rent vs $110k).
- Recommended offer: $97k (12.0% below list) — sets the bar for market timing.
Location & tenants
- Location reads 77/100 on livability (#318 in PA, #2,831 nationally) — a middle-class / working-renter tenant base. Strengths: commute A+, cost of living A+, housing A+; Watch: amenities C-, health & safety D+, employment F.
- Mckeesport Area SD (suburban): math 11% / reading 28% proficiency, ranked #499 of 539 in PA (top 93%) — low school quality limits family demand, transient renter base, plan for 1-2y turnover; 66% free/reduced lunch — lower-income household profile, screen leases tightly.
- Zoned schools: Founders Hall Middle Sch (math 2% / reading 26%, grade F, #480 of 512 statewide, top 94%, 695 students, 100% FRL); Mckeesport Area Shs (math 22% / reading 30%, grade F, #372 of 437 statewide, top 86%, 1,045 students, 78% FRL) — zoned schools average 89% FRL vs 66% district-wide (23 pts higher); higher-poverty schools than district average — tighter screening recommended.
- Market conditions: 114 active listings in the ZIP; 11 comparable units currently listed for rent nearby; rentals at typical pace (median 26d on market — plan ~3-4 weeks tenant-placement turnaround); 45% of comp listings sitting > 30 days — soft ceiling on asking rent; lower-income renter base — watch delinquency; 2,996 units permitted in Allegheny County in 2024 (1,588 in 5+ unit buildings).
- This rent runs 39% of the median local income ($35k/yr) — at the standard rent-burdened threshold; future hikes will face affordability resistance.
Forward outlook
- Local home prices are declining (-3.0%/yr); year-one equity from $761 of loan paydown is wiped out by about $3k of value loss. Plan a longer hold.
Negotiation context
- It's been on market 295 days — a 12% lower offer ($97k) is reasonable based on typical stale-listing flexibility.
- 4 sale attempts since 25y ago; this cycle's ask has dropped $15k (12%) from the opening price — seller is motivated, your offer sets the floor, not the list.
- Current owner paid $60k; list at $110k implies a 84% gain — meaningful room to come down on a strong offer.
Questions for the listing agent
- It's been on market 295 days. Have you received any prior offers? Is the seller open to a 12% concession, seller financing, or rate buy-down credit?
- Built in 1966 — when were the roof, HVAC, electrical panel, plumbing, and water heater last replaced?
- Why hasn't it sold? Are there any deal-killer items the seller is aware of (foundation, flood, title, zoning, code violations)?
- Is there a deadline driving the sale (1031 exchange, divorce, estate, relocation)? That informs how much negotiation room exists.
- Schools are D-rated, which usually means shorter tenancies and higher turnover. Who's the typical renter profile here, and what's been the actual vacancy rate?
- What's the average days-on-market for RENTAL listings here right now (not sales)? A rising rental-DOM trend means longer vacancies and softer asking-rent achievability than the comps imply.
- What's the recent tenant-quality profile in this submarket — average credit score on applications, eviction rate, late-payment / NSF rate, and stable-employment percentage? A property-management company in the area should have these aggregated.
- How much new for-sale + rental construction is in the pipeline within 1–3 miles? Heavy new supply typically softens prices + rents 12–24 months out; constrained supply supports both.
Investment metrics
- 1% rule
- 1.04% ✓
- Cap rate
- 7.85%
- Cash-on-cash
- 5.57%
- DSCR
- 1.25
- GRM
- 8.0
CMA / ARV
- ARV (on-the-fly)
- $150,528
- Comps found
- 12
Show comp detail 12 sales within ~0.75 mi
| Address | Dist | Beds/Ba | Sqft | Sold | Price | $/sf | Match |
|---|---|---|---|---|---|---|---|
| 406 Juniper St | 0.00mi | 3/1.0 | 1,344 (0%) | 1mo | $100,000 | $74 | 97 |
| 731 North Ln | 0.32mi | 3/1.0 | 1,350 (+0%) | 3mo | $65,000 | $48 | 80 |
| 4727 Penn Way | 0.21mi | 3/2.0 | 1,299 (-3%) | 5mo | $144,900 | $112 | 79 |
| 5014 3rd St | 0.29mi | 3/2.0 | 1,280 (-5%) | 5mo | $144,900 | $113 | 73 |
| 528 Chestnut St | 0.38mi | 3/2.5 | 1,350 (+0%) | 7mo | $170,000 | $126 | 72 |
| 4605 2nd St | 0.14mi | 3/2.0 | 1,504 (+12%) | 8mo | $54,000 | $36 | 65 |
| 5003 1st St | 0.34mi | 2/1.0 (-1) | 1,397 (+4%) | 7mo | $8,500 | $6 | 65 |
| 417 Beckman Dr | 0.63mi | 3/1.5 | 1,300 (-3%) | 1mo | $200,000 | $154 | 64 |
| 428 Greenwood Ave | 0.44mi | 3/1.0 | 1,222 (-9%) | 2mo | $139,900 | $114 | 61 |
| 302 Howe St | 0.73mi | 3/2.0 | 1,320 (-2%) | 8mo | $218,500 | $166 | 55 |
| 405 Lemon Ave | 0.48mi | 2/1.0 (-1) | 1,152 (-14%) | 6mo | $122,000 | $106 | 42 |
| 317 36th St | 0.70mi | 3/1.0 | 1,158 (-14%) | 3mo | $25,500 | $22 | 40 |
Match score weights: distance 35% · size 25% · config 20% · recency 20%. Top-matched comps best support the ARV.
Projected returns pro-forma
-3.0% appreciation · 3.0% rent growth · sell at horizon
- IRR
- -7.7%
- Equity multiple
- 0.72×
- Total profit
- $-8,698
- Equity at exit
- $16,401
- IRR
- 1.9%
- Equity multiple
- 1.14×
- Total profit
- $4,227
- Equity at exit
- $9,511
Cash invested: $30,800 (down + closing). Projections, not guarantees.
Landlord ↔ Tenant lean methodology
- Overall (STATE)
- 62 Landlord-Friendly
- State Pennsylvania
- 62 Landlord-Friendly · EVEN
- County
- — inherits STATE
- City
- — inherits STATE
ZIP-level market 15132
- Home prices YoY
- -32.9%
- Active inventory
- 114
- Price-to-rent
- 8.0×
Monthly cashflow live
- Estimated rent
- $1,145 high interval (Pro) →
- Mortgage (P&I)
- −$577
- Tax from tax record
- −$139 /mo · $1,663/yr
- Insurance
- −$46
- HOA
- −$0
- Vacancy / Maint / Mgmt
- −$240
- Net cashflow
- $143
Break-even live
Sensitivity live
| Price | -10% $205 | -5% $174 | +0% $143 | +5% $112 | +10% $81 |
|---|---|---|---|---|---|
| Rent | -10% $53 | -5% $98 | +0% $143 | +5% $188 | +10% $233 |
| Rate | -1.0pp $198 | -0.5pp $171 | base $143 | +0.5pp $115 | +1.0pp $86 |
UW: 25.0% down · 7.5% · 30yr · 1.5% tax · 5.0% vac · 8.0% maint · 8.0% mgmt
Financing live
Cash to close
- Down payment
- $27,500
- Closing costs
- $3,300
- Reserves months
- —
- Total cash needed
- —
Loan-product check · same deal, 3 products live
Conventional
25% down · 7.5% · 30yr
- Down + closing
- —
- Monthly P&I
- —
- Monthly cashflow
- —
- DSCR
- —
- Eligible?
- —
Personal DTI + credit; lowest rate.
DSCR
20% down · 8.5% · 30yr
- Down + closing
- —
- Monthly P&I
- —
- Monthly cashflow
- —
- DSCR
- —
- Eligible?
- —
No personal income docs; deal must DSCR.
Hard money
10% down · 12.0% · 12mo
- Down + closing
- —
- Monthly P&I
- —
- Monthly cashflow
- —
- DSCR
- —
- Eligible?
- —
Short-term bridge; refi at stabilization.
Rent comps 11 comps
| Address | Beds | Baths | Sqft | Rent | $/sqft | DOM | Units | Dist |
|---|---|---|---|---|---|---|---|---|
| 4719 3rd St Unit 2 McKeesport, PA | 3.0 | 1.0 | 1200 | $975 | $0.81 | 45d | 1 | 0.12mi |
| 5015 Walnut St Unit 1 McKeesport, PA | 2.0 | 1.0 | 980 | $950 | $0.97 | 45d | 1 | 0.26mi |
| 913 Center St McKeesport, PA | 1.0–2.0 | 1.0 | 900 | $1,010 | $1.12 | 0d | 7 | 0.64mi |
| 3211 Walnut St McKeesport, PA | 4.0 | 1.0 | 1434 | $1,500 | $1.05 | 9d | 1 | 0.89mi |
| 2408 McCarrell St McKeesport, PA | 4.0 | 1.0 | 1430 | $1,195 | $0.84 | 25d | 1 | 1.20mi |
| 152 Royal Oak Dr White Oak, PA | 1.0–2.0 | 1.0–2.0 | 930 | $1,445 | $1.55 | 3d | 9 | 1.34mi |
| 1300 Virginia Ave Apt 107 McKeesport, PA | 2.0 | 1.0 | 900 | $950 | $1.06 | 45d | 1 | 1.37mi |
| 3506 Mayfair St Unit B McKeesport, PA | 2.0 | 1.0 | 948 | $1,200 | $1.27 | 45d | 1 | 1.41mi |
| 311-313 24th St McKeesport, PA | 2.0 | 1.0 | 950 | $900 | $0.95 | 45d | 1 | 1.42mi |
| 3710 Mayfair St McKeesport, PA | 3.0 | 1.5 | 1314 | $1,095 | $0.83 | 5d | 1 | 1.47mi |
| 2618 Poinsettia Dr White Oak, PA | 4.0 | 1.0 | 1225 | $1,599 | $1.31 | 25d | 1 | 1.48mi |
Listing history 13 events
-
2026-05-21status Pending
-
2026-04-14historical Contingent
-
2026-04-08price $110,000
-
2026-03-25status Active
-
2026-03-06historical Contingent
-
2025-11-27price $115,000
-
2025-10-18price $120,000
-
2025-09-17status Active
-
2025-08-22historical Contingent
-
2025-07-30$125,000 Active
-
2001-11-01soldstatus $59,900
-
2001-10-31soldstatus $59,900 56-char remark
Show marketing remark (56 chars)
LARGE ENCLOSED PORCH CONVENIENT LOCATION TENANT OCCUPIED
-
2001-01-19$59,900 56-char remark
Show marketing remark (56 chars)
LARGE ENCLOSED PORCH CONVENIENT LOCATION TENANT OCCUPIED
ⓘ Source: listings_history table (triggers on properties + properties_extension) + one-shot
backfill from property_details.listing_events for pre-trigger history.
Tax reassessment forecast PA · Partial reset (capped growth)
- Current annual tax
- $1,663 · $139/mo
- Projected year-2 tax
- $1,701 · $142/mo
- Expected delta
- +$37/yr (+$3/mo · 2.2%)
ⓘ Screening estimate from a state-policy table — verify with the county assessor before closing.
Climate risk First Street
- Flood 1/10 Low FEMA zone X (unshaded) · 0% chance over 30 yrs
- Wildfire 1/10 Low
- Heat 4/10 Moderate 7 d/yr ≥97°F today · 19 d/yr by 30 yrs out
- Wind 2/10 Low
- Air quality 5/10 Major 9 unhealthy d/yr today · 11 by 30 yrs out
Nearby sold comps map
Loading sold comps map…
Walkable amenities ~0.75 mi
Loading nearby amenities…
Taxation est. · year 1
- Rental income
- $13,736
- − Mortgage interest
- −$6,162
- − Property taxes
- −$1,663
- − Insurance
- −$550
- − Repairs & maintenance
- −$1,099
- − Management
- −$1,099
- − Depreciation
- −$3,200
- Taxable loss
- −$37
- Est. tax savings @ 24.0%
- +$9
- After-tax cash flow
- $1,725/yr
For passive investors: Depreciation is non-cash, so a rental often shows a tax loss while cash-flowing — sheltering income. Rental losses are passive: they offset passive income freely, and up to $25,000/yr can offset ordinary (W-2) income if you actively participate and your MAGI is under $100k (phasing out to $0 by $150k); unused losses carry forward. On sale, claimed depreciation is recaptured at up to 25%, and gains may owe capital-gains tax (a 1031 exchange can defer both). Figures are a year-1 estimate at your 24.0% rate — not tax advice; consult a CPA.
Schools (NCES district)
- District
- Mckeesport Area SD
- NCES district ID
- 4214940
- Math proficiency
- 11% ▼ -9.00%
- Reading proficiency
- 28% ▼ -10.00%
- Median HH income
- $33,779
- Composite
- 15.88/100
- National rank
- #9257
- State rank
- #499 of 539 in PA
Livability — Versailles
- Score
- 77/100
- State rank
- #318
- US rank
- #2831
Category grades
Schools grade is shown separately in the Schools card above.
Census & demographics
- Census place
- Versailles, PA
- County
- Allegheny County · 1,022,028 people
- Metro
- Pittsburgh, PA
- Population (ZIP)
- 18,898
- Household income
- $35,397
- Rent vs Own
- Severe rent burden
- 1239.0
Population outlook (Allegheny County) Hauer SSP2
- Today (2025)
- 1,250,282 people
- By 2030
- 1,256,482 · +0.5%
- By 2040
- 1,256,318 · +0.5%
- By 2050
- 1,244,169 · -0.5%
- By 2075
- 1,197,693 · -4.2%
- By 2100
- 1,093,187 · -12.6%
Race, ethnicity, and origin ACS 2023
- Neighborhood character
- Diverse neighborhood (Simpson 0.62)
- Race & ethnicity
- White 50% Black 35% Two or more races 10% Hispanic / Latino 4% Asian 1%
- Common ancestry
- Romanian 5% Serbian 2% Scotch-Irish 2%
- Foreign-born
- 2% · Canada, China
- Languages at home
- 96% English-only · Spanish 3%
Political lean MEDSL · Allegheny
- 2024 margin
- Strong D (+20.3) · D 59.7% · R 39.4%
- 2008→2024 swing
- +4.8pp toward D · 2008: 15.5pp · 2024: 20.3pp
- All cycles
- 2024: D+20.3 2020: D+20.4 2016: D+16.4 2012: D+14.4 2008: D+15.5
Not yet ingested
- Civics
- —
Market trends
- HPI YoY
- ▼ -71.01%
- Current HPI
- 145.195
- Rent YoY
- —
- Metro
- Pittsburgh, PA
- State GDP YoY
- ▲ 1.68%
- F500 in state
- 34
Industry mix (Fortune 500 HQ in PA)
| Industry | F500 HQs | Revenue |
|---|---|---|
| Healthcare | 2 | $309B |
|
||
| Insurance | 2 | $27B |
|
||
| Telecommunications / Media | 1 | $124B |
|
||
| Industrial Distribution | 1 | $22B |
|
||
| Financial Services | 1 | $20B |
|
||
| Chemicals / Materials | 1 | $18B |
|
||
Price history
+83.6% since first listed13 events — show timeline
- 2026-05-21 Pending — West Penn MLS
- 2026-04-14 Contingent — West Penn MLS
- 2026-04-08 Price Changed $110,000 West Penn MLS
- 2026-03-25 Relisted — West Penn MLS
- 2026-03-06 Contingent — West Penn MLS
- 2025-11-27 Price Changed $115,000 West Penn MLS
- 2025-10-18 Price Changed $120,000 West Penn MLS
- 2025-09-17 Relisted — West Penn MLS
- 2025-08-22 Contingent — West Penn MLS
- 2025-07-30 Listed $125,000 West Penn MLS
- 2001-11-01 Sold (Public Records) $59,900 Public Records
- 2001-10-31 Sold (MLS) $59,900 West Penn MLS
- 2001-01-19 Listed $59,900 West Penn MLS
Property tax history
+1.5%/yrLatest (2026): $1,663 · +0.0% YoY. Source: county tax records.
Cash-flow waterfall
monthlySold comps — $/sqft
last 12 mo · ≤1 miLoading sold comps…