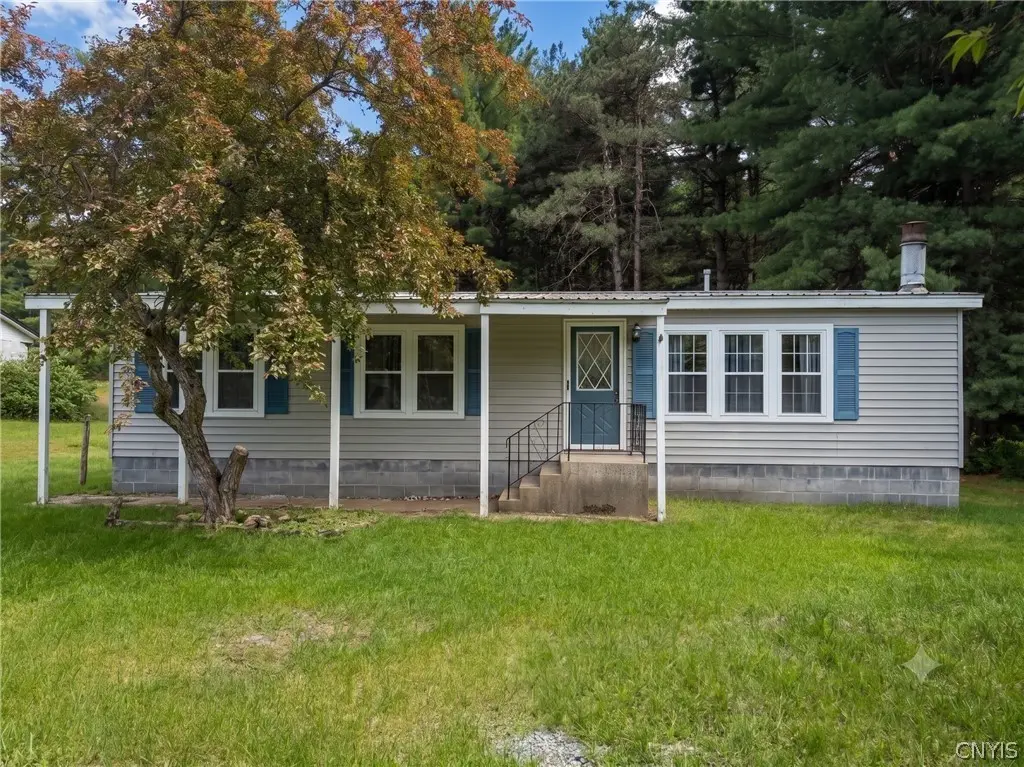
30072 State Route 3 · Felts Mills, NY
Flood risk 5/10 · Moderate
- FEMA flood zone
- X
- Chance of flooding over 30 yrs
- 0.67%
- Est. flood insurance / yr
- $507 – $1,088
Fire risk 2/10 · Minimal
- Est. fire insurance / yr
- $691 – $1,283
Heat risk 1/10 · Minimal
- Hot days now (above 90°F)
- 7 days/yr
- Hot days in 30 yrs
- 15 days/yr
Wind risk 1/10 · Minimal
- Chance of severe wind over 30 yrs
- —
Air-quality risk 2/10 · Minimal
- Unhealthy air days now
- 1 days/yr
- Unhealthy air days in 30 yrs
- 1 days/yr
Risk factors via First Street. Map © Google.
Why this score? — see what drove the C+ grade
The composite is a weighted blend of 9 inputs, each scored 0–100. Each bar is that input's sub-score; the figure is the points it added to the 100-point composite (weight × sub-score).
- Cash flow +24.4/30.0
- DSCR +7.9/10.0
- ARV discount +7.5/15.0
- Appreciation +6.4/10.0
- 1% rule +5.9/10.0
- Schools +3.3/10.0
- Livability +2.9/5.0
- Rent growth +2.5/5.0
- Condition / age +2.5/5.0
$169,900
🖨 Deal sheet 📄 Offer letter ✓ Due diligence
Listing remarks MLS
Double-wide that's in need updating but has a great location close to Ft Drum. This property has good bones and could become a updated flip or rental or your home.
Key facts
- Expansive kitchen
- Walk-in closet
- Light-up mirror
Tags
Property features AI
Exterior
- Parking: No garage
- Utilities: Public water connected; Sewer connected
- Home design: Single-story home; Existing residence; Vinyl siding
- Construction: Block foundation; Vinyl siding construction
- Exterior features: Gravel driveway; Rectangular lot; Main thoroughfare road frontage
Interior
- Kitchen: Gas cooktop
- Bedrooms: Three main-level bedrooms
- Flooring: Carpet; Luxury vinyl; Varied flooring
- Bathrooms: One full bathroom on main level
- Heating & cooling: Gas forced-air heating
- Interior features: Eat-in kitchen; Bedroom on main level; Crawl space basement; Fireplace (1)
- Laundry & utility: Gas water heater
Neighborhood map
What this means for you Summary
Snapshot
- This is a 3-bed/1.0-bath manufactured listed at $170k.
Deal economics
- At list price, monthly cash flow is $346 ($4k/yr) — positive.
- The deal already cash-flows at list — no discount required.
- Meets the 1% rule at list price ($2k rent vs $170k).
- Recommended offer: $167k (1.5% below list) — sets the bar for market timing.
Location & tenants
- Location reads 58/100 on livability (#1,045 in NY) — a working-class tenant base; expect higher turnover. Strengths: cost of living A+; Watch: employment D+, health & safety D, crime F.
- Carthage Central School District (rural): math 30% / reading 46% proficiency, ranked #539 of 590 in NY (top 91%) — families likely to look elsewhere, expect single-tenant / working-renter base with shorter leases.
- Market conditions: 21 active listings in the ZIP; 196 units permitted in Jefferson County in 2024 (0 in 5+ unit buildings).
Forward outlook
- In year one you build about $6k of equity ($1k loan paydown + $5k appreciation (2.8% local appreciation)).
- Jefferson County population projected at -12% by 2050 — secular population decline; favor cash flow + early exit over multi-decade hold.
- At projected returns (2.8% appreciation + 3.0% rent growth), your $48k cash investment doubles in ~5 years — after that, you're playing with house money.
- By year 6, paydown + projected appreciation supports a ~$31k cash-out refi (75% LTV) — recoverable capital for the next deal without selling this one.
Negotiation context
- It's been on market 18 days — a 2% lower offer ($167k) is reasonable based on typical stale-listing flexibility.
- 4 sale attempts since 10y ago with the ask held roughly flat each time — persistent listings suggest the price (not the market) is what's stuck; bring a comps-based counter.
- Current owner paid $55k; list at $170k implies a 209% gain — meaningful room to come down on a strong offer.
Risks & watch-outs
- Climate carrying-cost: moderate flood risk — expect insurance premiums to compound above CPI over the hold.
Questions for the listing agent
- Built in 1978 — when were the roof, HVAC, electrical panel, plumbing, and water heater last replaced?
- Is there a deadline driving the sale (1031 exchange, divorce, estate, relocation)? That informs how much negotiation room exists.
- Crime grade is F in this area — have there been break-ins, vandalism, or insurance claims at this property in the last 3 years? What carrier currently insures it and at what premium?
- What's the average days-on-market for RENTAL listings here right now (not sales)? A rising rental-DOM trend means longer vacancies and softer asking-rent achievability than the comps imply.
- What's the recent tenant-quality profile in this submarket — average credit score on applications, eviction rate, late-payment / NSF rate, and stable-employment percentage? A property-management company in the area should have these aggregated.
- How much new for-sale + rental construction is in the pipeline within 1–3 miles? Heavy new supply typically softens prices + rents 12–24 months out; constrained supply supports both.
Investment metrics
- 1% rule
- 1.09% ✓
- Cap rate
- 8.74%
- Cash-on-cash
- 8.74%
- DSCR
- 1.39
- GRM
- 7.7
CMA / ARV
No comps found within radius.
Projected returns pro-forma
2.77% appreciation · 3.0% rent growth · sell at horizon
- IRR
- 15.1%
- Equity multiple
- 1.85×
- Total profit
- $40,491
- Equity at exit
- $74,229
- IRR
- 17.0%
- Equity multiple
- 3.43×
- Total profit
- $115,782
- Equity at exit
- $112,739
Cash invested: $47,572 (down + closing). Projections, not guarantees.
Landlord ↔ Tenant lean methodology
- Overall (STATE)
- 15 Strongly Tenant-Friendly
- State New York
- 15 Strongly Tenant-Friendly · D+10
- County
- — inherits STATE
- City
- — inherits STATE
ZIP-level market 13612
- Home prices YoY
- 0.7%
- Active inventory
- 21
- Price-to-rent
- 7.7×
Monthly cashflow live
- Estimated rent
- $1,849 medium interval (Pro) →
- Mortgage (P&I)
- −$891
- Tax from tax record
- −$152 /mo · $1,826/yr
- Insurance
- −$71
- HOA
- −$0
- Vacancy / Maint / Mgmt
- −$388
- Net cashflow
- $346
Break-even live
UW: 25.0% down · 7.5% · 30yr · 1.5% tax · 5.0% vac · 8.0% maint · 8.0% mgmt
Financing live
Cash to close
- Down payment
- $42,475
- Closing costs
- $5,097
- Reserves months
- —
- Total cash needed
- —
Loan-product check · same deal, 3 products live
Conventional
25% down · 7.5% · 30yr
- Down + closing
- —
- Monthly P&I
- —
- Monthly cashflow
- —
- DSCR
- —
- Eligible?
- —
Personal DTI + credit; lowest rate.
DSCR
20% down · 8.5% · 30yr
- Down + closing
- —
- Monthly P&I
- —
- Monthly cashflow
- —
- DSCR
- —
- Eligible?
- —
No personal income docs; deal must DSCR.
Hard money
10% down · 12.0% · 12mo
- Down + closing
- —
- Monthly P&I
- —
- Monthly cashflow
- —
- DSCR
- —
- Eligible?
- —
Short-term bridge; refi at stabilization.
Listing history 14 events
-
2026-06-19days on market $169,900 Active 18 DOM
-
2026-06-18days on market $169,900 Active 17 DOM
-
2026-06-17days on market $169,900 Active 16 DOM
-
2026-06-16days on market $169,900 Active 15 DOM
-
2026-06-15days on market $169,900 Active 14 DOM
-
2026-06-14days on market $169,900 Active 12 DOM
-
2026-06-12days on market $169,900 Active 11 DOM
-
2026-06-09days on market $169,900 Active 8 DOM
-
2026-06-08days on market $169,900 Active 7 DOM
-
2026-06-07days on market $169,900 Active 6 DOM
-
2026-06-05days on market $169,900 Active 3 DOM
-
2026-06-03days on market $169,900 Active 2 DOM
-
2026-06-02remarks 628-char remark
-
2026-06-02$169,900 Active 1 DOM
ⓘ Source: listings_history table (triggers on properties + properties_extension) + one-shot
backfill from property_details.listing_events for pre-trigger history.
Tax reassessment forecast NY · Partial reset (capped growth)
- Current annual tax
- $1,826 · $152/mo
- Projected year-2 tax
- $2,349 · $196/mo
- Expected delta
- +$522/yr (+$44/mo · 28.6%)
ⓘ Screening estimate from a state-policy table — verify with the county assessor before closing.
Climate risk First Street
- Flood 5/10 Major FEMA zone X · 67% chance over 30 yrs
- Wildfire 2/10 Low
- Heat 1/10 Low 7 d/yr ≥90°F today · 15 d/yr by 30 yrs out
- Wind 1/10 Low
- Air quality 2/10 Low 1 unhealthy d/yr today · 1 by 30 yrs out
Nearby sold comps map
Loading sold comps map…
Walkable amenities ~0.75 mi
Loading nearby amenities…
Taxation est. · year 1
- Rental income
- $22,184
- − Mortgage interest
- −$9,517
- − Property taxes
- −$1,826
- − Insurance
- −$850
- − Repairs & maintenance
- −$1,775
- − Management
- −$1,775
- − Depreciation
- −$4,943
- Taxable income
- $1,499
- Est. tax owed @ 24.0%
- −$360
- After-tax cash flow
- $3,798/yr
For passive investors: Depreciation is non-cash, so a rental often shows a tax loss while cash-flowing — sheltering income. Rental losses are passive: they offset passive income freely, and up to $25,000/yr can offset ordinary (W-2) income if you actively participate and your MAGI is under $100k (phasing out to $0 by $150k); unused losses carry forward. On sale, claimed depreciation is recaptured at up to 25%, and gains may owe capital-gains tax (a 1031 exchange can defer both). Figures are a year-1 estimate at your 24.0% rate — not tax advice; consult a CPA.
Schools (NCES district)
- District
- Carthage Central School District
- NCES district ID
- 3606630
- Math proficiency
- 30% ▼ -18.00%
- Reading proficiency
- 46% ▲ 2.00%
- Median HH income
- $48,450
- Composite
- 32.63/100
- National rank
- #5668
- State rank
- #539 of 590 in NY
Livability — Felts Mills
- Score
- 58/100
- State rank
- #1045
- US rank
- #20734
Category grades
Schools grade is shown separately in the Schools card above.
Census & demographics
- Census place
- Felts Mills, NY
- City population
- 172
- Population (ZIP)
- 2,940
Population outlook (Jefferson County) Hauer SSP2
- Today (2025)
- 111,748 people
- By 2030
- 109,370 · -2.1%
- By 2040
- 103,828 · -7.1%
- By 2050
- 98,523 · -11.8%
- By 2075
- 91,422 · -18.2%
- By 2100
- 78,214 · -30.0%
Race, ethnicity, and origin ACS 2023
- Neighborhood character
- Predominantly White (91%)
- Race & ethnicity
- White 91% Two or more races 4% Asian 3% Hispanic / Latino 3%
- Common ancestry
- Lithuanian 4% Romanian 3% Italian 2%
- Foreign-born
- 6% · South Korea, Canada
- Languages at home
- 94% English-only · Korean 3% Spanish 2% Tagalog/Filipino 1%
Political lean MEDSL · Jefferson
- 2024 margin
- Strong R (+23.6) · D 38.2% · R 61.8%
- 2008→2024 swing
- -18.3pp toward R · 2008: -5.3pp · 2024: -23.6pp
- All cycles
- 2024: R+23.6 2020: R+19.0 2016: R+22.4 2012: R+2.9 2008: R+5.3
Not yet ingested
- Civics
- —
Market trends
- HPI YoY
- ▲ 2.77%
- Current HPI
- 415.9603
- Rent YoY
- —
- Metro
- —
- State GDP YoY
- ▲ 2.60%
- F500 in state
- 92
Industry mix (Fortune 500 HQ in NY)
| Industry | F500 HQs | Revenue |
|---|---|---|
| Financial Services | 10 | $950B |
|
||
| Consumer Goods | 9 | $162B |
|
||
| Insurance | 4 | $225B |
|
||
| Telecommunications | 2 | $144B |
|
||
| Pharmaceuticals | 2 | $112B |
|
||
| Media / Entertainment | 2 | $69B |
|
||
Price history
+115.1% since first listed10 events — show timeline
- 2026-06-01 Listed $169,900 CNYIS
- 2026-05-23 Listing Removed — CNYIS
- 2026-03-24 Contingent — CNYIS
- 2026-03-17 Price Changed $169,990 CNYIS
- 2026-02-27 Listed $179,900 CNYIS
- 2025-10-12 Sold (MLS) $55,000 CNYIS
- 2025-07-24 Pending — CNYIS
- 2025-07-22 Listed $79,900 CNYIS
- 2017-04-01 Listing Removed — CNYIS
- 2016-06-18 Listed $79,000 CNYIS
Property tax history
+4.4%/yrLatest (2025): $1,826 · +4.9% YoY. Source: county tax records.
Cash-flow waterfall
monthlySold comps — $/sqft
last 12 mo · ≤1 miLoading sold comps…