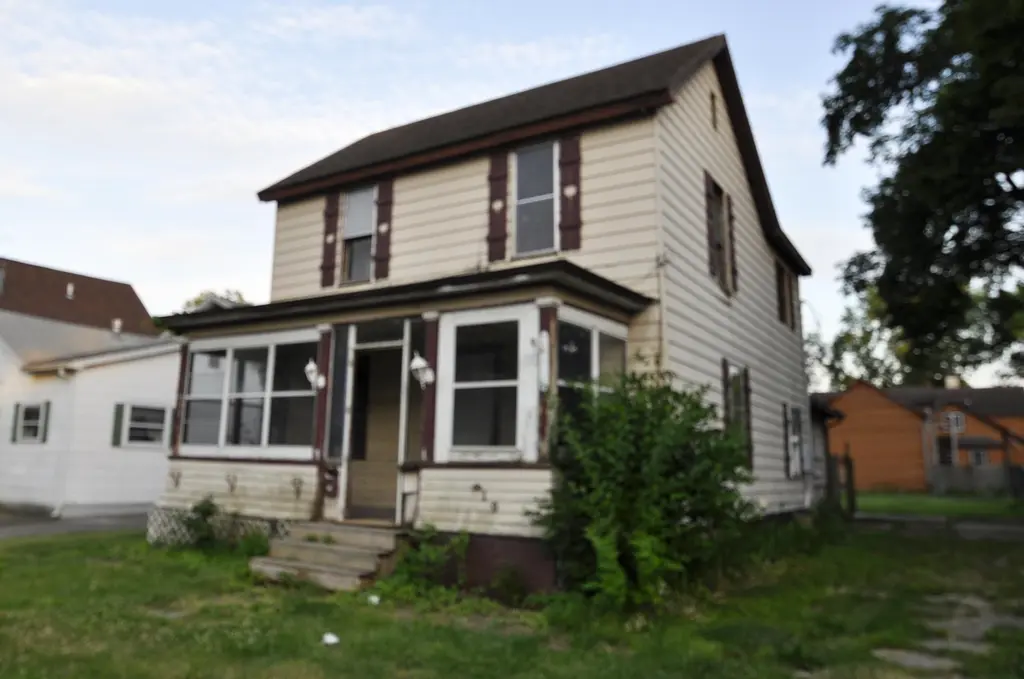
919 Webster St · Ottawa, IL
Flood risk 6/10 · Moderate
- FEMA flood zone
- X (unshaded)
- Chance of flooding over 30 yrs
- 0.7%
- Est. flood insurance / yr
- $473 – $860
Fire risk 4/10 · Minor
- Est. fire insurance / yr
- $804 – $1,492
Heat risk 3/10 · Minor
- Hot days now (above 102°F)
- 7 days/yr
- Hot days in 30 yrs
- 17 days/yr
Wind risk 2/10 · Minimal
- Chance of severe wind over 30 yrs
- 1.0%
Air-quality risk 2/10 · Minimal
- Unhealthy air days now
- 1 days/yr
- Unhealthy air days in 30 yrs
- 2 days/yr
Risk factors via First Street. Map © Google.
Why this score? — see what drove the B- grade
The composite is a weighted blend of 9 inputs, each scored 0–100. Each bar is that input's sub-score; the figure is the points it added to the 100-point composite (weight × sub-score).
- Cash flow +30.0/30.0
- 1% rule +10.0/10.0
- DSCR +10.0/10.0
- ARV discount +7.5/15.0
- Livability +3.9/5.0
- Schools +2.7/10.0
- Rent growth +2.5/5.0
- Condition / age +2.5/5.0
- Appreciation +0.0/10.0
$49,000
🖨 Deal sheet 📄 Offer letter ✓ Due diligence
Listing remarks MLS
The blank slate you are waiting for. Located on Ottawa's West side, this approx 1500 Sqft fixer is gutted and ready for your ideas.
Key facts
- 5,663 sq ft lot
- Built 1895
- Listed 5 days
Property features AI
Exterior
- Utilities: Public water; Public sewer
- Home design: Residential single-family house; 2 stories
- Construction: Built as a house
- Exterior features: Shingle roof
Interior
- Heating & cooling: Natural gas heating; Has heating
- Interior features: Gas water heater; Partial basement
Neighborhood map
What this means for you Summary
Snapshot
- This is a 3-bed/?-bath single-family listed at $49k.
Deal economics
- At list price, monthly cash flow is $1k ($13k/yr) — positive.
- The deal already cash-flows at list — no discount required.
- Meets the 1% rule at list price ($2k rent vs $49k).
- Cap rate 32.2% vs local median 3.1% in Ottawa — top-decile yield for the area; either an underpriced asset or a hidden risk that comps aren't pricing in. Stress-test before assuming the spread holds.
Location & tenants
- Location reads 77/100 on livability (#172 in IL, #3,175 nationally) — a middle-class / working-renter tenant base. Strengths: cost of living A+, health & safety A+, housing A; Watch: employment C-, schools D, amenities D.
- Ottawa Twp Hsd 140 (town): math 25% / reading 30% proficiency, ranked #545 of 919 in IL (top 59%) — low school quality limits family demand, transient renter base, plan for 1-2y turnover.
- Market conditions: 205 active listings in the ZIP; 1 comparable units currently listed for rent nearby; solid renter incomes; 82 units permitted in LaSalle County in 2024 (0 in 5+ unit buildings).
Forward outlook
- Local home prices are declining (-3.0%/yr); year-one equity from $339 of loan paydown is wiped out by about $1k of value loss. Plan a longer hold.
- LaSalle County population projected at -16% by 2050 — secular population decline; favor cash flow + early exit over multi-decade hold.
- At projected returns (-3.0% appreciation + 3.0% rent growth), your $14k cash investment doubles in ~2 years — after that, you're playing with house money.
Negotiation context
- Only 6 days on market — expect competitive offers; lowballing is unlikely to land.
- 5 sale attempts since 18y ago with the ask held roughly flat each time — persistent listings suggest the price (not the market) is what's stuck; bring a comps-based counter.
- Current owner paid $27k; list at $49k implies a 84% gain — meaningful room to come down on a strong offer.
Risks & watch-outs
- Watch-outs: built in 1895 — expect roof / HVAC / electrical / plumbing capex.
- Climate carrying-cost: major flood risk — expect insurance premiums to compound above CPI over the hold.
Questions for the listing agent
- Built in 1895 — when were the roof, HVAC, electrical panel, plumbing, and water heater last replaced?
- Is there a deadline driving the sale (1031 exchange, divorce, estate, relocation)? That informs how much negotiation room exists.
- Schools are D-rated, which usually means shorter tenancies and higher turnover. Who's the typical renter profile here, and what's been the actual vacancy rate?
- What's the average days-on-market for RENTAL listings here right now (not sales)? A rising rental-DOM trend means longer vacancies and softer asking-rent achievability than the comps imply.
- What's the recent tenant-quality profile in this submarket — average credit score on applications, eviction rate, late-payment / NSF rate, and stable-employment percentage? A property-management company in the area should have these aggregated.
- How much new for-sale + rental construction is in the pipeline within 1–3 miles? Heavy new supply typically softens prices + rents 12–24 months out; constrained supply supports both.
Investment metrics
- 1% rule
- 3.60% ✓
- Cap rate
- 32.17%
- Cash-on-cash
- 92.41%
- DSCR
- 5.11
- GRM
- 2.3
CMA / ARV
- ARV (on-the-fly)
- $216,788
- Comps found
- 12
Show comp detail 12 sales within ~0.75 mi
| Address | Dist | Beds/Ba | Sqft | Sold | Price | $/sf | Match |
|---|---|---|---|---|---|---|---|
| 845 Hitt St | 0.53mi | 3/2.0 | 1,575 (+4%) | 2mo | $245,000 | $156 | 67 |
| 1000 Douglas St | 0.18mi | 3/2.5 | 1,288 (-15%) | 4mo | $216,000 | $168 | 64 |
| 1331 W Washington St | 0.49mi | 3/2.0 | 1,595 (+5%) | 6mo | $195,900 | $123 | 63 |
| 639 W Madison St | 0.24mi | 2/1.0 (-1) | 1,315 (-13%) | 1mo | $59,000 | $45 | 61 |
| 915 W Superior St | 0.48mi | 4/1.5 (+1) | 1,400 (-8%) | 0mo | $133,567 | $95 | 59 |
| 1107 W Lafayette St | 0.35mi | 4/1.5 (+1) | 1,616 (+7%) | 10mo | $213,500 | $132 | 59 |
| 1322 W Madison St | 0.28mi | 3/2.0 | 1,298 (-14%) | 8mo | $275,000 | $212 | 57 |
| 700 W Lafayette St | 0.40mi | 3/2.0 | 1,684 (+11%) | 10mo | $201,000 | $119 | 54 |
| 913 Canal St | 0.51mi | 3/1.0 | 1,296 (-14%) | 0mo | $185,000 | $143 | 52 |
| 1515 Johnson St | 0.68mi | 3/1.0 | 1,384 (-9%) | 9mo | $162,500 | $117 | 46 |
| 1525 Clark St | 0.71mi | 2/1.5 (-1) | 1,374 (-9%) | 1mo | $250,000 | $182 | 45 |
| 3472 N IL ST RT 23 | 0.59mi | 3/2.0 | 1,698 (+12%) | 11mo | $381,500 | $225 | 44 |
Match score weights: distance 35% · size 25% · config 20% · recency 20%. Top-matched comps best support the ARV.
Projected returns pro-forma
-3.0% appreciation · 3.0% rent growth · sell at horizon
- IRR
- 93.2%
- Equity multiple
- 5.33×
- Total profit
- $59,382
- Equity at exit
- $7,306
- IRR
- 96.0%
- Equity multiple
- 11.09×
- Total profit
- $138,470
- Equity at exit
- $4,237
Cash invested: $13,720 (down + closing). Projections, not guarantees.
Landlord ↔ Tenant lean methodology
- Overall (STATE)
- 43 Moderately Tenant-Leaning
- State Illinois
- 43 Moderately Tenant-Leaning · D+7
- County
- — inherits STATE
- City
- — inherits STATE
ZIP-level market 61350
- Home prices YoY
- -31.5%
- Active inventory
- 205
- Price-to-rent
- 2.3×
Monthly cashflow live
- Estimated rent
- $1,766 medium interval (Pro) →
- Mortgage (P&I)
- −$257
- Tax est. 1.5%
- −$61 /mo · $735/yr
- Insurance
- −$20
- HOA
- −$0
- Vacancy / Maint / Mgmt
- −$371
- Net cashflow
- $1,057
Break-even live
UW: 25.0% down · 7.5% · 30yr · 1.5% tax · 5.0% vac · 8.0% maint · 8.0% mgmt
Financing live
Cash to close
- Down payment
- $12,250
- Closing costs
- $1,470
- Reserves months
- —
- Total cash needed
- —
Loan-product check · same deal, 3 products live
Conventional
25% down · 7.5% · 30yr
- Down + closing
- —
- Monthly P&I
- —
- Monthly cashflow
- —
- DSCR
- —
- Eligible?
- —
Personal DTI + credit; lowest rate.
DSCR
20% down · 8.5% · 30yr
- Down + closing
- —
- Monthly P&I
- —
- Monthly cashflow
- —
- DSCR
- —
- Eligible?
- —
No personal income docs; deal must DSCR.
Hard money
10% down · 12.0% · 12mo
- Down + closing
- —
- Monthly P&I
- —
- Monthly cashflow
- —
- DSCR
- —
- Eligible?
- —
Short-term bridge; refi at stabilization.
Rent comps 1 comps
| Address | Beds | Baths | Sqft | Rent | $/sqft | DOM | Units | Dist |
|---|---|---|---|---|---|---|---|---|
| 307 E Superior St Ottawa, IL | 3.0 | 2.0 | 2200 | $1,800 | $0.82 | 24d | 1 | 0.97mi |
Listing history 7 events
-
2026-06-19days on market $49,000 Active 6 DOM
-
2026-06-18days on market $49,000 Active 5 DOM
-
2026-06-17days on market $49,000 Active 4 DOM
-
2026-06-16days on market $49,000 Active 3 DOM
-
2026-06-15days on market $49,000 Active 2 DOM
-
2026-06-14remarks 131-char remark
-
2026-06-14$49,000 Active 1 DOM
ⓘ Source: listings_history table (triggers on properties + properties_extension) + one-shot
backfill from property_details.listing_events for pre-trigger history.
Climate risk First Street
- Flood 6/10 Major FEMA zone X (unshaded) · 70% chance over 30 yrs
- Wildfire 4/10 Moderate
- Heat 3/10 Moderate 7 d/yr ≥102°F today · 17 d/yr by 30 yrs out
- Wind 2/10 Low 100% chance of damaging wind over 30 yrs
- Air quality 2/10 Low 1 unhealthy d/yr today · 2 by 30 yrs out
Nearby sold comps map
Loading sold comps map…
Walkable amenities ~0.75 mi
Loading nearby amenities…
Taxation est. · year 1
- Rental income
- $21,193
- − Mortgage interest
- −$2,745
- − Property taxes
- −$735
- − Insurance
- −$245
- − Repairs & maintenance
- −$1,695
- − Management
- −$1,695
- − Depreciation
- −$1,425
- Taxable income
- $12,652
- Est. tax owed @ 24.0%
- −$3,037
- After-tax cash flow
- $9,643/yr
For passive investors: Depreciation is non-cash, so a rental often shows a tax loss while cash-flowing — sheltering income. Rental losses are passive: they offset passive income freely, and up to $25,000/yr can offset ordinary (W-2) income if you actively participate and your MAGI is under $100k (phasing out to $0 by $150k); unused losses carry forward. On sale, claimed depreciation is recaptured at up to 25%, and gains may owe capital-gains tax (a 1031 exchange can defer both). Figures are a year-1 estimate at your 24.0% rate — not tax advice; consult a CPA.
Schools (NCES district)
- District
- Ottawa Twp Hsd 140
- NCES district ID
- 1730330
- Math proficiency
- 25% ▼ -3.00%
- Reading proficiency
- 30% ▼ -4.00%
- Median HH income
- $47,828
- Composite
- 26.85/100
- National rank
- #12528
- State rank
- #545 of 919 in IL
Livability — Ottawa
- Score
- 77/100
- State rank
- #172
- US rank
- #3175
Category grades
Schools grade is shown separately in the Schools card above.
Census & demographics
- Census place
- Ottawa, IL
- County
- La Salle County · 41,676 people
- City population
- 23,713
- Metro
- Ottawa, IL
- Population (ZIP)
- 23,713
- Household income
- $77,921
- Rent vs Own
- Severe rent burden
- 628.0
Population outlook (LaSalle County) Hauer SSP2
- Today (2025)
- 107,080 people
- By 2030
- 104,196 · -2.7%
- By 2040
- 97,413 · -9.0%
- By 2050
- 90,294 · -15.7%
- By 2075
- 76,252 · -28.8%
- By 2100
- 61,339 · -42.7%
Race, ethnicity, and origin ACS 2023
- Neighborhood character
- Predominantly White (85%)
- Race & ethnicity
- White 85% Hispanic / Latino 9% Two or more races 4% Black 2%
- Hispanic origin (detail)
- Mexican 7%
- Common ancestry
- Romanian 6% Portuguese 5% Lithuanian 2%
- Foreign-born
- 2% · Canada
- Languages at home
- 95% English-only · Spanish 3%
Political lean MEDSL · LaSalle
- 2024 margin
- R (+18.5) · D 40.1% · R 58.6% · Other 1.3%
- 2008→2024 swing
- -29.6pp toward R · 2008: 11.1pp · 2024: -18.5pp
- All cycles
- 2024: R+18.5 2020: R+14.3 2016: R+14.4 2012: R+0.4 2008: D+11.1
Not yet ingested
- Civics
- —
Market trends
- HPI YoY
- ▼ -84.46%
- Current HPI
- 183.6833
- Rent YoY
- —
- Metro
- Ottawa, IL
- State GDP YoY
- ▲ 1.59%
- F500 in state
- 60
Industry mix (Fortune 500 HQ in IL)
| Industry | F500 HQs | Revenue |
|---|---|---|
| Insurance | 4 | $201B |
|
||
| Consumer Goods | 4 | $87B |
|
||
| Industrial Machinery | 3 | $64B |
|
||
| Healthcare | 2 | $55B |
|
||
| Retail / Pharmacy | 1 | $148B |
|
||
| Agriculture / Food | 1 | $86B |
|
||
Price history
-55.7% since first listed17 events — show timeline
- 2026-06-13 Price Changed $49,000 MRED as Distributed by MLS Grid
- 2026-06-13 Listed $49,000 NWIAR
- 2026-06-13 Listed $1 MRED as Distributed by MLS Grid
- 2010-05-21 Pending — MRED as Distributed by MLS Grid
- 2010-05-21 Sold (MLS) $26,700 MRED as Distributed by MLS Grid
- 2010-05-13 Contingent — MRED as Distributed by MLS Grid
- 2010-03-19 Price Changed $37,900 MRED as Distributed by MLS Grid
- 2010-01-04 Relisted — MRED as Distributed by MLS Grid
- 2010-01-01 Listing Removed — MRED as Distributed by MLS Grid
- 2009-12-28 Relisted — MRED as Distributed by MLS Grid
- 2009-11-24 Pending — MRED as Distributed by MLS Grid
- 2009-11-20 Contingent — MRED as Distributed by MLS Grid
- 2009-07-30 Price Changed $49,900 MRED as Distributed by MLS Grid
- 2009-05-12 Price Changed $59,900 MRED as Distributed by MLS Grid
- 2008-11-25 Price Changed $69,900 MRED as Distributed by MLS Grid
- 2008-11-03 Listed $74,900 MRED as Distributed by MLS Grid
- 2006-06-27 Sold (Public Records) $110,500 Public Records
Property tax history
+4.3%/yrLatest (2024): $2,993 · +9.3% YoY. Source: county tax records.
Cash-flow waterfall
monthlySold comps — $/sqft
last 12 mo · ≤1 miLoading sold comps…