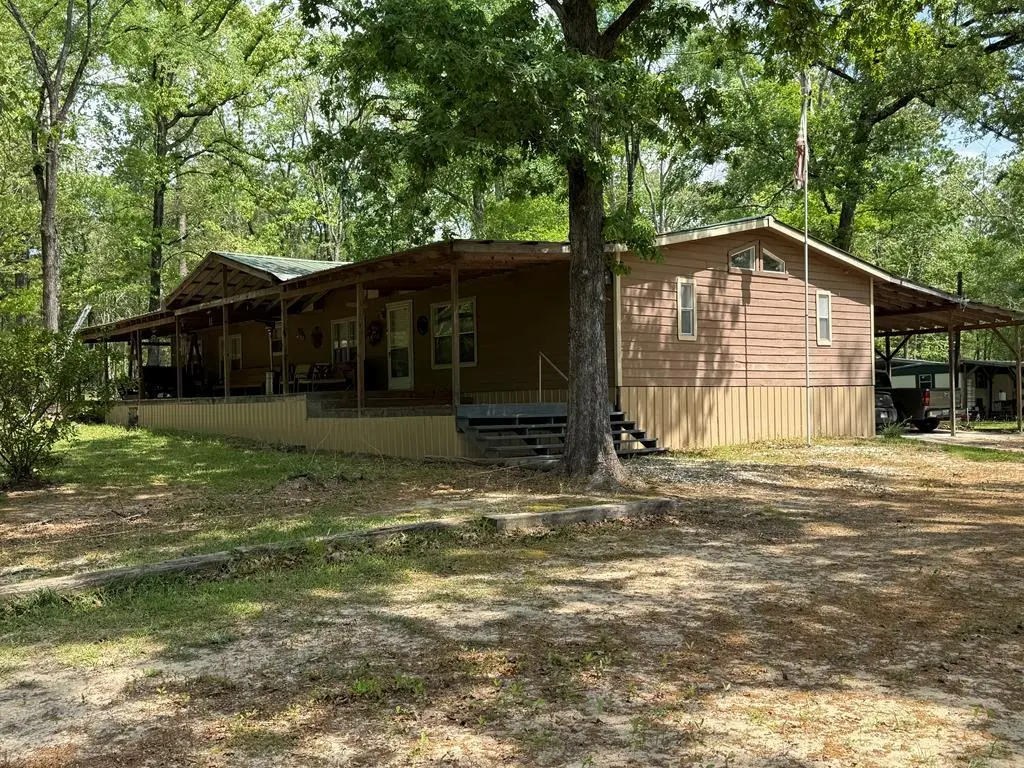
9013 Highway 63 E · South Toledo Bend, TX
Flood risk No data
- FEMA flood zone
- —
- Chance of flooding over 30 yrs
- —
- Est. flood insurance / yr
- —
Fire risk No data
- Est. fire insurance / yr
- —
Heat risk No data
- Hot days now (above threshold)
- —
- Hot days in 30 yrs
- —
Wind risk No data
- Chance of severe wind over 30 yrs
- —
Air-quality risk No data
- Unhealthy air days now
- —
- Unhealthy air days in 30 yrs
- —
Risk factors via First Street. Map © Google.
Why this score? — see what drove the C- grade
The composite is a weighted blend of 9 inputs, each scored 0–100. Each bar is that input's sub-score; the figure is the points it added to the 100-point composite (weight × sub-score).
- Cash flow +16.2/30.0
- Appreciation +9.2/10.0
- ARV discount +7.5/15.0
- DSCR +5.0/10.0
- 1% rule +3.4/10.0
- Schools +3.0/10.0
- Livability +2.7/5.0
- Rent growth +2.5/5.0
- Condition / age +2.5/5.0
$169,400
🖨 Deal sheet (PDF) 📄 Offer letter ✓ Due diligence
Listing remarks
Escape to the peace and privacy of country living with this spacious 3-bedroom, 3-bath double wide mobile home situated on 5 beautiful acres just a short drive to Toledo Bend Lake! This property offers the perfect blend of comfort and outdoor lifestyle, making it ideal as a full-time residence, weekend getaway, or investment opportunity. Inside, you'll find a functional layout with generous living spaces, a well-appointed kitchen, and three full bathrooms—perfect for accommodating family and guests. Step outside to relax on the beautiful wrap around porch, garden, or simple take in the natural surroundings. For those looking to expand, an additional adjoining 19 acres is available for
Key facts
- Wrap around porch
- Adjoining 19 acres
- 5 beautiful acres
Tags
Property features AI
Exterior
- Utilities: Private well water
- Home design: Manufactured home; Residential property
- Construction: Wood siding
- Exterior features: Metal roof; Shed(s); 5-acre parcel
Interior
- Flooring: Carpet; Vinyl
- Bathrooms: 3 full bathrooms
- Heating & cooling: Central heating; Electric heating; Central air conditioning; Window unit(s)
- Interior features: Walk-in closets; Skylights; Wood-burning fireplace
Neighborhood map
What this means for you Summary
Snapshot
- This is a 4-bed/3.0-bath manufactured listed at $169k.
Deal economics
- At list price, monthly cash flow is $90 ($1k/yr) — positive.
- The deal already cash-flows at list — no discount required.
- To meet the 1% rule (rent ≥ 1% of price), the offer needs to be $142k (16.2% below list).
- Recommended offer: $142k (16.2% below list) — sets the bar for 1% rule.
- Cap rate 6.9% vs local median 2.4% in South Toledo Bend — top-decile yield for the area; either an underpriced asset or a hidden risk that comps aren't pricing in. Stress-test before assuming the spread holds.
Location & tenants
- Location reads 53/100 on livability (#1,431 in TX) — a working-class tenant base; expect higher turnover. Strengths: cost of living A+, crime A; Watch: health & safety C-, housing D, amenities F.
- Burkeville ISD (rural): math 30% / reading 35% proficiency, ranked #966 of 1,141 in TX (top 85%) — families likely to look elsewhere, expect single-tenant / working-renter base with shorter leases; 65% free/reduced lunch — lower-income household profile, screen leases tightly.
- Zoned schools: Burkeville School (math 27% / reading 27%, 229 students, 86% FRL) — zoned schools average 86% FRL vs 65% district-wide (21 pts higher); higher-poverty schools than district average — tighter screening recommended.
- Market conditions: 62 active listings in the ZIP.
Forward outlook
- In year one you build about $16k of equity ($1k loan paydown + $14k appreciation (8.5% local appreciation)).
- Newton County population projected at -21% by 2050 — secular population decline; favor cash flow + early exit over multi-decade hold.
- At projected returns (8.5% appreciation + 3.0% rent growth), your $47k cash investment doubles in ~3 years — after that, you're playing with house money.
- By year 3, paydown + projected appreciation supports a ~$39k cash-out refi (75% LTV) — recoverable capital for the next deal without selling this one.
Negotiation context
- It's been on market 45 days — a 3% lower offer ($164k) is reasonable based on typical stale-listing flexibility.
Questions for the listing agent
- It's been on market 45 days. Have you received any prior offers? Is the seller open to a 16% concession, seller financing, or rate buy-down credit?
- Is there a deadline driving the sale (1031 exchange, divorce, estate, relocation)? That informs how much negotiation room exists.
- Schools are F-rated, which usually means shorter tenancies and higher turnover. Who's the typical renter profile here, and what's been the actual vacancy rate?
- What's the average days-on-market for RENTAL listings here right now (not sales)? A rising rental-DOM trend means longer vacancies and softer asking-rent achievability than the comps imply.
- What's the recent tenant-quality profile in this submarket — average credit score on applications, eviction rate, late-payment / NSF rate, and stable-employment percentage? A property-management company in the area should have these aggregated.
- How much new for-sale + rental construction is in the pipeline within 1–3 miles? Heavy new supply typically softens prices + rents 12–24 months out; constrained supply supports both.
Investment metrics
- 1% rule
- 0.84% ✗
- Cap rate
- 6.93%
- Cash-on-cash
- 2.27%
- DSCR
- 1.10
- GRM
- 9.9
CMA / ARV
No comps found within radius.
Projected returns pro-forma
8.49% appreciation · 3.0% rent growth · sell at horizon
- IRR
- 22.8%
- Equity multiple
- 2.70×
- Total profit
- $80,820
- Equity at exit
- $134,416
- IRR
- 20.6%
- Equity multiple
- 5.86×
- Total profit
- $230,484
- Equity at exit
- $272,462
Cash invested: $47,432 (down + closing). Projections, not guarantees.
Landlord ↔ Tenant lean methodology
- Overall (STATE)
- 87 Strongly Landlord-Friendly
- State Texas
- 87 Strongly Landlord-Friendly · R+5
- County
- — inherits STATE
- City
- — inherits STATE
ZIP-level market 75932
- Home prices YoY
- 4.1%
- Active inventory
- 62
- Price-to-rent
- 9.9×
Monthly cashflow live
- Estimated rent
- $1,419 medium interval (Pro) →
- Mortgage (P&I)
- −$888
- Tax from tax record
- −$72 /mo · $865/yr
- Insurance
- −$71
- HOA
- −$0
- Vacancy / Maint / Mgmt
- −$298
- Net cashflow
- $90
Break-even live
Sensitivity live
| Price | -10% $186 | -5% $138 | +0% $90 | +5% $42 | +10% $-6 |
|---|---|---|---|---|---|
| Rent | -10% $-22 | -5% $34 | +0% $90 | +5% $146 | +10% $202 |
| Rate | -1.0pp $175 | -0.5pp $133 | base $90 | +0.5pp $46 | +1.0pp $1 |
UW: 25.0% down · 7.5% · 30yr · 1.5% tax · 5.0% vac · 8.0% maint · 8.0% mgmt
Financing live
Cash to close
- Down payment
- $42,350
- Closing costs
- $5,082
- Reserves months
- —
- Total cash needed
- —
Loan-product check · same deal, 3 products live
Conventional
25% down · 7.5% · 30yr
- Down + closing
- —
- Monthly P&I
- —
- Monthly cashflow
- —
- DSCR
- —
- Eligible?
- —
Personal DTI + credit; lowest rate.
DSCR
20% down · 8.5% · 30yr
- Down + closing
- —
- Monthly P&I
- —
- Monthly cashflow
- —
- DSCR
- —
- Eligible?
- —
No personal income docs; deal must DSCR.
Hard money
10% down · 12.0% · 12mo
- Down + closing
- —
- Monthly P&I
- —
- Monthly cashflow
- —
- DSCR
- —
- Eligible?
- —
Short-term bridge; refi at stabilization.
Listing history 19 events
-
2026-06-21days on market $169,400 Active 45 DOM
-
2026-06-19days on market $169,400 Active 43 DOM
-
2026-06-18days on market $169,400 Active 42 DOM
-
2026-06-17days on market $169,400 Active 41 DOM
-
2026-06-16days on market $169,400 Active 40 DOM
-
2026-06-15days on market $169,400 Active 39 DOM
-
2026-06-14days on market $169,400 Active 37 DOM
-
2026-06-12days on market $169,400 Active 36 DOM
-
2026-06-09days on market $169,400 Active 33 DOM
-
2026-06-08days on market $169,400 Active 32 DOM
-
2026-06-07days on market $169,400 Active 31 DOM
-
2026-06-05days on market $169,400 Active 29 DOM
-
2026-06-04days on market $169,400 Active 27 DOM
-
2026-06-02days on market $169,400 Active 26 DOM
-
2026-06-01days on market $169,400 Active 25 DOM
-
2026-05-31days on market $169,400 Active 24 DOM
-
2026-05-31days on market $169,400 Active 23 DOM
-
2026-04-03$169,400 Active 975-char remark
-
2017-06-20soldstatus
ⓘ Source: listings_history table (triggers on properties + properties_extension) + one-shot
backfill from property_details.listing_events for pre-trigger history.
Tax reassessment forecast TX · Resets to sale price
- Current annual tax
- $865 · $72/mo
- Projected year-2 tax
- $3,100 · $258/mo
- Expected delta
- +$2,235/yr (+$186/mo · 258.3%)
ⓘ Screening estimate from a state-policy table — verify with the county assessor before closing.
Nearby sold comps map
Loading sold comps map…
Walkable amenities ~0.75 mi
Loading nearby amenities…
Taxation est. · year 1
- Rental income
- $17,027
- − Mortgage interest
- −$9,489
- − Property taxes
- −$865
- − Insurance
- −$847
- − Repairs & maintenance
- −$1,362
- − Management
- −$1,362
- − Depreciation
- −$4,928
- Taxable loss
- −$1,827
- Est. tax savings @ 24.0%
- +$438
- After-tax cash flow
- $1,517/yr
For passive investors: Depreciation is non-cash, so a rental often shows a tax loss while cash-flowing — sheltering income. Rental losses are passive: they offset passive income freely, and up to $25,000/yr can offset ordinary (W-2) income if you actively participate and your MAGI is under $100k (phasing out to $0 by $150k); unused losses carry forward. On sale, claimed depreciation is recaptured at up to 25%, and gains may owe capital-gains tax (a 1031 exchange can defer both). Figures are a year-1 estimate at your 24.0% rate — not tax advice; consult a CPA.
Schools (NCES district)
- District
- Burkeville ISD
- NCES district ID
- 4812150
- Math proficiency
- 30% ▲ 5.00%
- Reading proficiency
- 35% ▬ 0.00%
- Median HH income
- $38,753
- Composite
- 29.92/100
- National rank
- #11672
- State rank
- #966 of 1141 in TX
Livability — South Toledo Bend
- Score
- 53/100
- State rank
- #1431
- US rank
- #24460
Category grades
Schools grade is shown separately in the Schools card above.
Census & demographics
- Population (ZIP)
- 1,339
Population outlook (Newton County) Hauer SSP2
- Today (2025)
- 13,123 people
- By 2030
- 12,567 · -4.2%
- By 2040
- 11,431 · -12.9%
- By 2050
- 10,393 · -20.8%
- By 2075
- 8,230 · -37.3%
- By 2100
- 6,038 · -54.0%
Race, ethnicity, and origin ACS 2023
- Neighborhood character
- Predominantly White (82%)
- Race & ethnicity
- White 82% Black 10% Two or more races 4% Hispanic / Latino 2%
- Common ancestry
- Lithuanian 3% Slovak 2% Hungarian 1%
Political lean MEDSL · Newton
- 2024 margin
- Solid R (+66.6) · D 16.6% · R 83.2%
- 2008→2024 swing
- -34.4pp toward R · 2008: -32.2pp · 2024: -66.6pp
- All cycles
- 2024: R+66.6 2020: R+60.9 2016: R+49.5 2012: R+43.3 2008: R+32.2
Not yet ingested
- Civics
- —
Market trends
- HPI YoY
- ▲ 8.49%
- Current HPI
- 214.4428
- Rent YoY
- —
- Metro
- —
- State GDP YoY
- ▲ 3.95%
- F500 in state
- 110
Industry mix (Fortune 500 HQ in TX)
| Industry | F500 HQs | Revenue |
|---|---|---|
| Energy | 16 | $1,198B |
|
||
| Technology | 5 | $198B |
|
||
| Engineering / Construction | 4 | $72B |
|
||
| Energy Services | 3 | $60B |
|
||
| Utilities | 3 | $41B |
|
||
| Healthcare | 2 | $330B |
|
||
Price history
2 events — show timeline
- 2026-04-03 Listed $169,400 Deep East Texas MLS
- 2017-06-20 Sold (Public Records) — Public Records
Property tax history
+0.5%/yrLatest (2025): $865 · +4.7% YoY. Source: county tax records.
Cash-flow waterfall
monthlySold comps — $/sqft
last 12 mo · ≤1 miLoading sold comps…