 Duplex
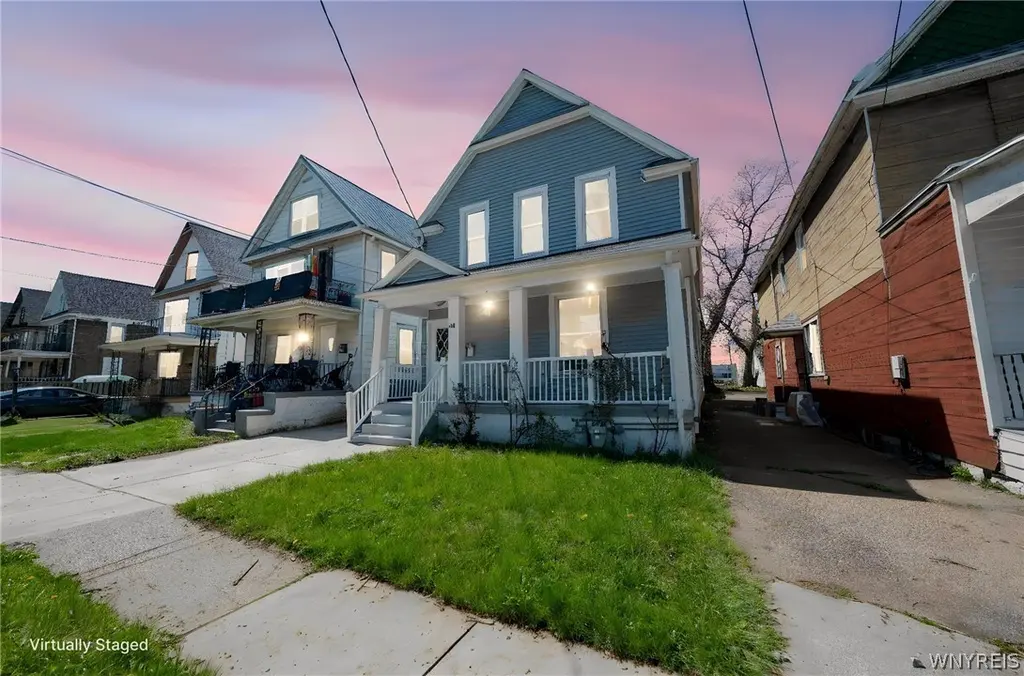
44 La Force Pl · Buffalo, NY
Flood risk 3/10 · Minor
- FEMA flood zone
- X (unshaded)
- Chance of flooding over 30 yrs
- 0.17%
- Est. flood insurance / yr
- $473 – $860
Fire risk 1/10 · Minimal
- Est. fire insurance / yr
- $691 – $1,283
Heat risk 3/10 · Minor
- Hot days now (above 92°F)
- 7 days/yr
- Hot days in 30 yrs
- 15 days/yr
Wind risk 1/10 · Minimal
- Chance of severe wind over 30 yrs
- —
Air-quality risk 4/10 · Minor
- Unhealthy air days now
- 4 days/yr
- Unhealthy air days in 30 yrs
- 9 days/yr
Risk factors via First Street. Map © Google.
Why this score? — see what drove the B+ grade
The composite is a weighted blend of 9 inputs, each scored 0–100. Each bar is that input's sub-score; the figure is the points it added to the 100-point composite (weight × sub-score).
- Cash flow +30.0/30.0
- ARV discount +15.0/15.0
- DSCR +10.0/10.0
- 1% rule +8.4/10.0
- Rent growth +4.5/5.0
- Livability +3.9/5.0
- Schools +3.3/10.0
- Condition / age +2.5/5.0
- Appreciation +0.0/10.0
$199,900
🖨 Deal sheet (PDF) 📄 Offer letter ✓ Due diligence
Multi-family units
County records classify this as Multi-Family (2-4 Unit). Listing-text estimate: 2 units. confirmed
Listing remarks
Welcome to 44 La Force Place, a beautifully updated 2-unit property with 3 bedrooms in each unit offering a perfect blend of modern upgrades and long-term value. Whether you're an investor or looking for an owner-occupied opportunity, this property is truly move-in ready. This home has been extensively renovated with major improvements already completed, including a brand new roof (2024) and new siding (2025), giving peace of mind for years to come. Inside, both units feature updated flooring; upper unit completed in 2025 and lower unit in 2023 along with fresh paint, new drywall, and a clean, modern feel throughout. The mechanical and infrastructure updates are just as impressive: new plu
Key facts
- New plumbing
- New siding
- Updated flooring
Tags
Property features AI
Finance
- Other: Two-unit property with separate gas and electric meters for each unit
- Financial info: Owner pays water and trash collection; Operating expenses include water/sewer
Exterior
- Parking: Concrete parking surface
- Utilities: Public water connected; Sewer connected
- Home design: 2-story building; Existing construction
- Construction: Vinyl siding; Asphalt roof; Block foundation
- Exterior features: Rectangular residential lot; City street frontage
Interior
- Flooring: Ceramic tile; Laminate; Vinyl
- Bathrooms: 2 full bathrooms
- Heating & cooling: Gas forced-air heat
- Interior features: Partial basement; Varied interior finishes
- Laundry & utility: Gas water heater
Neighborhood map
What this means for you Summary
Snapshot
- This is a 2 × 3-bed/1.0-bath units multifamily listed at $200k.
Deal economics
- At list price, monthly cash flow is $944 ($11k/yr) — positive. Per door: $472/mo.
- The deal already cash-flows at list — no discount required.
- Meets the 1% rule at list price ($3k rent vs $200k).
- Cap rate 12.0% vs local median 8.0% in Buffalo — top-decile yield for the area; either an underpriced asset or a hidden risk that comps aren't pricing in. Stress-test before assuming the spread holds.
Location & tenants
- Location reads 77/100 on livability (#195 in NY, #3,011 nationally) — a middle-class / working-renter tenant base. Strengths: commute A+, housing A+, health & safety A+; Watch: crime F, employment D-.
- Buffalo City School District (urban): math 41% / reading 40% proficiency, ranked #535 of 590 in NY (top 91%) — families likely to look elsewhere, expect single-tenant / working-renter base with shorter leases; 75% free/reduced lunch — lower-income household profile, screen leases tightly.
- Zoned schools: International School (math 8% / reading 17%, grade F, #2,048 of 2,108 statewide, top 97%, 981 students, 92% FRL); Hutchinson Central Technical High School (math 96% / reading 32%, grade B-, #807 of 1,100 statewide, top 73%, 1,175 students, 78% FRL).
- Market conditions: Rents rising fast (+8.2%/yr); 199 active listings in the ZIP; 9 comparable units currently listed for rent nearby; rentals leasing fast (median 13d on market — plan ~1-2 weeks tenant-placement turnaround); lower-income renter base — watch delinquency; 1,244 units permitted in Erie County in 2024 (563 in 5+ unit buildings).
- At $2,687/mo this rent would consume 81% of the median local household income ($40k/yr) (locally 2177% of renters already pay >50% of income on rent) — very limited rent-growth headroom before tenants either downsize or default.
Forward outlook
- Local home prices are declining (-3.0%/yr); year-one equity from $1k of loan paydown is wiped out by about $6k of value loss. Plan a longer hold.
- At projected returns (-3.0% appreciation + 8.0% rent growth), your $56k cash investment doubles in ~5 years — after that, you're playing with house money.
Negotiation context
- Only 13 days on market — expect competitive offers; lowballing is unlikely to land.
- 2 sale attempts with the ask held roughly flat each time — persistent listings suggest the price (not the market) is what's stuck; bring a comps-based counter.
- Current owner paid $35k; list at $200k implies a 471% gain — meaningful room to come down on a strong offer.
Risks & watch-outs
- Watch-outs: built in 1900 — expect roof / HVAC / electrical / plumbing capex.
Questions for the listing agent
- Can we see the unit-by-unit rent roll, current vacancy, and any below-market leases? What's the average tenancy length?
- What capital expenditures (roof, boiler, parking lot, exteriors) have been made in the last 5 years, and what's planned in the next 2?
- Built in 1900 — when were the roof, HVAC, electrical panel, plumbing, and water heater last replaced?
- Is there a deadline driving the sale (1031 exchange, divorce, estate, relocation)? That informs how much negotiation room exists.
- Crime grade is F in this area — have there been break-ins, vandalism, or insurance claims at this property in the last 3 years? What carrier currently insures it and at what premium?
- What's the average days-on-market for RENTAL listings here right now (not sales)? A rising rental-DOM trend means longer vacancies and softer asking-rent achievability than the comps imply.
- What's the recent tenant-quality profile in this submarket — average credit score on applications, eviction rate, late-payment / NSF rate, and stable-employment percentage? A property-management company in the area should have these aggregated.
- How much new apartment / multifamily construction is in the pipeline within 1–3 miles? Heavy new supply (>2% of stock underway) typically softens rents 12–24 months out; light construction supports rent growth.
Investment metrics
- 1% rule
- 1.34% ✓
- Cap rate
- 11.96%
- Cash-on-cash
- 20.24%
- DSCR
- 1.90
- GRM
- 6.2
CMA / ARV
- ARV (median comp)
- $289,472
- List price
- $199,900
- Delta
- -30.94%
- Verdict
- UNDERPRICED
- Comps
- 20 within 1.0 mi
Show comp detail 12 sales within ~0.75 mi
| Address | Dist | Beds/Ba | Sqft | Sold | Price | $/sf | Match |
|---|---|---|---|---|---|---|---|
| 23 Sunnyside Pl | 0.14mi | 4/2.0 | 2,160 (-1%) | 13mo | $175,000 | $81 | 81 |
| 41 Page St | 0.26mi | 5/2.0 (+1) | 2,274 (+4%) | 4mo | $230,000 | $101 | 73 |
| 263 Chandler St | 0.52mi | 5/2.0 (+1) | 2,254 (+4%) | 2mo | $195,000 | $87 | 63 |
| 37 Peoria St | 0.69mi | 4/2.0 | 2,148 (-1%) | 6mo | $138,000 | $64 | 60 |
| 198 Grote St | 0.46mi | 4/2.0 | 2,024 (-7%) | 12mo | $234,500 | $116 | 57 |
| 145 Peter St | 0.44mi | 4/2.0 | 1,892 (-13%) | 5mo | $238,696 | $126 | 54 |
| 407 Hinman Ave | 0.68mi | 4/2.0 | 2,112 (-3%) | 13mo | $200,000 | $95 | 52 |
| 151 Howell St | 0.43mi | 5/3.0 (+1) | 2,048 (-6%) | 13mo | $120,000 | $59 | 50 |
| 38 Reservation St | 0.53mi | 5/2.0 (+1) | 1,955 (-10%) | 12mo | $330,000 | $169 | 43 |
| 395 Ontario St | 0.65mi | 5/2.0 (+1) | 1,908 (-12%) | 8mo | $270,000 | $142 | 38 |
| 227 Crowley Ave | 0.71mi | 3/2.0 (-1) | 1,909 (-12%) | 6mo | $155,000 | $81 | 36 |
| 181 Gorton St | 0.71mi | 4/2.0 | 1,864 (-14%) | 11mo | $109,000 | $58 | 34 |
Match score weights: distance 35% · size 25% · config 20% · recency 20%. Top-matched comps best support the ARV.
Projected returns pro-forma
-3.0% appreciation · 8.0% rent growth · sell at horizon
- IRR
- 17.5%
- Equity multiple
- 1.75×
- Total profit
- $41,853
- Equity at exit
- $29,806
- IRR
- 29.1%
- Equity multiple
- 4.18×
- Total profit
- $178,160
- Equity at exit
- $17,284
Cash invested: $55,972 (down + closing). Projections, not guarantees.
Landlord ↔ Tenant lean methodology
- Overall (STATE)
- 15 Strongly Tenant-Friendly
- State New York
- 15 Strongly Tenant-Friendly · D+10
- County
- — inherits STATE
- City
- — inherits STATE
ZIP-level market 14207
- Home prices YoY
- -18.9%
- Rents YoY
- 8.2%
- Active inventory
- 199
- Price-to-rent
- 12.4×
Monthly cashflow live
- Estimated rent
- $2,687 high interval (Pro) →
- Mortgage (P&I)
- −$1,048
- Tax from tax record
- −$47 /mo · $565/yr
- Insurance
- −$83
- HOA
- −$0
- Vacancy / Maint / Mgmt
- −$564
- Net cashflow
- $944
Break-even live
Sensitivity live
| Price | -10% $1,057 | -5% $1,001 | +0% $944 | +5% $888 | +10% $831 |
|---|---|---|---|---|---|
| Rent | -10% $732 | -5% $838 | +0% $944 | +5% $1,050 | +10% $1,156 |
| Rate | -1.0pp $1,045 | -0.5pp $995 | base $944 | +0.5pp $892 | +1.0pp $840 |
2-unit breakdown (identical units grouped — click to expand)
| Units | Beds | Baths | Est. rent |
|---|---|---|---|
| 2× units | 3 | 1 | $2,688 |
| #1 | 3 | 1 | $1,344 |
| #2 | 3 | 1 | $1,344 |
| Total (2 units) | $2,687 | ||
UW: 25.0% down · 7.5% · 30yr · 1.5% tax · 5.0% vac · 8.0% maint · 8.0% mgmt
Financing live
Cash to close
- Down payment
- $49,975
- Closing costs
- $5,997
- Reserves months
- —
- Total cash needed
- —
Loan-product check · same deal, 3 products live
Conventional
25% down · 7.5% · 30yr
- Down + closing
- —
- Monthly P&I
- —
- Monthly cashflow
- —
- DSCR
- —
- Eligible?
- —
Personal DTI + credit; lowest rate.
DSCR
20% down · 8.5% · 30yr
- Down + closing
- —
- Monthly P&I
- —
- Monthly cashflow
- —
- DSCR
- —
- Eligible?
- —
No personal income docs; deal must DSCR.
Hard money
10% down · 12.0% · 12mo
- Down + closing
- —
- Monthly P&I
- —
- Monthly cashflow
- —
- DSCR
- —
- Eligible?
- —
Short-term bridge; refi at stabilization.
Rent comps 9 comps
| Address | Beds | Baths | Sqft | Rent | $/sqft | DOM | Units | Dist |
|---|---|---|---|---|---|---|---|---|
| 78 Germain St Buffalo, NY | 3.0 | 1.0 | 2030 | $1,300 | $0.64 | 16d | 1 | 0.59mi |
| 139 Fordham Dr Buffalo, NY | 3.0 | 1.0 | 1453 | $1,700 | $1.17 | 25d | 1 | 0.88mi |
| 2514 Delaware Ave Unit 1 Buffalo, NY | 3.0 | 1.0 | 1620 | $1,650 | $1.02 | 3d | 1 | 1.10mi |
| 61 Baxter St Buffalo, NY | 3.0 | 1.0 | 2014 | $1,400 | $0.70 | 3d | 1 | 1.11mi |
| 100 Forest Ave Buffalo, NY | 2.0–4.0 | 2.0–4.0 | 1304 | $2,560 | $1.96 | 3d | 14 | 1.35mi |
| 77 Lovering Ave #2 Buffalo, NY | 3.0 | 1.0 | 1450 | $1,895 | $1.31 | 45d | 1 | 1.38mi |
| 172 Tremont Ave Kenmore, NY | 3.0 | 1.5 | 1569 | $2,500 | $1.59 | 12d | 1 | 1.39mi |
| 88 Commonwealth Ave Buffalo, NY | 3.0 | 1.0 | 2710 | $1,695 | $0.63 | 13d | 1 | 1.41mi |
| 79 Commonwealth Ave Buffalo, NY | 3.0 | 1.0 | 1450 | $1,600 | $1.10 | 25d | 1 | 1.45mi |
Listing history 6 events
-
2026-05-13status Pending 1499-char remark
-
2026-04-29$199,900 Active 1499-char remark
-
2025-10-27status Pending
-
2025-10-19historical
-
2025-10-04$197,900 Active
-
2017-03-27soldstatus $35,000
ⓘ Source: listings_history table (triggers on properties + properties_extension) + one-shot
backfill from property_details.listing_events for pre-trigger history.
Tax reassessment forecast NY · Partial reset (capped growth)
- Current annual tax
- $565 · $47/mo
- Projected year-2 tax
- $1,971 · $164/mo
- Expected delta
- +$1,407/yr (+$117/mo · 249.1%)
ⓘ Screening estimate from a state-policy table — verify with the county assessor before closing.
Climate risk First Street
- Flood 3/10 Moderate FEMA zone X (unshaded) · 17% chance over 30 yrs
- Wildfire 1/10 Low
- Heat 3/10 Moderate 7 d/yr ≥92°F today · 15 d/yr by 30 yrs out
- Wind 1/10 Low
- Air quality 4/10 Moderate 4 unhealthy d/yr today · 9 by 30 yrs out
Nearby sold comps map
Loading sold comps map…
Walkable amenities ~0.75 mi
Loading nearby amenities…
Taxation est. · year 1
- Rental income
- $32,244
- − Mortgage interest
- −$11,198
- − Property taxes
- −$565
- − Insurance
- −$1,000
- − Repairs & maintenance
- −$2,580
- − Management
- −$2,580
- − Depreciation
- −$5,815
- Taxable income
- $8,508
- Est. tax owed @ 24.0%
- −$2,042
- After-tax cash flow
- $9,287/yr
For passive investors: Depreciation is non-cash, so a rental often shows a tax loss while cash-flowing — sheltering income. Rental losses are passive: they offset passive income freely, and up to $25,000/yr can offset ordinary (W-2) income if you actively participate and your MAGI is under $100k (phasing out to $0 by $150k); unused losses carry forward. On sale, claimed depreciation is recaptured at up to 25%, and gains may owe capital-gains tax (a 1031 exchange can defer both). Figures are a year-1 estimate at your 24.0% rate — not tax advice; consult a CPA.
Schools (NCES district)
- District
- Buffalo City School District
- NCES district ID
- 3605850
- Math proficiency
- 41% ▲ 11.00%
- Reading proficiency
- 40% ▲ 7.00%
- Median HH income
- $31,665
- Composite
- 33.17/100
- National rank
- #5544
- State rank
- #535 of 590 in NY
Livability — Buffalo
- Score
- 77/100
- State rank
- #195
- US rank
- #3011
Category grades
Schools grade is shown separately in the Schools card above.
Census & demographics
- Census place
- Buffalo, NY
- County
- Erie County · 714,559 people
- City population
- 440,021
- Metro
- Buffalo-Cheektowaga, NY
- Population (ZIP)
- 26,327
- Household income
- $39,753
- Rent vs Own
- Severe rent burden
- 2177.0
Population outlook (Erie County) Hauer SSP2
- Today (2025)
- 933,037 people
- By 2030
- 935,181 · +0.2%
- By 2040
- 928,531 · -0.5%
- By 2050
- 905,725 · -2.9%
- By 2075
- 834,037 · -10.6%
- By 2100
- 708,033 · -24.1%
Race, ethnicity, and origin ACS 2023
- Neighborhood character
- Highly diverse neighborhood (Simpson 0.74)
- Race & ethnicity
- White 40% Hispanic / Latino 23% Black 16% Asian 15% Two or more races 14%
- Hispanic origin (detail)
- Puerto Rican 18% Dominican 2%
- Common ancestry
- Romanian 8% Portuguese 1% Arab 1%
- Foreign-born
- 19% · Philippines, Canada, India
- Languages at home
- 65% English-only · Spanish 14% Other Asian/Pacific 10% Other Indo-European 5%
Political lean MEDSL · Erie
- 2024 margin
- Lean D (+9.7) · D 54.8% · R 45.2%
- 2008→2024 swing
- -7.9pp toward R · 2008: 17.5pp · 2024: 9.7pp
- All cycles
- 2024: D+9.7 2020: D+14.7 2016: D+4.8 2012: D+15.6 2008: D+17.5
Not yet ingested
- Civics
- —
Market trends
- HPI YoY
- ▼ -54.42%
- Current HPI
- 233.0902
- Rent YoY
- ▲ 8.19%
- Metro
- Buffalo-Cheektowaga, NY
- State GDP YoY
- ▲ 2.60%
- F500 in state
- 92
Industry mix (Fortune 500 HQ in NY)
| Industry | F500 HQs | Revenue |
|---|---|---|
| Financial Services | 10 | $950B |
|
||
| Consumer Goods | 9 | $162B |
|
||
| Insurance | 4 | $225B |
|
||
| Telecommunications | 2 | $144B |
|
||
| Pharmaceuticals | 2 | $112B |
|
||
| Media / Entertainment | 2 | $69B |
|
||
Price history
+471.1% since first listed6 events — show timeline
- 2026-05-13 Pending — WNYREIS
- 2026-04-29 Listed $199,900 WNYREIS
- 2025-10-27 Pending — WNYREIS
- 2025-10-19 Listing Removed — WNYREIS
- 2025-10-04 Listed $197,900 WNYREIS
- 2017-03-27 Sold (Public Records) $35,000 Public Records
Property tax history
+13.8%/yrLatest (2025): $565 · +59.9% YoY. Source: county tax records.
Cash-flow waterfall
monthlySold comps — $/sqft
last 12 mo · ≤1 miLoading sold comps…