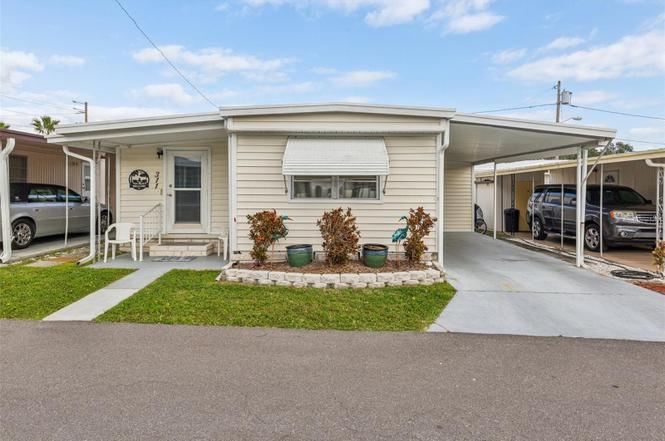
1600 N Old Coachman Rd #311 · Clearwater, FL
Flood risk 3/10 · Minor
- FEMA flood zone
- X (unshaded)
- Chance of flooding over 30 yrs
- 0.2%
- Est. flood insurance / yr
- $507 – $1,088
Fire risk 1/10 · Minimal
- Est. fire insurance / yr
- $947 – $1,759
Heat risk 10/10 · Severe
- Hot days now (above 107°F)
- 6 days/yr
- Hot days in 30 yrs
- 22 days/yr
Wind risk 10/10 · Severe
- Chance of severe wind over 30 yrs
- 99.0%
Air-quality risk 3/10 · Minor
- Unhealthy air days now
- 3 days/yr
- Unhealthy air days in 30 yrs
- 3 days/yr
Risk factors via First Street. Map © Google.
Why this score? — see what drove the B- grade
The composite is a weighted blend of 9 inputs, each scored 0–100. Each bar is that input's sub-score; the figure is the points it added to the 100-point composite (weight × sub-score).
- Cash flow +30.0/30.0
- 1% rule +10.0/10.0
- DSCR +10.0/10.0
- ARV discount +7.5/15.0
- Schools +4.3/10.0
- Livability +4.1/5.0
- Condition / age +2.5/5.0
- Rent growth +1.3/5.0
- Appreciation +0.0/10.0
$82,500
🖨 Deal sheet 📄 Offer letter ✓ Due diligence
Listing remarks
Welcome to this 2 bedroom / 1.5 bathroom home in Clearwater! Located right next to Coachman Ridge Park, with walking trails leading to it, Alcove Mobile Home Park is a great community to call home! The park is full of walking paths, a swing set, tennis courts, and racquet ball courts! Great location for someone who is active, with access to the Dick Meisner trail, leading you to Safety Harbor! Oh, and even though the community doesn’t have a pool, you’re only ¼ of a mile from The Long Center, with a swimming pool and plenty of fitness classes, available at a discounted price with a Silver Sneakers Membership! The community is close to plenty of shopping, restaurants, and
Key facts
- Racquet ball courts
- Tennis courts
- Swing set
Tags
Property features AI
Finance
- Other: Third party listing; Directions: Enter the community off N Old Coachman Road; continue west until 3rd Street — Unit 311 on 3rd Street
- Financial info: Total monthly fees (including HOA) $190; Total annual fees $2,280
- HOA & community: Alcove Mobile Home Park association; Monthly HOA fee $190 (required); Senior community; Pets not allowed
Exterior
- Parking: Driveway; Carport with 2 spaces
- Utilities: Public water; Public sewer; Electricity connected; Water connected; Sewer connected
- Home design: Residential mobile home (single wide); One story; Faces west; Entry level: One
- Construction: Vinyl siding; Metal roof; Crawlspace foundation; Built area ~1240 total
- Exterior features: Other exterior features; Asphalt/paved road access; Planned unit development
Interior
- Kitchen: Range; Refrigerator; Electric water heater
- Bedrooms: 2 bedrooms
- Flooring: Laminate
- Bathrooms: 1 full bath; 1 half bath
- Heating & cooling: Ductless heating; Mini-split cooling; Wall/window unit cooling; Other heating
- Interior features: Stone counters; Window treatments; Tinted windows
- Laundry & utility: Washer; Dryer; Laundry inside
Neighborhood map
What this means for you Summary
Snapshot
- This is a 2-bed/1.5-bath single-family listed at $82k.
Deal economics
- At list price, monthly cash flow is $603 ($7k/yr) — positive.
- The deal already cash-flows at list — no discount required.
- Meets the 1% rule at list price ($2k rent vs $82k).
- Recommended offer: $73k (12.0% below list) — sets the bar for market timing.
- Cap rate 15.1% vs local median 2.9% in Clearwater — top-decile yield for the area; either an underpriced asset or a hidden risk that comps aren't pricing in. Stress-test before assuming the spread holds.
Location & tenants
- Location reads 82/100 on livability (#60 in FL, #988 nationally) — a professional / high-income tenant draw. Strengths: commute A+, housing A+, health & safety A+; Watch: schools C-, employment C-.
- Pinellas (suburban): math 51% / reading 51% proficiency, ranked #31 of 73 in FL (top 42%) — acceptable for families but not a draw, mixed tenant base, ~2y average lease.
- Market conditions: Rents falling (-4.6%/yr); 83 active listings in the ZIP; 40 comparable units currently listed for rent nearby; rentals leasing fast (median 11d on market — plan ~1-2 weeks tenant-placement turnaround); 2,676 units permitted in Pinellas County in 2024 (1,422 in 5+ unit buildings).
Forward outlook
- Local home prices are declining (-3.0%/yr); year-one equity from $570 of loan paydown is wiped out by about $2k of value loss. Plan a longer hold.
- Pinellas County population projected at +14% by 2050 — modest demand growth; plan on rents tracking national, not racing it.
- At projected returns (-3.0% appreciation + 0.0% rent growth), your $23k cash investment doubles in ~5 years — after that, you're playing with house money.
Negotiation context
- It's been on market 262 days — a 12% lower offer ($73k) is reasonable based on typical stale-listing flexibility.
- 2 sale attempts; this cycle's ask has dropped $8k (9%) from the opening price — seller is motivated, your offer sets the floor, not the list.
Risks & watch-outs
- Climate carrying-cost: severe wind risk, 99% chance of damaging wind over 30y; extreme-heat days projected 6→22/yr by 2055 (HVAC capex compounding) — expect insurance premiums to compound above CPI over the hold.
Questions for the listing agent
- It's been on market 262 days. Have you received any prior offers? Is the seller open to a 12% concession, seller financing, or rate buy-down credit?
- Built in 1968 — when were the roof, HVAC, electrical panel, plumbing, and water heater last replaced?
- What does the HOA fee cover, when was the last increase, and are there any pending special assessments or reserve-fund shortfalls?
- Why hasn't it sold? Are there any deal-killer items the seller is aware of (foundation, flood, title, zoning, code violations)?
- Is there a deadline driving the sale (1031 exchange, divorce, estate, relocation)? That informs how much negotiation room exists.
- What's the average days-on-market for RENTAL listings here right now (not sales)? A rising rental-DOM trend means longer vacancies and softer asking-rent achievability than the comps imply.
- What's the recent tenant-quality profile in this submarket — average credit score on applications, eviction rate, late-payment / NSF rate, and stable-employment percentage? A property-management company in the area should have these aggregated.
- How much new for-sale + rental construction is in the pipeline within 1–3 miles? Heavy new supply typically softens prices + rents 12–24 months out; constrained supply supports both.
Investment metrics
- 1% rule
- 2.09% ✓
- Cap rate
- 15.06%
- Cash-on-cash
- 31.31%
- DSCR
- 2.39
- GRM
- 4.0
CMA / ARV
- ARV (on-the-fly)
- $298,928
- Comps found
- 1
Show comp detail 1 sale within ~0.75 mi
| Address | Dist | Beds/Ba | Sqft | Sold | Price | $/sf | Match |
|---|---|---|---|---|---|---|---|
| 2271 Terrace Dr N | 0.73mi | 3/2.0 (+1) | 940 (-1%) | 12mo | $295,000 | $314 | 47 |
Match score weights: distance 35% · size 25% · config 20% · recency 20%. Top-matched comps best support the ARV.
Projected returns pro-forma
-3.0% appreciation · 0.0% rent growth · sell at horizon
- IRR
- 22.2%
- Equity multiple
- 1.87×
- Total profit
- $20,110
- Equity at exit
- $12,301
- IRR
- 27.9%
- Equity multiple
- 3.08×
- Total profit
- $47,987
- Equity at exit
- $7,133
Cash invested: $23,100 (down + closing). Projections, not guarantees.
Landlord ↔ Tenant lean methodology
- Overall (STATE)
- 87 Strongly Landlord-Friendly
- State Florida
- 87 Strongly Landlord-Friendly · R+3
- County
- — inherits STATE
- City
- — inherits STATE
ZIP-level market 33765
- Home prices YoY
- -31.8%
- Rents YoY
- -4.6%
- Active inventory
- 83
- Price-to-rent
- 4.0×
Monthly cashflow live
- Estimated rent
- $1,725 high interval (Pro) →
- Mortgage (P&I)
- −$433
- Tax est. 1.5%
- −$103 /mo · $1,238/yr
- Insurance
- −$34
- HOA
- −$190
- Vacancy / Maint / Mgmt
- −$362
- Net cashflow
- $603
Break-even live
UW: 25.0% down · 7.5% · 30yr · 1.5% tax · 5.0% vac · 8.0% maint · 8.0% mgmt
Financing live
Cash to close
- Down payment
- $20,625
- Closing costs
- $2,475
- Reserves months
- —
- Total cash needed
- —
Loan-product check · same deal, 3 products live
Conventional
25% down · 7.5% · 30yr
- Down + closing
- —
- Monthly P&I
- —
- Monthly cashflow
- —
- DSCR
- —
- Eligible?
- —
Personal DTI + credit; lowest rate.
DSCR
20% down · 8.5% · 30yr
- Down + closing
- —
- Monthly P&I
- —
- Monthly cashflow
- —
- DSCR
- —
- Eligible?
- —
No personal income docs; deal must DSCR.
Hard money
10% down · 12.0% · 12mo
- Down + closing
- —
- Monthly P&I
- —
- Monthly cashflow
- —
- DSCR
- —
- Eligible?
- —
Short-term bridge; refi at stabilization.
Rent comps 40 comps
| Address | Beds | Baths | Sqft | Rent | $/sqft | DOM | Units | Dist |
|---|---|---|---|---|---|---|---|---|
| 1733 Ragland Ave Clearwater, FL | 3.0 | 2.0 | 1092 | $2,431 | $2.23 | 4d | 1 | 0.23mi |
| 2481 NE Coachman Rd Clearwater, FL | 1.0–2.0 | 1.0–2.0 | 762 | $2,023 | $2.65 | 1d | 14 | 0.51mi |
| 730 N Old Coachman Rd Clearwater, FL | 2.0 | 2.0 | 950 | $1,705 | $1.79 | 2d | 3 | 0.73mi |
| 2550 Stag Run Blvd Clearwater, FL | 1.0–3.0 | 1.0–2.0 | 1189 | $1,870 | $1.57 | 1d | 19 | 0.74mi |
| 2060 Marilyn St #207 Clearwater, FL | 1.0 | 1.0 | 750 | $1,350 | $1.80 | 17d | 1 | 0.79mi |
| 2060 Marilyn St #127 Clearwater, FL | 1.0 | 1.0 | 750 | $1,350 | $1.80 | 24d | 1 | 0.81mi |
| 2037 Sunset Grove Ln Clearwater, FL | 2.0 | 2.0 | 935 | $1,750 | $1.87 | 24d | 1 | 0.82mi |
| 2625 Florida 590 Unit 1414 Clearwater, FL | 1.0 | 1.0 | 600 | $1,300 | $2.17 | 24d | 1 | 0.89mi |
| 601 N Hercules Ave #508 Clearwater, FL | 2.0 | 2.0 | 945 | $1,650 | $1.75 | 24d | 1 | 0.92mi |
| 1730 Audrey Dr Unit 2 Clearwater, FL | 1.0 | 1.0 | 700 | $2,100 | $3.00 | 24d | 1 | 1.00mi |
| 2433 Brazilia Dr #49 Clearwater, FL | 2.0 | 2.0 | 1100 | $1,750 | $1.59 | 24d | 1 | 1.01mi |
| 2042 Australia Way W Clearwater, FL | 1.0 | 1.0 | 825 | $1,350 | $1.64 | 10d | 1 | 1.02mi |
| 2464 Australia Way E #24 Clearwater, FL | 2.0 | 2.0 | 1100 | $1,600 | $1.45 | 24d | 1 | 1.05mi |
| 2310 Denmark St Clearwater, FL | 2.0 | 2.0 | 1100 | $1,600 | $1.45 | 14d | 1 | 1.06mi |
| 2463 Brazilia Dr #61 Clearwater, FL | 2.0 | 1.0 | 1100 | $1,450 | $1.32 | 24d | 1 | 1.06mi |
| 2311 Brisbane St #65 Clearwater, FL | 2.0 | 2.0 | 1100 | $1,700 | $1.55 | 12d | 1 | 1.06mi |
| 2071 Australia Way W #29 Clearwater, FL | 2.0 | 2.0 | 1100 | $1,525 | $1.39 | 24d | 1 | 1.08mi |
| 2451 Canadian Way Clearwater, FL | 2.0 | 1.0–2.0 | 1250 | $1,598 | $1.28 | 7d | 2 | 1.11mi |
| 2 N Fernwood Ave Clearwater, FL | 2.0 | 1.0 | 800 | $1,650 | $2.06 | 24d | 1 | 1.11mi |
| 2 N Fernwood Ave #14 Clearwater, FL | 2.0 | 1.0 | 800 | $1,550 | $1.94 | 12d | 1 | 1.11mi |
| 25 N Belcher Rd Clearwater, FL | 1.0–2.0 | 1.0–2.0 | 780 | $2,026 | $2.60 | 2d | 12 | 1.12mi |
| 2287 Philippine Dr #29 Clearwater, FL | 2.0 | 2.0 | 1070 | $1,550 | $1.45 | 2d | 1 | 1.19mi |
| 2287 Philippine Dr #29 Clearwater, FL | 2.0 | 2.0 | 1070 | $1,550 | $1.45 | 7d | 1 | 1.19mi |
| 2428 Columbia Dr #68 Clearwater, FL | 2.0 | 2.0 | 1100 | $1,750 | $1.59 | 4d | 1 | 1.22mi |
| 2331 Finlandia Ln #53 Clearwater, FL | 1.0 | 1.0 | 825 | $1,345 | $1.63 | 2d | 1 | 1.23mi |
| 2429 Ecuadorian Way #65 Clearwater, FL | 2.0 | 2.0 | 1100 | $1,600 | $1.45 | 4d | 1 | 1.23mi |
| 2358 Ecuadorian Way #56 Clearwater, FL | 2.0 | 2.0 | 1100 | $1,500 | $1.36 | 2d | 1 | 1.25mi |
| 2284 Philippine Dr #59 Clearwater, FL | 2.0 | 2.0 | 1100 | $1,795 | $1.63 | 21d | 1 | 1.25mi |
| 2448 Columbia Dr #72 Clearwater, FL | 2.0 | 2.0 | 1100 | $1,600 | $1.45 | 23d | 1 | 1.25mi |
| 2359 Finlandia Ln Clearwater, FL | 2.0 | 2.0–20.0 | 1100 | $1,400 | $1.27 | 17d | 2 | 1.26mi |
| 1767 Leo Ln S Unit 104 Clearwater, FL | 1.0 | 1.0 | 710 | $1,395 | $1.96 | 2d | 1 | 1.26mi |
| 2690 Drew St Clearwater, FL | 1.0–3.0 | 1.0–2.0 | 974 | $1,500 | $1.54 | 1d | 12 | 1.27mi |
| 2458 Columbia Dr #64 Clearwater, FL | 1.0 | 1.0 | 825 | $1,275 | $1.55 | 24d | 1 | 1.27mi |
| 2370 Chaucer St Clearwater, FL | 3.0 | 1.0 | 1100 | $2,500 | $2.27 | 4d | 1 | 1.28mi |
| 101 S Old Coachman Rd Clearwater, FL | 3.0 | 1.0–2.0 | 983 | $2,296 | $2.34 | 3d | 16 | 1.29mi |
| 1423 Aries Ln Unit 3 Clearwater, FL | 2.0 | 1.0 | 1015 | $1,600 | $1.58 | 3d | 1 | 1.30mi |
| 1820 Sunset Point Rd Clearwater, FL | 1.0–3.0 | 1.0–2.0 | 918 | $1,668 | $1.82 | 1d | 17 | 1.30mi |
| 1419 Aries Ln Unit 1423 Clearwater, FL | 2.0 | 1.0 | 1015 | $1,600 | $1.58 | 3d | 1 | 1.30mi |
| 631 N Keene Rd Unit S8 Clearwater, FL | 1.0 | 1.0 | 710 | $1,650 | $2.32 | 24d | 1 | 1.31mi |
| 530 Fairwood Ave Clearwater, FL | 2.0–3.0 | 1.0–2.0 | 1042 | $1,309 | $1.26 | 2d | 27 | 1.31mi |
HOA detail
- Monthly dues
- $190 · $2,280/yr
- Likely covers
- waterpool
Listing history 19 events
-
2026-06-18days on market $82,500 Active 262 DOM
-
2026-06-17days on market $82,500 Active 261 DOM
-
2026-06-16days on market $82,500 Active 260 DOM
-
2026-06-15days on market $82,500 Active 259 DOM
-
2026-06-13days on market $82,500 Active 257 DOM
-
2026-06-09days on market $82,500 Active 253 DOM
-
2026-06-08days on market $82,500 Active 252 DOM
-
2026-06-07days on market $82,500 Active 251 DOM
-
2026-06-04days on market $82,500 Active 248 DOM
-
2026-06-03days on market $82,500 Active 247 DOM
-
2026-06-01days on market $82,500 Active 245 DOM
-
2026-05-31days on market $82,500 Active 244 DOM
-
2026-04-14price $82,500
-
2026-03-22price $87,500
-
2025-11-11price $89,900
-
2025-09-29$90,900 Active
-
2025-05-31historical
-
2025-04-08price $90,900
-
2025-01-11$99,900 Active
ⓘ Source: listings_history table (triggers on properties + properties_extension) + one-shot
backfill from property_details.listing_events for pre-trigger history.
Climate risk First Street
- Flood 3/10 Moderate FEMA zone X (unshaded) · 20% chance over 30 yrs
- Wildfire 1/10 Low
- Heat 10/10 Extreme 6 d/yr ≥107°F today · 22 d/yr by 30 yrs out
- Wind 10/10 Extreme 99% chance of damaging wind over 30 yrs
- Air quality 3/10 Moderate 3 unhealthy d/yr today · 3 by 30 yrs out
Nearby sold comps map
Loading sold comps map…
Walkable amenities ~0.75 mi
Loading nearby amenities…
Taxation est. · year 1
- Rental income
- $20,703
- − Mortgage interest
- −$4,621
- − Property taxes
- −$1,238
- − Insurance
- −$412
- − Repairs & maintenance
- −$1,656
- − Management
- −$1,656
- − HOA
- −$2,280
- − Depreciation
- −$2,400
- Taxable income
- $6,439
- Est. tax owed @ 24.0%
- −$1,545
- After-tax cash flow
- $5,688/yr
For passive investors: Depreciation is non-cash, so a rental often shows a tax loss while cash-flowing — sheltering income. Rental losses are passive: they offset passive income freely, and up to $25,000/yr can offset ordinary (W-2) income if you actively participate and your MAGI is under $100k (phasing out to $0 by $150k); unused losses carry forward. On sale, claimed depreciation is recaptured at up to 25%, and gains may owe capital-gains tax (a 1031 exchange can defer both). Figures are a year-1 estimate at your 24.0% rate — not tax advice; consult a CPA.
Schools (NCES district)
- District
- Pinellas
- NCES district ID
- 1201560
- Math proficiency
- 51% ▼ -5.00%
- Reading proficiency
- 51% ▼ -3.00%
- Median HH income
- $46,270
- Composite
- 43.27/100
- National rank
- #3046
- State rank
- #31 of 73 in FL
Livability — Clearwater
- Score
- 82/100
- State rank
- #60
- US rank
- #988
Category grades
Schools grade is shown separately in the Schools card above.
Census & demographics
- County
- Pinellas County · 939,478 people
- City population
- 170,933
- Metro
- Tampa-St. Petersburg-Clearwater, FL
- Population (ZIP)
- 13,808
- Household income
- $69,199
- Rent vs Own
- Severe rent burden
- 604.0
Population outlook (Pinellas County) Hauer SSP2
- Today (2025)
- 1,027,532 people
- By 2030
- 1,063,586 · +3.5%
- By 2040
- 1,125,020 · +9.5%
- By 2050
- 1,168,637 · +13.7%
- By 2075
- 1,265,188 · +23.1%
- By 2100
- 1,260,357 · +22.7%
Race, ethnicity, and origin ACS 2023
- Neighborhood character
- Diverse neighborhood (Simpson 0.55)
- Race & ethnicity
- White 63% Hispanic / Latino 19% Two or more races 13% Black 8% Asian 7%
- Hispanic origin (detail)
- Mexican 7% Puerto Rican 4% Cuban 1%
- Common ancestry
- Romanian 3% Slovak 2% Italian 2%
- Foreign-born
- 22% · Canada, Jamaica, Vietnam
- Languages at home
- 71% English-only · Spanish 17% Other Indo-European 6% Vietnamese 2%
Political lean MEDSL · Pinellas
- 2024 margin
- Lean R (+5.2) · D 46.9% · R 52.1%
- 2008→2024 swing
- -13.5pp toward R · 2008: 8.3pp · 2024: -5.2pp
- All cycles
- 2024: R+5.2 2020: D+0.2 2016: R+1.1 2012: D+5.6 2008: D+8.3
Not yet ingested
- Civics
- —
Market trends
- HPI YoY
- ▼ -146.56%
- Current HPI
- 314.4864
- Rent YoY
- ▼ -4.61%
- Metro
- Tampa-St. Petersburg-Clearwater, FL
- State GDP YoY
- ▲ 3.28%
- F500 in state
- 36
Industry mix (Fortune 500 HQ in FL)
| Industry | F500 HQs | Revenue |
|---|---|---|
| Industrial Technology | 2 | $29B |
|
||
| Insurance | 2 | $17B |
|
||
| Retail | 1 | $60B |
|
||
| Technology Distribution | 1 | $58B |
|
||
| Homebuilding | 1 | $35B |
|
||
| Technology Manufacturing | 1 | $35B |
|
||
Price history
-17.4% since first listed7 events — show timeline
- 2026-04-14 Price Changed $82,500 Stellar MLS as Distributed by MLS Grid
- 2026-03-22 Price Changed $87,500 Stellar MLS as Distributed by MLS Grid
- 2025-11-11 Price Changed $89,900 Stellar MLS as Distributed by MLS Grid
- 2025-09-29 Listed $90,900 Stellar MLS as Distributed by MLS Grid
- 2025-05-31 Listing Removed — Stellar MLS as Distributed by MLS Grid
- 2025-04-08 Price Changed $90,900 Stellar MLS as Distributed by MLS Grid
- 2025-01-11 Listed $99,900 Stellar MLS as Distributed by MLS Grid
Cash-flow waterfall
monthlySold comps — $/sqft
last 12 mo · ≤1 miLoading sold comps…