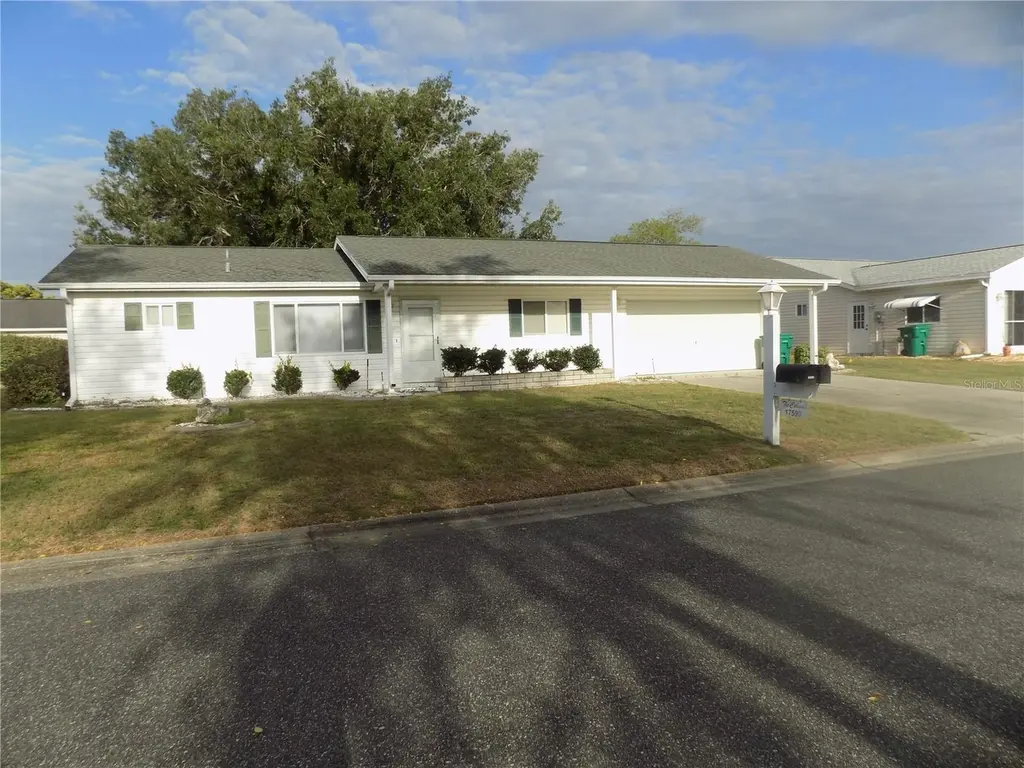
17590 SE 96th Ave · The Villages, FL
Flood risk 6/10 · Moderate
- FEMA flood zone
- X (unshaded)
- Chance of flooding over 30 yrs
- 0.73%
- Est. flood insurance / yr
- $507 – $1,088
Fire risk 1/10 · Minimal
- Est. fire insurance / yr
- $947 – $1,759
Heat risk 9/10 · Severe
- Hot days now (above 109°F)
- 7 days/yr
- Hot days in 30 yrs
- 21 days/yr
Wind risk 9/10 · Severe
- Chance of severe wind over 30 yrs
- 99.0%
Air-quality risk 3/10 · Minor
- Unhealthy air days now
- 2 days/yr
- Unhealthy air days in 30 yrs
- 2 days/yr
Risk factors via First Street. Map © Google.
Why this score? — see what drove the C- grade
The composite is a weighted blend of 9 inputs, each scored 0–100. Each bar is that input's sub-score; the figure is the points it added to the 100-point composite (weight × sub-score).
- Cash flow +16.2/30.0
- ARV discount +15.0/15.0
- 1% rule +5.8/10.0
- DSCR +5.0/10.0
- Schools +3.6/10.0
- Livability +3.5/5.0
- Rent growth +2.5/5.0
- Condition / age +2.5/5.0
- Appreciation +0.0/10.0
$183,900
🖨 Deal sheet 📄 Offer letter ✓ Due diligence
Listing remarks MLS
Don't miss this perfect house. Lived in part time since its purchase. Most of the furniture and kitchen dishes, etc. will convey. Location is perfect for this property close to community center, dog park, ball park and nature area for hiking and dog walking. Little yard upkeep but a generous two car garage. Roof replaced in 2014. Back lanai enclosed in 2008. Front porch is great for sitting and watching the neighborhood, or back porch for peaceful relaxation. Give this beauty a look and choose for you future retirement get a way or full time downsized home.
Key facts
- Dog park
- Ball park
- Front porch
Tags
Neighborhood map
What this means for you Summary
Snapshot
- This is a 2-bed/2.0-bath single-family listed at $184k.
Deal economics
- At list price, monthly cash flow is $96 ($1k/yr) — positive.
- The deal already cash-flows at list — no discount required.
- Meets the 1% rule at list price ($2k rent vs $184k).
- Recommended offer: $173k (6.0% below list) — sets the bar for market timing.
- Cap rate 6.9% vs local median 5.0% in The Villages — top-decile yield for the area; either an underpriced asset or a hidden risk that comps aren't pricing in. Stress-test before assuming the spread holds.
Location & tenants
- Location reads 70/100 on livability (#431 in FL) — a middle-class / working-renter tenant base. Strengths: schools A+, crime A+, housing A; Watch: amenities F, commute F, health & safety F.
- Marion (rural): math 42% / reading 43% proficiency, ranked #61 of 73 in FL (top 84%) — families likely to look elsewhere, expect single-tenant / working-renter base with shorter leases; 61% free/reduced lunch — lower-income household profile, screen leases tightly.
- Market conditions: 705 active listings in the ZIP; 15 comparable units currently listed for rent nearby; rentals at typical pace (median 22d on market — plan ~3-4 weeks tenant-placement turnaround); 7,071 units permitted in Marion County in 2024 (534 in 5+ unit buildings).
- This rent runs 36% of the median local income ($67k/yr) — at the standard rent-burdened threshold; future hikes will face affordability resistance.
Forward outlook
- Local home prices are declining (-3.0%/yr); year-one equity from $1k of loan paydown is wiped out by about $6k of value loss. Plan a longer hold.
- Marion County population projected at +13% by 2050 — modest demand growth; plan on rents tracking national, not racing it.
Negotiation context
- It's been on market 70 days — a 6% lower offer ($173k) is reasonable based on typical stale-listing flexibility.
- Current owner paid $62k; list at $184k implies a 195% gain — meaningful room to come down on a strong offer.
Risks & watch-outs
- Climate carrying-cost: major flood risk; severe wind risk, 99% chance of damaging wind over 30y; extreme-heat days projected 7→21/yr by 2055 (HVAC capex compounding) — expect insurance premiums to compound above CPI over the hold.
Questions for the listing agent
- It's been on market 70 days. Have you received any prior offers? Is the seller open to a 6% concession, seller financing, or rate buy-down credit?
- What does the HOA fee cover, when was the last increase, and are there any pending special assessments or reserve-fund shortfalls?
- Why hasn't it sold? Are there any deal-killer items the seller is aware of (foundation, flood, title, zoning, code violations)?
- Is there a deadline driving the sale (1031 exchange, divorce, estate, relocation)? That informs how much negotiation room exists.
- Schools are A-rated — typically a magnet for longer-tenancy family renters. What's the average tenant stay here, and is there a school-zone premium baked into asking?
- What's the average days-on-market for RENTAL listings here right now (not sales)? A rising rental-DOM trend means longer vacancies and softer asking-rent achievability than the comps imply.
- What's the recent tenant-quality profile in this submarket — average credit score on applications, eviction rate, late-payment / NSF rate, and stable-employment percentage? A property-management company in the area should have these aggregated.
- How much new for-sale + rental construction is in the pipeline within 1–3 miles? Heavy new supply typically softens prices + rents 12–24 months out; constrained supply supports both.
Investment metrics
- 1% rule
- 1.08% ✓
- Cap rate
- 6.92%
- Cash-on-cash
- 2.24%
- DSCR
- 1.10
- GRM
- 7.7
CMA / ARV
- ARV (median comp)
- $235,747
- List price
- $183,900
- Delta
- -21.99%
- Verdict
- UNDERPRICED
- Comps
- 20 within 1.0 mi
Show comp detail 12 sales within ~0.75 mi
| Address | Dist | Beds/Ba | Sqft | Sold | Price | $/sf | Match |
|---|---|---|---|---|---|---|---|
| 17574 SE 95th Ct | 0.06mi | 2/2.0 | 1,008 (0%) | 11mo | $216,900 | $215 | 88 |
| 2603 Olivarez Way | 0.64mi | 2/2.0 | 1,121 (+11%) | 2mo | $252,000 | $225 | 50 |
| 1647 Campos Dr | 0.66mi | 2/2.0 | 1,121 (+11%) | 1mo | $250,000 | $223 | 50 |
| 1649 Campos Dr | 0.66mi | 2/2.0 | 1,121 (+11%) | 3mo | $223,000 | $199 | 48 |
| 2799 Privada Dr | 0.66mi | 2/2.0 | 1,091 (+8%) | 10mo | $245,000 | $225 | 47 |
| 2632 Moncayo Ave | 0.66mi | 2/2.0 | 1,143 (+13%) | 2mo | $220,000 | $192 | 45 |
| 10235 SE 179th Pl | 0.68mi | 2/2.0 | 1,144 (+14%) | 2mo | $180,599 | $158 | 45 |
| 2788 Privada Dr | 0.60mi | 2/2.0 | 1,148 (+14%) | 5mo | $220,000 | $192 | 44 |
| 2714 Moncayo Ave | 0.65mi | 2/2.0 | 1,121 (+11%) | 9mo | $220,000 | $196 | 44 |
| 1713 EL Nino St | 0.59mi | 2/2.0 | 1,121 (+11%) | 12mo | $225,000 | $201 | 44 |
| 2008 Peachtree Ave | 0.67mi | 2/2.0 | 1,158 (+15%) | 8mo | $299,999 | $259 | 38 |
| 2606 Olivarez Way | 0.64mi | 2/2.0 | 1,143 (+13%) | 13mo | $279,500 | $245 | 37 |
Match score weights: distance 35% · size 25% · config 20% · recency 20%. Top-matched comps best support the ARV.
Projected returns pro-forma
-3.0% appreciation · 3.0% rent growth · sell at horizon
- IRR
- -12.7%
- Equity multiple
- 0.54×
- Total profit
- $-23,535
- Equity at exit
- $27,420
- IRR
- -3.5%
- Equity multiple
- 0.77×
- Total profit
- $-12,000
- Equity at exit
- $15,900
Cash invested: $51,492 (down + closing). Projections, not guarantees.
Landlord ↔ Tenant lean methodology
- Overall (STATE)
- 87 Strongly Landlord-Friendly
- State Florida
- 87 Strongly Landlord-Friendly · R+3
- County
- — inherits STATE
- City
- — inherits STATE
ZIP-level market 34491
- Home prices YoY
- -35.0%
- Active inventory
- 705
- Price-to-rent
- 7.7×
Monthly cashflow live
- Estimated rent
- $1,985 high interval (Pro) →
- Mortgage (P&I)
- −$964
- Tax from tax record
- −$252 /mo · $3,027/yr
- Insurance
- −$77
- HOA
- −$179
- Vacancy / Maint / Mgmt
- −$417
- Net cashflow
- $96
Break-even live
UW: 25.0% down · 7.5% · 30yr · 1.5% tax · 5.0% vac · 8.0% maint · 8.0% mgmt
Financing live
Cash to close
- Down payment
- $45,975
- Closing costs
- $5,517
- Reserves months
- —
- Total cash needed
- —
Loan-product check · same deal, 3 products live
Conventional
25% down · 7.5% · 30yr
- Down + closing
- —
- Monthly P&I
- —
- Monthly cashflow
- —
- DSCR
- —
- Eligible?
- —
Personal DTI + credit; lowest rate.
DSCR
20% down · 8.5% · 30yr
- Down + closing
- —
- Monthly P&I
- —
- Monthly cashflow
- —
- DSCR
- —
- Eligible?
- —
No personal income docs; deal must DSCR.
Hard money
10% down · 12.0% · 12mo
- Down + closing
- —
- Monthly P&I
- —
- Monthly cashflow
- —
- DSCR
- —
- Eligible?
- —
Short-term bridge; refi at stabilization.
Rent comps 15 comps
| Address | Beds | Baths | Sqft | Rent | $/sqft | DOM | Units | Dist |
|---|---|---|---|---|---|---|---|---|
| 17713 SE 95th Cir Summerfield, FL | 3.0 | 2.0 | 1450 | $2,000 | $1.38 | 21d | 1 | 0.10mi |
| 17532 SE 100th Ct Summerfield, FL | 2.0 | 2.0 | 1217 | $1,800 | $1.48 | 21d | 1 | 0.50mi |
| 17199 SE 97th Ter Summerfield, FL | 3.0 | 2.0 | 1404 | $1,990 | $1.42 | 21d | 1 | 0.57mi |
| 2909 Meadow Lawn Ln The Villages, FL | 2.0 | 2.0 | 1132 | $4,300 | $3.80 | 21d | 1 | 0.66mi |
| 1808 Peachtree Ave The Villages, FL | 2.0 | 2.0 | 1182 | $2,500 | $2.12 | 21d | 1 | 0.72mi |
| 1648 Belle Grove Dr The Villages, FL | 2.0 | 2.0 | 1132 | $4,250 | $3.75 | 21d | 1 | 0.74mi |
| 10397 SE 176th St Summerfield, FL | 2.0 | 2.0 | 1296 | $2,150 | $1.66 | 21d | 1 | 0.80mi |
| 16962 SE 94th Sunnybrook Cir The Villages, FL | 2.0 | 2.0 | 1160 | $2,000 | $1.72 | 21d | 1 | 0.84mi |
| 9523 SE 168th Maplesong Ln The Villages, FL | 3.0 | 2.0 | 1265 | $1,975 | $1.56 | 21d | 1 | 0.88mi |
| 9990 SE 166th St Summerfield, FL | 3.0 | 2.0 | 962 | $1,395 | $1.45 | 14d | 1 | 1.19mi |
| 8544 SE 177th Bartram Loop The Villages, FL | 2.0 | 2.0 | 1265 | $1,900 | $1.50 | 21d | 1 | 1.23mi |
| 17324 SE 82nd Pecan Ter The Villages, FL | 2.0 | 2.0 | 1358 | $2,500 | $1.84 | 21d | 1 | 1.39mi |
| 17400 SE 82nd Roslyn Ct The Villages, FL | 2.0 | 2.0 | 1138 | $4,700 | $4.13 | 21d | 1 | 1.41mi |
| 2829 Burgos Dr The Villages, FL | 2.0 | 2.0 | 1156 | $1,850 | $1.60 | 21d | 1 | 1.47mi |
| 1129 Santa Cruz Dr The Villages, FL | 2.0 | 2.0 | 1102 | $2,350 | $2.13 | 21d | 1 | 1.48mi |
HOA detail
- Monthly dues
- $179 · $2,148/yr
Listing history 18 events
-
2026-06-18days on market $183,900 Active 70 DOM
-
2026-06-17days on market $183,900 Active 69 DOM
-
2026-06-16days on market $183,900 Active 68 DOM
-
2026-06-15days on market $183,900 Active 67 DOM
-
2026-06-14days on market $183,900 Active 65 DOM
-
2026-06-13days on market $183,900 Active 64 DOM
-
2026-06-10days on market $183,900 Active 62 DOM
-
2026-06-09days on market $183,900 Active 61 DOM
-
2026-06-08days on market $183,900 Active 60 DOM
-
2026-06-07days on market $183,900 Active 59 DOM
-
2026-06-03days on market $183,900 Active 55 DOM
-
2026-06-02days on market $183,900 Active 54 DOM
-
2026-06-01days on market $183,900 Active 53 DOM
-
2026-05-31days on market $183,900 Active 52 DOM
-
2026-05-30days on market $183,900 Active 51 DOM
-
2026-05-15price $183,900 565-char remark
Show marketing remark (565 chars)
Don't miss this perfect house. Lived in part time since its purchase. Most of the furniture and kitchen dishes, etc. will convey. Location is perfect for this property close to community center, dog park, ball park and nature area for hiking and dog walking. Little yard upkeep but a generous two car garage. Roof replaced in 2014. Back lanai enclosed in 2008. Front porch is great for sitting and watching the neighborhood, or back porch for peaceful relaxation. Give this beauty a look and choose for you future retirement get a way or full time downsized home.
-
2026-04-09$189,000 Active 565-char remark
Show marketing remark (565 chars)
Don't miss this perfect house. Lived in part time since its purchase. Most of the furniture and kitchen dishes, etc. will convey. Location is perfect for this property close to community center, dog park, ball park and nature area for hiking and dog walking. Little yard upkeep but a generous two car garage. Roof replaced in 2014. Back lanai enclosed in 2008. Front porch is great for sitting and watching the neighborhood, or back porch for peaceful relaxation. Give this beauty a look and choose for you future retirement get a way or full time downsized home.
-
1993-11-09soldstatus $62,400
ⓘ Source: listings_history table (triggers on properties + properties_extension) + one-shot
backfill from property_details.listing_events for pre-trigger history.
Tax reassessment forecast FL · Resets to sale price
- Current annual tax
- $3,027 · $252/mo
- Projected year-2 tax
- $3,027 · $252/mo
- Expected delta
- $0/yr ($0/mo · -0.0%)
ⓘ Screening estimate from a state-policy table — verify with the county assessor before closing.
Climate risk First Street
- Flood 6/10 Major FEMA zone X (unshaded) · 73% chance over 30 yrs
- Wildfire 1/10 Low
- Heat 9/10 Extreme 7 d/yr ≥109°F today · 21 d/yr by 30 yrs out
- Wind 9/10 Extreme 99% chance of damaging wind over 30 yrs
- Air quality 3/10 Moderate 2 unhealthy d/yr today · 2 by 30 yrs out
Nearby sold comps map
Loading sold comps map…
Walkable amenities ~0.75 mi
Loading nearby amenities…
Taxation est. · year 1
- Rental income
- $23,822
- − Mortgage interest
- −$10,301
- − Property taxes
- −$3,027
- − Insurance
- −$920
- − Repairs & maintenance
- −$1,906
- − Management
- −$1,906
- − HOA
- −$2,148
- − Depreciation
- −$5,350
- Taxable loss
- −$1,736
- Est. tax savings @ 24.0%
- +$417
- After-tax cash flow
- $1,568/yr
For passive investors: Depreciation is non-cash, so a rental often shows a tax loss while cash-flowing — sheltering income. Rental losses are passive: they offset passive income freely, and up to $25,000/yr can offset ordinary (W-2) income if you actively participate and your MAGI is under $100k (phasing out to $0 by $150k); unused losses carry forward. On sale, claimed depreciation is recaptured at up to 25%, and gains may owe capital-gains tax (a 1031 exchange can defer both). Figures are a year-1 estimate at your 24.0% rate — not tax advice; consult a CPA.
Schools (NCES district)
- District
- Marion
- NCES district ID
- 1201260
- Math proficiency
- 42% ▼ -7.00%
- Reading proficiency
- 43% ▼ -4.00%
- Median HH income
- $40,015
- Composite
- 35.61/100
- National rank
- #4890
- State rank
- #61 of 73 in FL
Livability — The Villages
- Score
- 70/100
- State rank
- #431
- US rank
- #7363
Category grades
Schools grade is shown separately in the Schools card above.
Census & demographics
- Census place
- The Villages, FL
- County
- Marion County · 315,796 people
- City population
- 83,973
- Metro
- Ocala, FL
- Population (ZIP)
- 33,318
- Household income
- $66,679
- Rent vs Own
- Severe rent burden
- 256.0
Population outlook (Marion County) Hauer SSP2
- Today (2025)
- 365,905 people
- By 2030
- 376,768 · +3.0%
- By 2040
- 396,555 · +8.4%
- By 2050
- 412,723 · +12.8%
- By 2075
- 446,090 · +21.9%
- By 2100
- 436,193 · +19.2%
Race, ethnicity, and origin ACS 2023
- Neighborhood character
- Predominantly White (77%)
- Race & ethnicity
- White 77% Hispanic / Latino 14% Two or more races 9% Black 4% Asian 2%
- Hispanic origin (detail)
- Mexican 3% Puerto Rican 6% Cuban 1%
- Common ancestry
- Lithuanian 3% Slovak 2% Romanian 2%
- Foreign-born
- 8% · Canada, Vietnam, Jamaica
- Languages at home
- 85% English-only · Spanish 11% Vietnamese 1% French/Haitian/Cajun 1%
Political lean MEDSL · Marion
- 2024 margin
- Solid R (+31.6) · D 33.8% · R 65.5%
- 2008→2024 swing
- -20.0pp toward R · 2008: -11.6pp · 2024: -31.6pp
- All cycles
- 2024: R+31.6 2020: R+25.9 2016: R+26.2 2012: R+16.2 2008: R+11.6
Not yet ingested
- Civics
- —
Market trends
- HPI YoY
- ▼ -107.67%
- Current HPI
- 200.0792
- Rent YoY
- —
- Metro
- Ocala, FL
- State GDP YoY
- ▲ 3.28%
- F500 in state
- 36
Industry mix (Fortune 500 HQ in FL)
| Industry | F500 HQs | Revenue |
|---|---|---|
| Industrial Technology | 2 | $29B |
|
||
| Insurance | 2 | $17B |
|
||
| Retail | 1 | $60B |
|
||
| Technology Distribution | 1 | $58B |
|
||
| Homebuilding | 1 | $35B |
|
||
| Technology Manufacturing | 1 | $35B |
|
||
Price history
+194.7% since first listed3 events — show timeline
- 2026-05-15 Price Changed $183,900 Stellar MLS as Distributed by MLS Grid
- 2026-04-09 Listed $189,000 Stellar MLS as Distributed by MLS Grid
- 1993-11-09 Sold (Public Records) $62,400 Public Records
Property tax history
+8.2%/yrLatest (2025): $3,027 · +8.3% YoY. Source: county tax records.
Cash-flow waterfall
monthlySold comps — $/sqft
last 12 mo · ≤1 miLoading sold comps…