855 15th W · Lakehills, TX
Flood risk 1/10 · Minimal
- FEMA flood zone
- X (unshaded)
- Chance of flooding over 30 yrs
- 0.0%
- Est. flood insurance / yr
- $507 – $1,088
Fire risk 3/10 · Minor
- Est. fire insurance / yr
- $1,222 – $2,270
Heat risk 7/10 · Major
- Hot days now (above 106°F)
- 7 days/yr
- Hot days in 30 yrs
- 22 days/yr
Wind risk 6/10 · Moderate
- Chance of severe wind over 30 yrs
- 62.0%
Air-quality risk 1/10 · Minimal
- Unhealthy air days now
- 0 days/yr
- Unhealthy air days in 30 yrs
- 0 days/yr
Risk factors via First Street. Map © Google.
Why this score? — see what drove the D+ grade
The composite is a weighted blend of 9 inputs, each scored 0–100. Each bar is that input's sub-score; the figure is the points it added to the 100-point composite (weight × sub-score).
- Cash flow +19.8/30.0
- ARV discount +7.5/15.0
- DSCR +6.3/10.0
- 1% rule +5.3/10.0
- Schools +3.1/10.0
- Livability +3.1/5.0
- Rent growth +2.5/5.0
- Condition / age +1.0/5.0
- Appreciation +0.0/10.0
$99,999
🖨 Deal sheet (PDF) 📄 Offer letter ✓ Due diligence
Listing remarks MLS
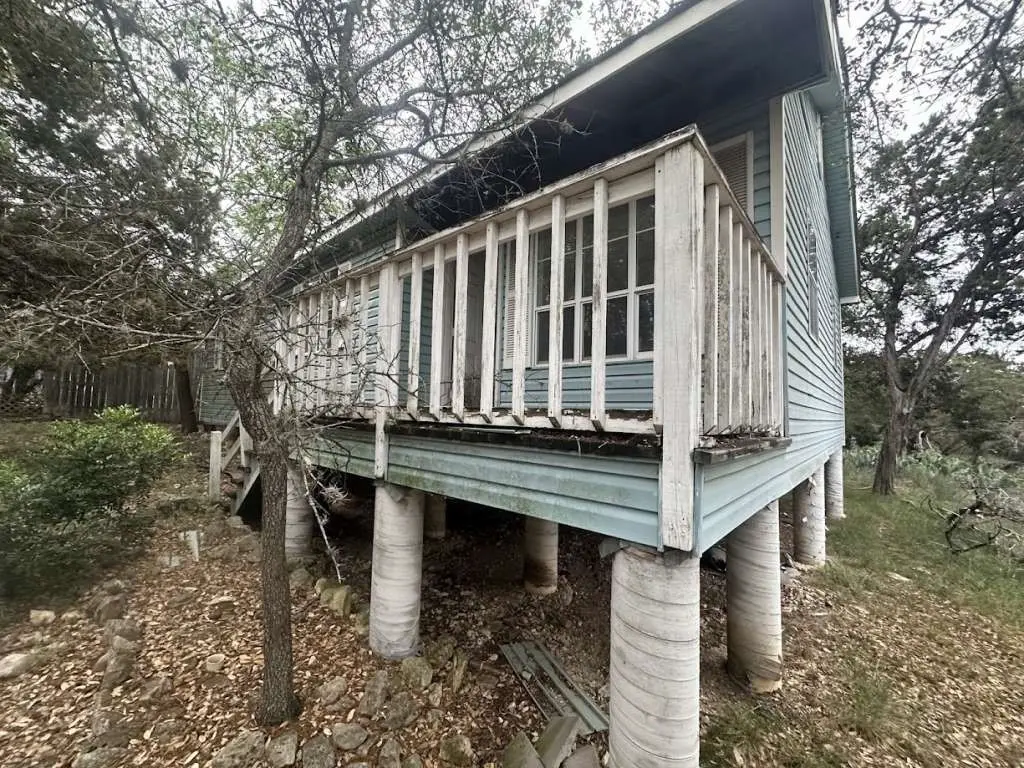
PROPERTY IN LAKEHILLS! This home needs some repairs but has lots of potential. It is located on a 13,500 sqft. lot that offers both ample yard space and value. The location is down the road from Medina Lake and less than an hour from Downtown San Antonio. Here you can enjoy convenient access to PR 37 and TX-16, there are also tons of great eateries, local parks such as the Medina Lake Park, and supermarkets. WE MAKE IT EASY TO OWN. This is a great opportunity! Don't wait, call us today for more information on the owner's easy terms and smooth process that may be able to put the deed in your name and make this your dream home.
Key facts
- 13
- Medina lake park
- 500 sqft lot
Tags
Neighborhood map
What this means for you Summary
Snapshot
- This is a 3-bed/2.0-bath single-family listed at $100k. Condition is rated poor.
Deal economics
- At list price, monthly cash flow is $119 ($1k/yr) — positive.
- The deal already cash-flows at list — no discount required.
- Meets the 1% rule at list price ($1k rent vs $100k).
- Recommended offer: $88k (12.0% below list) — sets the bar for market timing.
- Cap rate 7.7% vs local median 2.2% in Lakehills — top-decile yield for the area; either an underpriced asset or a hidden risk that comps aren't pricing in. Stress-test before assuming the spread holds.
Location & tenants
- Location reads 62/100 on livability (#963 in TX) — a middle-class / working-renter tenant base. Strengths: cost of living A+, housing A+, crime B+; Watch: amenities F, commute F, health & safety F.
- Bandera ISD (rural): math 30% / reading 41% proficiency, ranked #500 of 826 in TX (top 60%) — families likely to look elsewhere, expect single-tenant / working-renter base with shorter leases.
- Zoned schools: Hill Country El (math 47% / reading 46%, grade D-, #1,080 of 4,322 statewide, top 25%, 483 students, 62% FRL); Bandera Middle (math 26% / reading 40%, grade F, #930 of 1,662 statewide, top 57%, 555 students, 56% FRL); Bandera H S (math 22% / reading 46%, grade F, #1,002 of 1,632 statewide, top 62%, 713 students, 48% FRL).
- Market conditions: 271 active listings in the ZIP; 1 comparable units currently listed for rent nearby; 6 units permitted in Bandera County in 2024 (0 in 5+ unit buildings).
Forward outlook
- Local home prices are declining (-3.0%/yr); year-one equity from $691 of loan paydown is wiped out by about $3k of value loss. Plan a longer hold.
Negotiation context
- It's been on market 503 days — a 12% lower offer ($88k) is reasonable based on typical stale-listing flexibility.
Risks & watch-outs
- Climate carrying-cost: major wind risk, 62% chance of damaging wind over 30y; extreme-heat days projected 7→22/yr by 2055 (HVAC capex compounding) — expect insurance premiums to compound above CPI over the hold.
Questions for the listing agent
- It's been on market 503 days. Have you received any prior offers? Is the seller open to a 12% concession, seller financing, or rate buy-down credit?
- Have any recent inspections been done? Can we get a copy of the seller's disclosures and any deferred-maintenance estimates?
- Built in 1960 — when were the roof, HVAC, electrical panel, plumbing, and water heater last replaced?
- Why hasn't it sold? Are there any deal-killer items the seller is aware of (foundation, flood, title, zoning, code violations)?
- Is there a deadline driving the sale (1031 exchange, divorce, estate, relocation)? That informs how much negotiation room exists.
- Schools are D-rated, which usually means shorter tenancies and higher turnover. Who's the typical renter profile here, and what's been the actual vacancy rate?
- The area grade is low — what's the realistic commute time and amenity access for the typical tenant pool here? Any planned neighborhood developments (good or bad) we should know about?
- What's the average days-on-market for RENTAL listings here right now (not sales)? A rising rental-DOM trend means longer vacancies and softer asking-rent achievability than the comps imply.
- What's the recent tenant-quality profile in this submarket — average credit score on applications, eviction rate, late-payment / NSF rate, and stable-employment percentage? A property-management company in the area should have these aggregated.
- How much new for-sale + rental construction is in the pipeline within 1–3 miles? Heavy new supply typically softens prices + rents 12–24 months out; constrained supply supports both.
Investment metrics
- 1% rule
- 1.03% ✓
- Cap rate
- 7.72%
- Cash-on-cash
- 5.09%
- DSCR
- 1.23
- GRM
- 8.1
CMA / ARV
- ARV (median comp)
- $225,552
- List price
- $99,999
- Delta
- -55.66%
- Verdict
- UNDERPRICED
- Comps
- 17 within 1.0 mi
Show comp detail 4 sales within ~0.75 mi
| Address | Dist | Beds/Ba | Sqft | Sold | Price | $/sf | Match |
|---|---|---|---|---|---|---|---|
| 1021 13th | 0.10mi | 3/2.0 | 1,344 (+14%) | 8mo | $250,000 | $186 | 66 |
| 2200 8th St | 0.43mi | 3/2.0 | 1,152 (-2%) | 17mo | $275,000 | $239 | 62 |
| 447 24th St W | 0.37mi | 3/1.0 | 1,120 (-5%) | 16mo | $125,000 | $112 | 57 |
| 686 Elmhurst | 0.68mi | 3/2.0 | 1,350 (+14%) | 10mo | $274,000 | $203 | 36 |
Match score weights: distance 35% · size 25% · config 20% · recency 20%. Top-matched comps best support the ARV.
Projected returns pro-forma
-3.0% appreciation · 3.0% rent growth · sell at horizon
- IRR
- -8.4%
- Equity multiple
- 0.69×
- Total profit
- $-8,630
- Equity at exit
- $14,910
- IRR
- 1.2%
- Equity multiple
- 1.08×
- Total profit
- $2,281
- Equity at exit
- $8,646
Cash invested: $28,000 (down + closing). Projections, not guarantees.
Landlord ↔ Tenant lean methodology
- Overall (STATE)
- 87 Strongly Landlord-Friendly
- State Texas
- 87 Strongly Landlord-Friendly · R+5
- County
- — inherits STATE
- City
- — inherits STATE
ZIP-level market 78063
- Home prices YoY
- -31.6%
- Active inventory
- 271
- Price-to-rent
- 8.1×
Monthly cashflow live
- Estimated rent
- $1,025 medium interval (Pro) →
- Mortgage (P&I)
- −$524
- Tax est. 1.5%
- −$125 /mo · $1,500/yr
- Insurance
- −$42
- HOA
- −$0
- Vacancy / Maint / Mgmt
- −$215
- Net cashflow
- $119
Break-even live
Sensitivity live
| Price | -10% $188 | -5% $153 | +0% $119 | +5% $84 | +10% $50 |
|---|---|---|---|---|---|
| Rent | -10% $38 | -5% $78 | +0% $119 | +5% $159 | +10% $200 |
| Rate | -1.0pp $169 | -0.5pp $144 | base $119 | +0.5pp $93 | +1.0pp $66 |
UW: 25.0% down · 7.5% · 30yr · 1.5% tax · 5.0% vac · 8.0% maint · 8.0% mgmt
Financing live
Cash to close
- Down payment
- $25,000
- Closing costs
- $3,000
- Reserves months
- —
- Total cash needed
- —
Loan-product check · same deal, 3 products live
Conventional
25% down · 7.5% · 30yr
- Down + closing
- —
- Monthly P&I
- —
- Monthly cashflow
- —
- DSCR
- —
- Eligible?
- —
Personal DTI + credit; lowest rate.
DSCR
20% down · 8.5% · 30yr
- Down + closing
- —
- Monthly P&I
- —
- Monthly cashflow
- —
- DSCR
- —
- Eligible?
- —
No personal income docs; deal must DSCR.
Hard money
10% down · 12.0% · 12mo
- Down + closing
- —
- Monthly P&I
- —
- Monthly cashflow
- —
- DSCR
- —
- Eligible?
- —
Short-term bridge; refi at stabilization.
Rent comps 1 comps
| Address | Beds | Baths | Sqft | Rent | $/sqft | DOM | Units | Dist |
|---|---|---|---|---|---|---|---|---|
| 10685 Park Road 37 Unit D Lakehills, TX | 3.0 | 2.0 | 1216 | $1,025 | $0.84 | 16d | 1 | 0.72mi |
Listing history 14 events
-
2026-06-21days on market $99,999 Active 503 DOM
-
2026-06-18days on market $99,999 Active 500 DOM
-
2026-06-17days on market $99,999 Active 499 DOM
-
2026-06-16days on market $99,999 Active 498 DOM
-
2026-06-15days on market $99,999 Active 497 DOM
-
2026-06-13days on market $99,999 Active 495 DOM
-
2026-06-09days on market $99,999 Active 491 DOM
-
2026-06-07days on market $99,999 Active 489 DOM
-
2026-06-04days on market $99,999 Active 486 DOM
-
2026-06-03days on market $99,999 Active 485 DOM
-
2026-06-02days on market $99,999 Active 484 DOM
-
2026-06-01days on market $99,999 Active 483 DOM
-
2026-05-31days on market $99,999 Active 482 DOM
-
2025-02-03$99,999 Active 633-char remark
Show marketing remark (633 chars)
PROPERTY IN LAKEHILLS! This home needs some repairs but has lots of potential. It is located on a 13,500 sqft. lot that offers both ample yard space and value. The location is down the road from Medina Lake and less than an hour from Downtown San Antonio. Here you can enjoy convenient access to PR 37 and TX-16, there are also tons of great eateries, local parks such as the Medina Lake Park, and supermarkets. WE MAKE IT EASY TO OWN. This is a great opportunity! Don't wait, call us today for more information on the owner's easy terms and smooth process that may be able to put the deed in your name and make this your dream home.
ⓘ Source: listings_history table (triggers on properties + properties_extension) + one-shot
backfill from property_details.listing_events for pre-trigger history.
Climate risk First Street
- Flood 1/10 Low FEMA zone X (unshaded) · 0% chance over 30 yrs
- Wildfire 3/10 Moderate
- Heat 7/10 Severe 7 d/yr ≥106°F today · 22 d/yr by 30 yrs out
- Wind 6/10 Major 62% chance of damaging wind over 30 yrs
- Air quality 1/10 Low 0 unhealthy d/yr today · 0 by 30 yrs out
Nearby sold comps map
Loading sold comps map…
Walkable amenities ~0.75 mi
Loading nearby amenities…
Taxation est. · year 1
- Rental income
- $12,300
- − Mortgage interest
- −$5,601
- − Property taxes
- −$1,500
- − Insurance
- −$500
- − Repairs & maintenance
- −$984
- − Management
- −$984
- − Depreciation
- −$2,909
- Taxable loss
- −$179
- Est. tax savings @ 24.0%
- +$43
- After-tax cash flow
- $1,467/yr
For passive investors: Depreciation is non-cash, so a rental often shows a tax loss while cash-flowing — sheltering income. Rental losses are passive: they offset passive income freely, and up to $25,000/yr can offset ordinary (W-2) income if you actively participate and your MAGI is under $100k (phasing out to $0 by $150k); unused losses carry forward. On sale, claimed depreciation is recaptured at up to 25%, and gains may owe capital-gains tax (a 1031 exchange can defer both). Figures are a year-1 estimate at your 24.0% rate — not tax advice; consult a CPA.
Condition & rehab AI · 12 photos
This property requires extensive repairs and updates to bring it up to a livable condition. The home is in poor condition, with significant damage to the kitchen, bathrooms, exterior, interior walls, roof, HVAC, and landscaping. The highest-ROI updates include exterior siding repair and replacement, interior wall repair and painting, roof repair and replacement, HVAC/mechanical replacement, and landscaping and yard maintenance.
Repairs flagged
- Major kitchen flooring — The kitchen flooring is completely destroyed and needs replacement.
- Major bathroom flooring — The bathroom flooring is completely destroyed and needs replacement.
- Major exterior siding — The exterior siding is peeling and damaged, with visible rot and structural issues.
- Major interior walls — The interior walls are bare and show signs of damage and neglect.
- Major roof — The roof appears to be in poor condition, with visible damage and potential water infiltration.
- Major HVAC/mechanicals — The HVAC and mechanical systems are completely destroyed and need replacement.
- Major landscaping — The landscaping is overgrown and in poor condition, with debris scattered throughout the yard.
Value-add opportunities
- Both exterior siding repair and replacement — Repairing and replacing the exterior siding will improve the home's curb appeal and increase its resale and rental value.
- Both interior wall repair and painting — Repairing and painting the interior walls will improve the home's appearance and increase its resale and rental value.
- Both roof repair and replacement — Repairing and replacing the roof will prevent water damage and improve the home's structural integrity, increasing its resale and rental value.
- Both HVAC/mechanical replacement — Replacing the HVAC and mechanical systems will improve the home's comfort and energy efficiency, increasing its resale and rental value.
- Both landscaping and yard maintenance — Landscaping and maintaining the yard will improve the home's curb appeal and increase its resale and rental value.
Renovation cost estimate screening
| Repair item | Severity | Est. cost |
|---|---|---|
| kitchen flooring · The kitchen flooring is completely destroyed and needs replacement. | Major | $15,000–50,000 |
| bathroom flooring · The bathroom flooring is completely destroyed and needs replacement. | Major | $15,000–50,000 |
| exterior siding · The exterior siding is peeling and damaged, with visible rot and structural issues. | Major | $15,000–50,000 |
| interior walls · The interior walls are bare and show signs of damage and neglect. | Major | $15,000–50,000 |
| roof · The roof appears to be in poor condition, with visible damage and potential water infiltration. | Major | $15,000–50,000 |
| HVAC/mechanicals · The HVAC and mechanical systems are completely destroyed and need replacement. | Major | $15,000–50,000 |
| landscaping · The landscaping is overgrown and in poor condition, with debris scattered throughout the yard. | Major | $15,000–50,000 |
| Total estimated repair cost · 7 items | $105,000–350,000 |
Value-add ROI direction
- Both exterior siding repair and replacement — Repairing and replacing the exterior siding will improve the home's curb appeal and increase its resale and rental value. ↑
- Both interior wall repair and painting — Repairing and painting the interior walls will improve the home's appearance and increase its resale and rental value. ↑
- Both roof repair and replacement — Repairing and replacing the roof will prevent water damage and improve the home's structural integrity, increasing its resale and rental value. ↑
- Both HVAC/mechanical replacement — Replacing the HVAC and mechanical systems will improve the home's comfort and energy efficiency, increasing its resale and rental value. ↑
- Both landscaping and yard maintenance — Landscaping and maintaining the yard will improve the home's curb appeal and increase its resale and rental value. ↑
ⓘ Cost ranges are severity-bucket heuristics (US national rule-of-thumb). Get contractor quotes + a written scope before underwriting a rehab budget.
Schools (NCES district)
- District
- Bandera ISD
- NCES district ID
- 4809360
- Math proficiency
- 30% ▼ -7.00%
- Reading proficiency
- 41% ▼ -3.00%
- Median HH income
- $48,771
- Composite
- 30.61/100
- National rank
- #6194
- State rank
- #500 of 826 in TX
Livability — Lakehills
- Score
- 62/100
- State rank
- #963
- US rank
- #17024
Category grades
Schools grade is shown separately in the Schools card above.
Census & demographics
- Census place
- Lakehills, TX
- City population
- 10,594
- Population (ZIP)
- 10,594
Population outlook (Bandera County) Hauer SSP2
- Today (2025)
- 22,614 people
- By 2030
- 23,102 · +2.2%
- By 2040
- 23,489 · +3.9%
- By 2050
- 23,264 · +2.9%
- By 2075
- 23,607 · +4.4%
- By 2100
- 22,265 · -1.5%
Race, ethnicity, and origin ACS 2023
- Neighborhood character
- Predominantly White (76%)
- Race & ethnicity
- White 76% Hispanic / Latino 18% Two or more races 15%
- Hispanic origin (detail)
- Mexican 15%
- Common ancestry
- Slovak 5% Romanian 3% Serbian 2%
- Foreign-born
- 5% · Canada
- Languages at home
- 88% English-only · Spanish 9% German/W. Germanic 2%
Political lean MEDSL · Bandera
- 2024 margin
- Solid R (+61.9) · D 18.6% · R 80.5%
- 2008→2024 swing
- -11.5pp toward R · 2008: -50.4pp · 2024: -61.9pp
- All cycles
- 2024: R+61.9 2020: R+59.4 2016: R+63.0 2012: R+59.0 2008: R+50.4
Not yet ingested
- Civics
- —
Market trends
- HPI YoY
- ▼ -87.38%
- Current HPI
- 189.1086
- Rent YoY
- —
- Metro
- —
- State GDP YoY
- ▲ 3.95%
- F500 in state
- 110
Industry mix (Fortune 500 HQ in TX)
| Industry | F500 HQs | Revenue |
|---|---|---|
| Energy | 16 | $1,198B |
|
||
| Technology | 5 | $198B |
|
||
| Engineering / Construction | 4 | $72B |
|
||
| Energy Services | 3 | $60B |
|
||
| Utilities | 3 | $41B |
|
||
| Healthcare | 2 | $330B |
|
||
Price history
1 event — show timeline
- 2025-02-03 Listed $99,999 HARMLS
Cash-flow waterfall
monthlySold comps — $/sqft
last 12 mo · ≤1 miLoading sold comps…