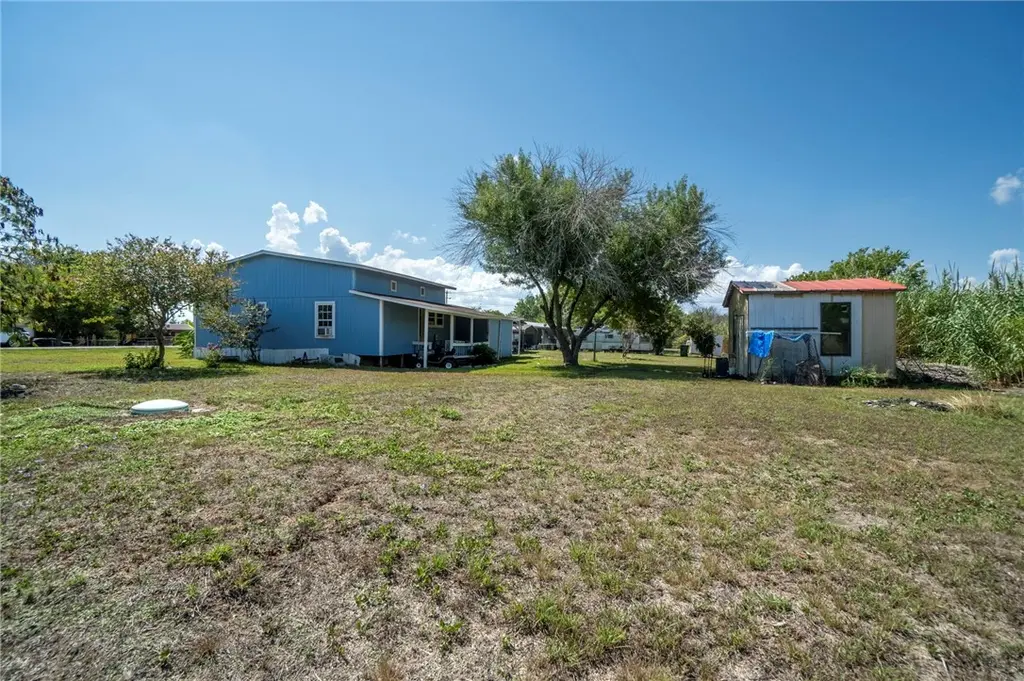
110 Belinda Ln · Kyle, TX
Flood risk 1/10 · Minimal
- FEMA flood zone
- X (unshaded)
- Chance of flooding over 30 yrs
- 0.0%
- Est. flood insurance / yr
- $507 – $1,088
Fire risk 5/10 · Moderate
- Est. fire insurance / yr
- $1,222 – $2,270
Heat risk 8/10 · Major
- Hot days now (above 108°F)
- 7 days/yr
- Hot days in 30 yrs
- 22 days/yr
Wind risk 8/10 · Major
- Chance of severe wind over 30 yrs
- 80.0%
Air-quality risk 1/10 · Minimal
- Unhealthy air days now
- 0 days/yr
- Unhealthy air days in 30 yrs
- 0 days/yr
Risk factors via First Street. Map © Google.
Why this score? — see what drove the C grade
The composite is a weighted blend of 9 inputs, each scored 0–100. Each bar is that input's sub-score; the figure is the points it added to the 100-point composite (weight × sub-score).
- Cash flow +24.4/30.0
- DSCR +7.9/10.0
- ARV discount +7.5/15.0
- 1% rule +5.4/10.0
- Livability +3.8/5.0
- Schools +3.5/10.0
- Condition / age +2.5/5.0
- Rent growth +2.4/5.0
- Appreciation +0.0/10.0
$199,000
🖨 Deal sheet 📄 Offer letter ✓ Due diligence
Listing remarks MLS
CASH SALE ONLY SOLD AS IS-110 Belinda Lane is a double-wide manufactured home offering 4 bedrooms and 2 full bathrooms with a functional floor plan and defined living spaces suitable for everyday use. Conveniently located near shopping, dining, and major roadways.
Key facts
- 0.61 acre lot
- Garage
- Built 2011
Neighborhood map
What this means for you Summary
Snapshot
- This is a 4-bed/2.0-bath manufactured listed at $199k.
Deal economics
- At list price, monthly cash flow is $403 ($5k/yr) — positive.
- The deal already cash-flows at list — no discount required.
- Meets the 1% rule at list price ($2k rent vs $199k).
- Recommended offer: $175k (12.0% below list) — sets the bar for market timing.
- Cap rate 8.7% vs local median 3.3% in Kyle — top-decile yield for the area; either an underpriced asset or a hidden risk that comps aren't pricing in. Stress-test before assuming the spread holds.
Location & tenants
- Location reads 75/100 on livability (#138 in TX, #3,993 nationally) — a middle-class / working-renter tenant base. Strengths: housing A+, health & safety A+, employment A; Watch: schools D, amenities F, commute F.
- Hays CISD (rural): math 35% / reading 41% proficiency, ranked #390 of 826 in TX (top 47%) — families likely to look elsewhere, expect single-tenant / working-renter base with shorter leases.
- Market conditions: Rents soft (-0.3%/yr); 1801 active listings in the ZIP; 40 comparable units currently listed for rent nearby; rentals at typical pace (median 18d on market — plan ~3-4 weeks tenant-placement turnaround); solid renter incomes; 5,270 units permitted in Hays County in 2024 (1,464 in 5+ unit buildings).
Forward outlook
- Local home prices are declining (-3.0%/yr); year-one equity from $1k of loan paydown is wiped out by about $6k of value loss. Plan a longer hold.
- Hays County population projected at +93% by 2050 — long-run rental-demand tailwind backs the buy-and-hold thesis.
Negotiation context
- It's been on market 132 days — a 12% lower offer ($175k) is reasonable based on typical stale-listing flexibility.
- 2 sale attempts since 4y ago; this cycle's ask has dropped $66k (25%) from the opening price — seller is motivated, your offer sets the floor, not the list.
Risks & watch-outs
- Climate carrying-cost: severe wind risk, 80% chance of damaging wind over 30y; moderate wildfire risk; extreme-heat days projected 7→22/yr by 2055 (HVAC capex compounding) — expect insurance premiums to compound above CPI over the hold.
Questions for the listing agent
- It's been on market 132 days. Have you received any prior offers? Is the seller open to a 12% concession, seller financing, or rate buy-down credit?
- Why hasn't it sold? Are there any deal-killer items the seller is aware of (foundation, flood, title, zoning, code violations)?
- Is there a deadline driving the sale (1031 exchange, divorce, estate, relocation)? That informs how much negotiation room exists.
- Schools are D-rated, which usually means shorter tenancies and higher turnover. Who's the typical renter profile here, and what's been the actual vacancy rate?
- What's the average days-on-market for RENTAL listings here right now (not sales)? A rising rental-DOM trend means longer vacancies and softer asking-rent achievability than the comps imply.
- What's the recent tenant-quality profile in this submarket — average credit score on applications, eviction rate, late-payment / NSF rate, and stable-employment percentage? A property-management company in the area should have these aggregated.
- How much new for-sale + rental construction is in the pipeline within 1–3 miles? Heavy new supply typically softens prices + rents 12–24 months out; constrained supply supports both.
Investment metrics
- 1% rule
- 1.04% ✓
- Cap rate
- 8.73%
- Cash-on-cash
- 8.69%
- DSCR
- 1.39
- GRM
- 8.0
CMA / ARV
- ARV (median comp)
- $464,674
- List price
- $199,000
- Delta
- -57.17%
- Verdict
- UNDERPRICED
- Comps
- 3 within 2.0 mi
Projected returns pro-forma
-3.0% appreciation · 0.0% rent growth · sell at horizon
- IRR
- -6.3%
- Equity multiple
- 0.77×
- Total profit
- $-12,698
- Equity at exit
- $29,672
- IRR
- -0.5%
- Equity multiple
- 0.97×
- Total profit
- $-1,726
- Equity at exit
- $17,206
Cash invested: $55,720 (down + closing). Projections, not guarantees.
Landlord ↔ Tenant lean methodology
- Overall (STATE)
- 87 Strongly Landlord-Friendly
- State Texas
- 87 Strongly Landlord-Friendly · R+5
- County
- — inherits STATE
- City
- — inherits STATE
ZIP-level market 78640
- Home prices YoY
- -33.8%
- Rents YoY
- -0.3%
- Active inventory
- 1801
- Price-to-rent
- 8.0×
Monthly cashflow live
- Estimated rent
- $2,078 high interval (Pro) →
- Mortgage (P&I)
- −$1,044
- Tax from tax record
- −$112 /mo · $1,342/yr
- Insurance
- −$83
- HOA
- −$0
- Vacancy / Maint / Mgmt
- −$436
- Net cashflow
- $403
Break-even live
UW: 25.0% down · 7.5% · 30yr · 1.5% tax · 5.0% vac · 8.0% maint · 8.0% mgmt
Financing live
Cash to close
- Down payment
- $49,750
- Closing costs
- $5,970
- Reserves months
- —
- Total cash needed
- —
Loan-product check · same deal, 3 products live
Conventional
25% down · 7.5% · 30yr
- Down + closing
- —
- Monthly P&I
- —
- Monthly cashflow
- —
- DSCR
- —
- Eligible?
- —
Personal DTI + credit; lowest rate.
DSCR
20% down · 8.5% · 30yr
- Down + closing
- —
- Monthly P&I
- —
- Monthly cashflow
- —
- DSCR
- —
- Eligible?
- —
No personal income docs; deal must DSCR.
Hard money
10% down · 12.0% · 12mo
- Down + closing
- —
- Monthly P&I
- —
- Monthly cashflow
- —
- DSCR
- —
- Eligible?
- —
Short-term bridge; refi at stabilization.
Rent comps 40 comps
| Address | Beds | Baths | Sqft | Rent | $/sqft | DOM | Units | Dist |
|---|---|---|---|---|---|---|---|---|
| 368 Bridge Deck Loop Kyle, TX | 4.0 | 2.0 | 1777 | $2,095 | $1.18 | 14d | 1 | 0.39mi |
| 702 Nautical Loop Kyle, TX | 3.0 | 2.5 | 1720 | $1,990 | $1.16 | 43d | 1 | 0.48mi |
| 189 Tailwind Dr Kyle, TX | 3.0 | 2.0 | 1532 | $2,100 | $1.37 | 17d | 1 | 0.59mi |
| 220 Peppergrass Cv Kyle, TX | 3.0 | 2.5 | 1799 | $1,875 | $1.04 | 14d | 1 | 0.81mi |
| 180 Billowing Way Kyle, TX | 4.0 | 2.0 | 1610 | $2,100 | $1.30 | 17d | 1 | 0.81mi |
| 3700 Dacy Ln Kyle, TX | 2.0–4.0 | 2.0 | 1182 | $1,649 | $1.39 | 4d | 1 | 0.84mi |
| 356 Biscayne Bay Bnd Kyle, TX | 4.0 | 3.0 | 2209 | $2,600 | $1.18 | 17d | 1 | 0.86mi |
| 126 Shackleton Dr Kyle, TX | 3.0 | 2.0 | 1836 | $2,150 | $1.17 | 43d | 1 | 0.86mi |
| 172 Noddy Rd Buda, TX | 3.0 | 2.0 | 1416 | $2,000 | $1.41 | 17d | 1 | 0.88mi |
| 119 Peppergrass Cv Kyle, TX | 4.0 | 2.5 | 2101 | $2,050 | $0.98 | 4d | 1 | 0.90mi |
| 207 Dragon Ridge Rd Buda, TX | 3.0 | 2.0 | 1377 | $1,850 | $1.34 | 16d | 1 | 0.90mi |
| 182 Shackleton Dr Kyle, TX | 3.0 | 2.0 | 1527 | $2,150 | $1.41 | 43d | 1 | 0.92mi |
| 362 Limerick Rd Buda, TX | 3.0 | 2.0 | 1679 | $2,150 | $1.28 | 43d | 1 | 0.92mi |
| 235 Limerick Rd Buda, TX | 3.0 | 2.0 | 1680 | $1,995 | $1.19 | 43d | 1 | 0.93mi |
| 251 Triumph Rd Buda, TX | 3.0 | 2.5 | 1931 | $2,100 | $1.09 | 4d | 1 | 0.96mi |
| 416 Purple Martin Ave Kyle, TX | 3.0 | 2.0 | 1311 | $1,800 | $1.37 | 23d | 1 | 0.97mi |
| 232 Buttercup Way Kyle, TX | 3.0 | 2.0 | 1398 | $1,695 | $1.21 | 23d | 1 | 1.03mi |
| 1172 Shadow Creek Blvd Buda, TX | 3.0 | 2.5 | 1700 | $1,995 | $1.17 | 17d | 1 | 1.08mi |
| 230 Cherry Laurel Ln Kyle, TX | 4.0 | 2.0 | 1992 | $2,050 | $1.03 | 23d | 1 | 1.08mi |
| 184 Vestral Rd Buda, TX | 3.0 | 3.0 | 1688 | $2,059 | $1.22 | 16d | 1 | 1.08mi |
| 246 Blackborrow Dr Kyle, TX | 3.0 | 2.0 | 1593 | $2,100 | $1.32 | 43d | 1 | 1.10mi |
| 1216 Shadow Creek Blvd Buda, TX | 3.0 | 2.5 | 1700 | $1,800 | $1.06 | 17d | 1 | 1.12mi |
| 236 Black Frst Buda, TX | 3.0 | 2.5 | 1700 | $1,695 | $1.00 | 1d | 1 | 1.14mi |
| 130 Quarter Ave Buda, TX | 3.0 | 2.0 | 1304 | $1,750 | $1.34 | 14d | 1 | 1.14mi |
| 150 Jayden Dr Kyle, TX | 4.0 | 2.0 | 1796 | $2,000 | $1.11 | 17d | 1 | 1.16mi |
| 212 Corvid Dr Buda, TX | 3.0 | 2.0 | 1312 | $2,100 | $1.60 | 17d | 1 | 1.17mi |
| 535 Twisted Oaks Ln Buda, TX | 3.0 | 2.0 | 1312 | $1,700 | $1.30 | 10d | 1 | 1.18mi |
| 421 Jack Rabbit Ln Unit B Hays, TX | 3.0 | 2.0 | 1372 | $1,650 | $1.20 | 2d | 1 | 1.19mi |
| 587 Twisted Oaks Ln Buda, TX | 3.0 | 2.0 | 1312 | $1,850 | $1.41 | 4d | 1 | 1.21mi |
| 424 Jack Rabbit Ln Unit B Buda, TX | 3.0 | 2.0 | 1372 | $1,625 | $1.18 | 23d | 1 | 1.22mi |
| 479 Jack Rabbit Ln Unit A Buda, TX | 3.0 | 2.0 | 1372 | $1,699 | $1.24 | 21d | 1 | 1.24mi |
| 283 Carolina Buckthorn Dr Kyle, TX | 4.0 | 2.0 | 1840 | $2,200 | $1.20 | 43d | 1 | 1.29mi |
| 533 Jack Rabbit Ln Unit A Buda, TX | 3.0 | 2.0 | 1374 | $1,650 | $1.20 | 4d | 1 | 1.30mi |
| 216 Windmill Palm Dr Kyle, TX | 3.0 | 2.0 | 1521 | $1,900 | $1.25 | 16d | 1 | 1.33mi |
| 601 Jack Rabbit Ln Buda, TX | 3.0 | 2.0 | 1350 | $1,675 | $1.24 | 23d | 1 | 1.34mi |
| 155 Globe Mallow Cir Kyle, TX | 3.0 | 2.0 | 1611 | $2,200 | $1.37 | 19d | 1 | 1.35mi |
| 233 Joanne Loop Unit A Buda, TX | 3.0 | 2.0 | 1372 | $1,600 | $1.17 | 43d | 1 | 1.37mi |
| 245 Joanne Loop Unit B Buda, TX | 3.0 | 2.0 | 1374 | $1,595 | $1.16 | 23d | 1 | 1.37mi |
| 476 Suffield Dr Buda, TX | 1.0–4.0 | 1.0–4.0 | 1751 | $3,207 | $1.83 | 2d | 37 | 1.40mi |
| 308 Globe Mallow Cir Kyle, TX | 3.0 | 2.0 | 1521 | $1,990 | $1.31 | 43d | 1 | 1.42mi |
Listing history 20 events
-
2026-06-18days on market $199,000 Active 132 DOM
-
2026-06-17days on market $199,000 Active 131 DOM
-
2026-06-16days on market $199,000 Active 130 DOM
-
2026-06-15days on market $199,000 Active 129 DOM
-
2026-06-13pricedays on market $199,000 Active 127 DOM
-
2026-06-09days on market $199,999 Active 123 DOM
-
2026-06-08days on market $199,999 Active 122 DOM
-
2026-06-07days on market $199,999 Active 121 DOM
-
2026-06-05days on market $199,999 Active 118 DOM
-
2026-06-03days on market $199,999 Active 117 DOM
-
2026-06-02days on market $199,999 Active 116 DOM
-
2026-06-01days on market $199,999 Active 115 DOM
-
2026-05-31days on market $199,999 Active 114 DOM
-
2026-04-20price $210,000 264-char remark
Show marketing remark (264 chars)
CASH SALE ONLY SOLD AS IS-110 Belinda Lane is a double-wide manufactured home offering 4 bedrooms and 2 full bathrooms with a functional floor plan and defined living spaces suitable for everyday use. Conveniently located near shopping, dining, and major roadways.
-
2026-04-07price $239,900 264-char remark
Show marketing remark (264 chars)
CASH SALE ONLY SOLD AS IS-110 Belinda Lane is a double-wide manufactured home offering 4 bedrooms and 2 full bathrooms with a functional floor plan and defined living spaces suitable for everyday use. Conveniently located near shopping, dining, and major roadways.
-
2026-03-28price $249,900 264-char remark
Show marketing remark (264 chars)
CASH SALE ONLY SOLD AS IS-110 Belinda Lane is a double-wide manufactured home offering 4 bedrooms and 2 full bathrooms with a functional floor plan and defined living spaces suitable for everyday use. Conveniently located near shopping, dining, and major roadways.
-
2026-02-25price $249,990 264-char remark
Show marketing remark (264 chars)
CASH SALE ONLY SOLD AS IS-110 Belinda Lane is a double-wide manufactured home offering 4 bedrooms and 2 full bathrooms with a functional floor plan and defined living spaces suitable for everyday use. Conveniently located near shopping, dining, and major roadways.
-
2026-02-06$265,000 Active 264-char remark
Show marketing remark (264 chars)
CASH SALE ONLY SOLD AS IS-110 Belinda Lane is a double-wide manufactured home offering 4 bedrooms and 2 full bathrooms with a functional floor plan and defined living spaces suitable for everyday use. Conveniently located near shopping, dining, and major roadways.
-
2022-09-13price
-
2022-08-27Active
ⓘ Source: listings_history table (triggers on properties + properties_extension) + one-shot
backfill from property_details.listing_events for pre-trigger history.
Tax reassessment forecast TX · Resets to sale price
- Current annual tax
- $1,342 · $112/mo
- Projected year-2 tax
- $3,642 · $303/mo
- Expected delta
- +$2,300/yr (+$192/mo · 171.4%)
ⓘ Screening estimate from a state-policy table — verify with the county assessor before closing.
Climate risk First Street
- Flood 1/10 Low FEMA zone X (unshaded) · 0% chance over 30 yrs
- Wildfire 5/10 Major
- Heat 8/10 Severe 7 d/yr ≥108°F today · 22 d/yr by 30 yrs out
- Wind 8/10 Severe 80% chance of damaging wind over 30 yrs
- Air quality 1/10 Low 0 unhealthy d/yr today · 0 by 30 yrs out
Nearby sold comps map
Loading sold comps map…
Walkable amenities ~0.75 mi
Loading nearby amenities…
Taxation est. · year 1
- Rental income
- $24,937
- − Mortgage interest
- −$11,147
- − Property taxes
- −$1,342
- − Insurance
- −$995
- − Repairs & maintenance
- −$1,995
- − Management
- −$1,995
- − Depreciation
- −$5,789
- Taxable income
- $1,674
- Est. tax owed @ 24.0%
- −$402
- After-tax cash flow
- $4,439/yr
For passive investors: Depreciation is non-cash, so a rental often shows a tax loss while cash-flowing — sheltering income. Rental losses are passive: they offset passive income freely, and up to $25,000/yr can offset ordinary (W-2) income if you actively participate and your MAGI is under $100k (phasing out to $0 by $150k); unused losses carry forward. On sale, claimed depreciation is recaptured at up to 25%, and gains may owe capital-gains tax (a 1031 exchange can defer both). Figures are a year-1 estimate at your 24.0% rate — not tax advice; consult a CPA.
Schools (NCES district)
- District
- Hays CISD
- NCES district ID
- 4800010
- Math proficiency
- 35% ▼ -15.00%
- Reading proficiency
- 41% ▼ -5.00%
- Median HH income
- $70,570
- Composite
- 34.78/100
- National rank
- #5118
- State rank
- #390 of 826 in TX
Livability — Kyle
- Score
- 75/100
- State rank
- #138
- US rank
- #3993
Category grades
Schools grade is shown separately in the Schools card above.
Census & demographics
- County
- Hays County · 280,138 people
- City population
- 77,531
- Metro
- Austin-Round Rock-Georgetown, TX
- Population (ZIP)
- 77,531
- Household income
- $90,075
- Rent vs Own
- Severe rent burden
- 2552.0
Population outlook (Hays County) Hauer SSP2
- Today (2025)
- 286,948 people
- By 2030
- 336,923 · +17.4%
- By 2040
- 441,894 · +54.0%
- By 2050
- 553,462 · +92.9%
- By 2075
- 838,261 · +192.1%
- By 2100
- 1,063,658 · +270.7%
Race, ethnicity, and origin ACS 2023
- Neighborhood character
- Diverse neighborhood (Simpson 0.56)
- Race & ethnicity
- Hispanic / Latino 55% White 36% Two or more races 29% Black 5% Native American 1%
- Hispanic origin (detail)
- Mexican 47% Puerto Rican 1%
- Common ancestry
- Italian 2% Slovak 2% Lithuanian 1%
- Foreign-born
- 13% · Canada
- Languages at home
- 63% English-only · Spanish 35%
Political lean MEDSL · Hays
- 2024 margin
- Lean D (+5.7) · D 52.1% · R 46.5% · Other 1.4%
- 2008→2024 swing
- +7.7pp toward D · 2008: -2.0pp · 2024: 5.7pp
- All cycles
- 2024: D+5.7 2020: D+10.8 2016: R+0.9 2012: R+10.4 2008: R+2.0
Not yet ingested
- Civics
- —
Market trends
- HPI YoY
- ▼ -92.64%
- Current HPI
- 181.7969
- Rent YoY
- ▼ -0.34%
- Metro
- Austin-Round Rock-Georgetown, TX
- State GDP YoY
- ▲ 3.95%
- F500 in state
- 110
Industry mix (Fortune 500 HQ in TX)
| Industry | F500 HQs | Revenue |
|---|---|---|
| Energy | 16 | $1,198B |
|
||
| Technology | 5 | $198B |
|
||
| Engineering / Construction | 4 | $72B |
|
||
| Energy Services | 3 | $60B |
|
||
| Utilities | 3 | $41B |
|
||
| Healthcare | 2 | $330B |
|
||
Price history
-20.8% since first listed7 events — show timeline
- 2026-04-20 Price Changed $210,000 Unlock MLS
- 2026-04-07 Price Changed $239,900 Unlock MLS
- 2026-03-28 Price Changed $249,900 Unlock MLS
- 2026-02-25 Price Changed $249,990 Unlock MLS
- 2026-02-06 Listed $265,000 Unlock MLS
- 2022-09-13 Price Changed — Unlock MLS
- 2022-08-27 Listed — Unlock MLS
Property tax history
+3.6%/yrLatest (2025): $1,342 · +14.0% YoY. Source: county tax records.
Cash-flow waterfall
monthlySold comps — $/sqft
last 12 mo · ≤1 miLoading sold comps…