 🏗️ New Construction
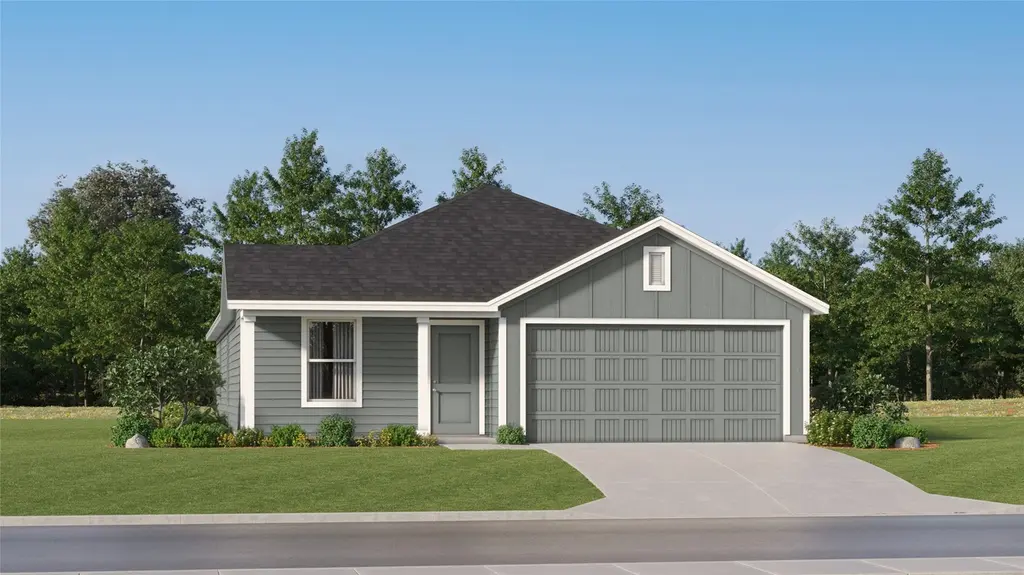
25616 Rose Creek Dr · Cleveland, TX
Flood risk No data
- FEMA flood zone
- —
- Chance of flooding over 30 yrs
- —
- Est. flood insurance / yr
- —
Fire risk No data
- Est. fire insurance / yr
- —
Heat risk No data
- Hot days now (above threshold)
- —
- Hot days in 30 yrs
- —
Wind risk No data
- Chance of severe wind over 30 yrs
- —
Air-quality risk No data
- Unhealthy air days now
- —
- Unhealthy air days in 30 yrs
- —
Risk factors via First Street. Map © Google.
Why this score? — see what drove the D- grade
The composite is a weighted blend of 9 inputs, each scored 0–100. Each bar is that input's sub-score; the figure is the points it added to the 100-point composite (weight × sub-score).
- Cash flow +12.4/30.0
- ARV discount +7.5/15.0
- DSCR +3.7/10.0
- Livability +3.1/5.0
- 1% rule +2.5/10.0
- Rent growth +2.5/5.0
- Schools +2.5/10.0
- Condition / age +2.5/5.0
- Appreciation +0.0/10.0
$199,990
🖨 Deal sheet (PDF) 📄 Offer letter ✓ Due diligence
Listing remarks
New Construction Lennar Houston Home - The Oxford Floor Plan - This single-level home showcases a spacious open floorplan shared between the kitchen, dining area and family room for easy entertaining. An owner’s suite enjoys a private location in a rear corner of the home, complemented by an en-suite bathroom and walk-in closet. There are three secondary bedrooms at the front of the home, which are comfortable spaces for household members and overnight guests. The completion date, prices and features may vary and are subject to change. Please verify with Lennar directly. Photos are for illustrative purposes only.
Key facts
- Walk-in closet
- Open floorplan
- En-suite bathroom
Tags
Property features AI
Finance
- HOA & community: Member of Pinewood Trail Homeowner association; Annual association fee of $372
Exterior
- Parking: Attached garage with 2 parking spaces
- Utilities: Public water; Public sewer
- Home design: Residential property; Under construction (new construction); Slab foundation
- Construction: Built in 2026; Cement siding; Composition roof
- Exterior features: Back yard fence
Interior
- Kitchen: Dishwasher; Electric oven; Electric range; Gas oven; Gas range
- Bedrooms: 6 total rooms (count includes all rooms)
- Flooring: Carpet; Vinyl
- Bathrooms: 2 full bathrooms
- Heating & cooling: Central heating (electric and gas); Central air conditioning (electric and gas)
- Interior features: Breakfast bar; Kitchen and family room combo; Kitchen and dining combo; Separate shower; Tub with shower
- Laundry & utility: Washer hookup; Electric dryer hookup; Gas dryer hookup
Neighborhood map
What this means for you Summary
Snapshot
- This is a 4-bed/2.0-bath land listed at $200k.
Deal economics
- At list price, monthly cash flow is $-39 ($-471/yr) — negative.
- The deal already cash-flows at list — no discount required.
- To meet the 1% rule (rent ≥ 1% of price), the offer needs to be $187k (6.6% below list).
- Recommended offer: $187k (6.6% below list) — sets the bar for 1% rule.
- Cap rate 6.1% vs local median 4.7% in Cleveland — top-decile yield for the area; either an underpriced asset or a hidden risk that comps aren't pricing in. Stress-test before assuming the spread holds.
Location & tenants
- Location reads 61/100 on livability (#1,013 in TX) — a middle-class / working-renter tenant base. Strengths: cost of living A+, housing A+; Watch: crime D-, amenities F, commute F.
- Splendora ISD (rural): math 25% / reading 31% proficiency, ranked #648 of 826 in TX (top 78%) — low school quality limits family demand, transient renter base, plan for 1-2y turnover.
- Zoned schools: Greenleaf El (math 28% / reading 25%, grade F, #2,927 of 4,322 statewide, top 68%, 797 students, 70% FRL); Splendora J H (math 28% / reading 42%, grade F, #842 of 1,662 statewide, top 51%, 774 students, 62% FRL); Splendora H S (math 18% / reading 38%, grade F, #1,170 of 1,632 statewide, top 72%, 1,344 students, 59% FRL).
- Market conditions: 339 active listings in the ZIP; 25 comparable units currently listed for rent nearby; rentals at typical pace (median 24d on market — plan ~3-4 weeks tenant-placement turnaround); 13,259 units permitted in Montgomery County in 2024 (1,402 in 5+ unit buildings).
- This rent runs 36% of the median local income ($62k/yr) — at the standard rent-burdened threshold; future hikes will face affordability resistance.
Forward outlook
- Local home prices are declining (-3.0%/yr); year-one equity from $2k of loan paydown is wiped out by about $7k of value loss. Plan a longer hold.
- Montgomery County population projected at +65% by 2050 — long-run rental-demand tailwind backs the buy-and-hold thesis.
Negotiation context
- It's been on market 46 days — a 3% lower offer ($194k) is reasonable based on typical stale-listing flexibility.
- 2 sale attempts with the ask held roughly flat each time — persistent listings suggest the price (not the market) is what's stuck; bring a comps-based counter.
Questions for the listing agent
- What do current leases actually rent for vs. the listed asking? Can we see a recent rent roll and the last 12 months of T-12 income?
- It's been on market 46 days. Have you received any prior offers? Is the seller open to a 7% concession, seller financing, or rate buy-down credit?
- What does the HOA fee cover, when was the last increase, and are there any pending special assessments or reserve-fund shortfalls?
- Is there a deadline driving the sale (1031 exchange, divorce, estate, relocation)? That informs how much negotiation room exists.
- Schools are F-rated, which usually means shorter tenancies and higher turnover. Who's the typical renter profile here, and what's been the actual vacancy rate?
- Crime grade is D in this area — have there been break-ins, vandalism, or insurance claims at this property in the last 3 years? What carrier currently insures it and at what premium?
- The area grade is low — what's the realistic commute time and amenity access for the typical tenant pool here? Any planned neighborhood developments (good or bad) we should know about?
- What's the average days-on-market for RENTAL listings here right now (not sales)? A rising rental-DOM trend means longer vacancies and softer asking-rent achievability than the comps imply.
- What's the recent tenant-quality profile in this submarket — average credit score on applications, eviction rate, late-payment / NSF rate, and stable-employment percentage? A property-management company in the area should have these aggregated.
- How much new for-sale + rental construction is in the pipeline within 1–3 miles? Heavy new supply typically softens prices + rents 12–24 months out; constrained supply supports both.
Investment metrics
- 1% rule
- 0.75% ✗
- Cap rate
- 6.10%
- Cash-on-cash
- -0.68%
- DSCR
- 0.97
- GRM
- 11.1
CMA / ARV
- ARV (median comp)
- $247,894
- List price
- $199,990
- Delta
- -19.32%
- Verdict
- UNDERPRICED
- Comps
- 20 within 1.0 mi
Projected returns pro-forma
-3.0% appreciation · 3.0% rent growth · sell at horizon
- IRR
- -17.5%
- Equity multiple
- 0.38×
- Total profit
- $-42,764
- Equity at exit
- $36,962
- IRR
- -9.6%
- Equity multiple
- 0.41×
- Total profit
- $-40,839
- Equity at exit
- $21,433
Cash invested: $69,410 (down + closing). Projections, not guarantees.
Landlord ↔ Tenant lean methodology
- Overall (STATE)
- 87 Strongly Landlord-Friendly
- State Texas
- 87 Strongly Landlord-Friendly · R+5
- County
- — inherits STATE
- City
- — inherits STATE
ZIP-level market 77328
- Home prices YoY
- -7.7%
- Active inventory
- 339
- Price-to-rent
- 8.9×
Monthly cashflow live
- Estimated rent
- $1,868 high interval (Pro) →
- Mortgage (P&I)
- −$1,300
- Tax from tax record
- −$81 /mo · $971/yr
- Insurance
- −$103
- HOA
- −$31
- Vacancy / Maint / Mgmt
- −$392
- Net cashflow
- $-39
Break-even live
Sensitivity live
| Price | -10% $101 | -5% $31 | +0% $-39 | +5% $-109 | +10% $-180 |
|---|---|---|---|---|---|
| Rent | -10% $-187 | -5% $-113 | +0% $-39 | +5% $35 | +10% $108 |
| Rate | -1.0pp $86 | -0.5pp $24 | base $-39 | +0.5pp $-104 | +1.0pp $-169 |
UW: 25.0% down · 7.5% · 30yr · 1.5% tax · 5.0% vac · 8.0% maint · 8.0% mgmt
Financing live
Cash to close
- Down payment
- $61,973
- Closing costs
- $7,437
- Reserves months
- —
- Total cash needed
- —
Loan-product check · same deal, 3 products live
Conventional
25% down · 7.5% · 30yr
- Down + closing
- —
- Monthly P&I
- —
- Monthly cashflow
- —
- DSCR
- —
- Eligible?
- —
Personal DTI + credit; lowest rate.
DSCR
20% down · 8.5% · 30yr
- Down + closing
- —
- Monthly P&I
- —
- Monthly cashflow
- —
- DSCR
- —
- Eligible?
- —
No personal income docs; deal must DSCR.
Hard money
10% down · 12.0% · 12mo
- Down + closing
- —
- Monthly P&I
- —
- Monthly cashflow
- —
- DSCR
- —
- Eligible?
- —
Short-term bridge; refi at stabilization.
Rent comps 25 comps
| Address | Beds | Baths | Sqft | Rent | $/sqft | DOM | Units | Dist |
|---|---|---|---|---|---|---|---|---|
| 25432 Birch Hill Dr Cleveland, TX | 4.0 | 2.0 | 1667 | $1,750 | $1.05 | 21d | 1 | 0.13mi |
| 25402 Cypress Bend Dr Cleveland, TX | 3.0 | 2.0 | 1570 | $1,595 | $1.02 | 26d | 1 | 0.13mi |
| 25397 Cypress Bend Dr Cleveland, TX | 3.0 | 2.0 | 1414 | $1,545 | $1.09 | 0d | 1 | 0.14mi |
| 25419 Birch Hill Dr Cleveland, TX | 4.0 | 2.0 | 1667 | $2,099 | $1.26 | 4d | 1 | 0.17mi |
| 25382 Cypress Bend Dr Cleveland, TX | 3.0 | 2.0 | 1414 | $1,545 | $1.09 | 0d | 1 | 0.18mi |
| 10519 Copper Ridge Dr Cleveland, TX | 3.0 | 2.0 | 1414 | $1,625 | $1.15 | 6d | 1 | 0.21mi |
| 25365 Cypress Bend Dr Cleveland, TX | 3.0 | 2.0 | 1414 | $1,545 | $1.09 | 45d | 1 | 0.22mi |
| 10475 Red Cardinal Dr Cleveland, TX | 3.0 | 2.0 | 1570 | $1,595 | $1.02 | 4d | 1 | 0.26mi |
| 10387 Red Cardinal Dr Cleveland, TX | 3.0 | 2.0 | 1076 | $1,830 | $1.70 | 45d | 1 | 0.27mi |
| 10487 Red Cardinal Dr Cleveland, TX | 4.0 | 2.5 | 2171 | $1,695 | $0.78 | 23d | 1 | 0.27mi |
| 10405 Sweetwater Creek Dr Cleveland, TX | 3.0 | 2.0 | 1658 | $1,595 | $0.96 | 3d | 1 | 0.29mi |
| 10659 Lost Maples Dr Cleveland, TX | 4.0 | 2.5 | 2171 | $1,695 | $0.78 | 23d | 1 | 0.30mi |
| 10490 Red Cardinal Dr Cleveland, TX | 3.0 | 2.0 | 1658 | $1,595 | $0.96 | 26d | 1 | 0.30mi |
| 10410 Sweetwater Creek Dr Cleveland, TX | 4.0 | 2.5 | 2171 | $1,695 | $0.78 | 25d | 1 | 0.32mi |
| 10414 Sweetwater Creek Dr Cleveland, TX | 3.0 | 2.0 | 1658 | $1,595 | $0.96 | 45d | 1 | 0.32mi |
| 10422 Sweetwater Creek Dr Cleveland, TX | 4.0 | 2.5 | 2171 | $1,695 | $0.78 | 0d | 1 | 0.33mi |
| 10457 Sweetwater Creek Dr Cleveland, TX | 4.0 | 2.5 | 2171 | $1,695 | $0.78 | 26d | 1 | 0.33mi |
| 10446 Sweetwater Creek Dr Cleveland, TX | 3.0 | 2.0 | 1414 | $1,625 | $1.15 | 0d | 1 | 0.34mi |
| 10454 Sweetwater Creek Dr Cleveland, TX | 3.0 | 2.0 | 1658 | $1,595 | $0.96 | 7d | 1 | 0.35mi |
| 10458 Sweetwater Creek Dr Cleveland, TX | 3.0 | 2.0 | 1570 | $1,595 | $1.02 | 22d | 1 | 0.36mi |
| 10462 Sweetwater Creek Dr Cleveland, TX | 3.0 | 2.0 | 1414 | $1,545 | $1.09 | 26d | 1 | 0.36mi |
| 25507 Greenwood Canyon Dr Cleveland, TX | 3.0–5.0 | 2.0–3.5 | 1950 | $2,320 | $1.19 | 0d | 1 | 0.37mi |
| 10474 Sweetwater Creek Dr Cleveland, TX | 3.0 | 2.0 | 1414 | $1,545 | $1.09 | 26d | 1 | 0.37mi |
| 10478 Sweetwater Creek Dr Cleveland, TX | 3.0 | 2.0 | 1658 | $1,595 | $0.96 | 26d | 1 | 0.37mi |
| 10506 Sweetwater Creek Dr Cleveland, TX | 3.0 | 2.0 | 1414 | $1,545 | $1.09 | 26d | 1 | 0.40mi |
HOA detail
- Monthly dues
- $31 · $372/yr
Listing history 22 events
-
2026-06-21days on market $199,990 Active 46 DOM
-
2026-06-18remarks 620-char remark
-
2026-06-18days on market $199,990 Active 43 DOM
-
2026-06-17days on market $199,990 Active 42 DOM
-
2026-06-16days on market $199,990 Active 41 DOM
-
2026-06-15days on market $199,990 Active 40 DOM
-
2026-06-13days on market $199,990 Active 38 DOM
-
2026-06-13days on market $199,990 Active 37 DOM
-
2026-06-09days on market $199,990 Active 34 DOM
-
2026-06-08days on market $199,990 Active 33 DOM
-
2026-06-07days on market $199,990 Active 32 DOM
-
2026-06-04days on market $199,990 Active 29 DOM
-
2026-06-03days on market $199,990 Active 28 DOM
-
2026-06-02days on market $199,990 Active 27 DOM
-
2026-06-01days on market $199,990 Active 26 DOM
-
2026-05-31days on market $199,990 Active 25 DOM
-
2026-05-07price $199,990 587-char remark
-
2026-05-06$194,990 Active 587-char remark
-
2026-02-24historical
-
2025-12-15price $205,990
-
2025-10-13price $210,000
-
2025-10-13$273,990 Active
ⓘ Source: listings_history table (triggers on properties + properties_extension) + one-shot
backfill from property_details.listing_events for pre-trigger history.
Tax reassessment forecast TX · Resets to sale price
- Current annual tax
- $971 · $81/mo
- Projected year-2 tax
- $3,660 · $305/mo
- Expected delta
- +$2,688/yr (+$224/mo · 276.8%)
ⓘ Screening estimate from a state-policy table — verify with the county assessor before closing.
Nearby sold comps map
Loading sold comps map…
Walkable amenities ~0.75 mi
Loading nearby amenities…
Taxation est. · year 1
- Rental income
- $22,419
- − Mortgage interest
- −$13,886
- − Property taxes
- −$971
- − Insurance
- −$1,239
- − Repairs & maintenance
- −$1,794
- − Management
- −$1,794
- − HOA
- −$372
- − Depreciation
- −$7,211
- Taxable loss
- −$4,848
- Est. tax savings @ 24.0%
- +$1,163
- After-tax cash flow
- $692/yr
For passive investors: Depreciation is non-cash, so a rental often shows a tax loss while cash-flowing — sheltering income. Rental losses are passive: they offset passive income freely, and up to $25,000/yr can offset ordinary (W-2) income if you actively participate and your MAGI is under $100k (phasing out to $0 by $150k); unused losses carry forward. On sale, claimed depreciation is recaptured at up to 25%, and gains may owe capital-gains tax (a 1031 exchange can defer both). Figures are a year-1 estimate at your 24.0% rate — not tax advice; consult a CPA.
Schools (NCES district)
- District
- Splendora ISD
- NCES district ID
- 4841070
- Math proficiency
- 25% ▼ -8.00%
- Reading proficiency
- 31% ▼ -1.00%
- Median HH income
- $54,166
- Composite
- 24.92/100
- National rank
- #7572
- State rank
- #648 of 826 in TX
Livability — Cleveland
- Score
- 61/100
- State rank
- #1013
- US rank
- #17943
Category grades
Schools grade is shown separately in the Schools card above.
Census & demographics
- Census place
- Cleveland, TX
- County
- San Jacinto County · 17,208 people
- City population
- 17,208
- Metro
- Houston-The Woodlands-Sugar Land, TX
- Population (ZIP)
- 17,208
- Household income
- $62,428
- Rent vs Own
- Severe rent burden
- 58.0
Population outlook (Montgomery County) Hauer SSP2
- Today (2025)
- 713,896 people
- By 2030
- 805,263 · +12.8%
- By 2040
- 992,708 · +39.1%
- By 2050
- 1,179,590 · +65.2%
- By 2075
- 1,628,084 · +128.1%
- By 2100
- 1,937,880 · +171.5%
Race, ethnicity, and origin ACS 2023
- Neighborhood character
- Majority White (61%)
- Race & ethnicity
- White 61% Hispanic / Latino 33% Two or more races 14% Black 2%
- Hispanic origin (detail)
- Mexican 27% Cuban 1%
- Common ancestry
- Lithuanian 4% Italian 3% Serbian 3%
- Foreign-born
- 18% · Canada, China
- Languages at home
- 67% English-only · Spanish 31% Chinese 1%
Political lean MEDSL · Montgomery
- 2024 margin
- Solid R (+45.5) · D 26.8% · R 72.3%
- 2008→2024 swing
- +7.2pp toward D · 2008: -52.7pp · 2024: -45.5pp
- All cycles
- 2024: R+45.5 2020: R+43.8 2016: R+51.4 2012: R+60.7 2008: R+52.7
Not yet ingested
- Civics
- —
Market trends
- HPI YoY
- ▼ -22.82%
- Current HPI
- 273.6604
- Rent YoY
- —
- Metro
- Houston-The Woodlands-Sugar Land, TX
- State GDP YoY
- ▲ 3.95%
- F500 in state
- 110
Industry mix (Fortune 500 HQ in TX)
| Industry | F500 HQs | Revenue |
|---|---|---|
| Energy | 16 | $1,198B |
|
||
| Technology | 5 | $198B |
|
||
| Engineering / Construction | 4 | $72B |
|
||
| Energy Services | 3 | $60B |
|
||
| Utilities | 3 | $41B |
|
||
| Healthcare | 2 | $330B |
|
||
Price history
-27.0% since first listed6 events — show timeline
- 2026-05-07 Price Changed $199,990 HARMLS
- 2026-05-06 Listed $194,990 HARMLS
- 2026-02-24 Listing Removed — HARMLS
- 2025-12-15 Price Changed $205,990 HARMLS
- 2025-10-13 Price Changed $210,000 HARMLS
- 2025-10-13 Listed $273,990 HARMLS
Property tax history
-4.2%/yrLatest (2025): $971 · -4.2% YoY. Source: county tax records.
Cash-flow waterfall
monthlySold comps — $/sqft
last 12 mo · ≤1 miLoading sold comps…