 🏷️ Likely Rental
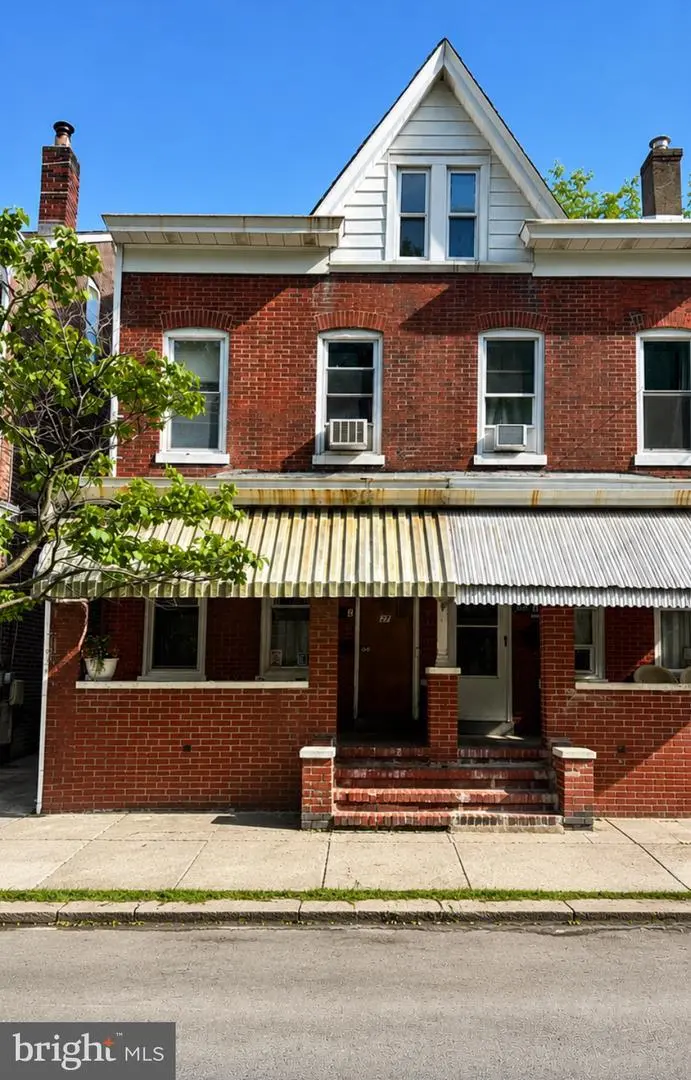
27 Kent St · Trenton, NJ
Flood risk 1/10 · Minimal
- FEMA flood zone
- X (unshaded)
- Chance of flooding over 30 yrs
- 0.0%
- Est. flood insurance / yr
- $507 – $1,088
Fire risk 1/10 · Minimal
- Est. fire insurance / yr
- $526 – $976
Heat risk 7/10 · Major
- Hot days now (above 102°F)
- 7 days/yr
- Hot days in 30 yrs
- 15 days/yr
Wind risk 6/10 · Moderate
- Chance of severe wind over 30 yrs
- 27.0%
Air-quality risk 5/10 · Moderate
- Unhealthy air days now
- 6 days/yr
- Unhealthy air days in 30 yrs
- 8 days/yr
Risk factors via First Street. Map © Google.
Why this score? — see what drove the C- grade
The composite is a weighted blend of 9 inputs, each scored 0–100. Each bar is that input's sub-score; the figure is the points it added to the 100-point composite (weight × sub-score).
- Cash flow +16.1/30.0
- ARV discount +15.0/15.0
- DSCR +5.0/10.0
- 1% rule +4.8/10.0
- Livability +3.8/5.0
- Rent growth +3.7/5.0
- Condition / age +2.5/5.0
- Schools +0.7/10.0
- Appreciation +0.0/10.0
$249,999
🖨 Deal sheet (PDF) 📄 Offer letter ✓ Due diligence
Listing remarks MLS
Updated 2-family brick home just waiting for the savvy home buyer who wants to live mortgage free. Live in one unit and rent the other or investor looking to add to their portfolio. Fully rented with current tenants wanting to stay is possible. Both units are on month-to-month so you have the option to set your own price. Current rents are under market value. 1st Floor 1 - 2 bedrooms/1 bath large rooms, hardwood floors new kitchen floor and updated bathroom Rent: $850.00 2nd Floor 2 bedrooms/1 bath hardwood floors, large eat-in kitchen with lots of cabinets and new floor Rent: $900.00
Key facts
- 1,680 sq ft lot
- Built 1901
- Listed 6 days
Property features AI
Finance
- Other: Estimated above-grade finished area
- Financial info: Month-to-month existing lease; Two total units (1 vacant, 1 leased); One unit month-to-month
Exterior
- Parking: On-street parking
- Utilities: Public water; Public sewer; Electric available; Natural gas available; Cable TV available; Phone available
- Home design: Semi-detached property; 3 stories; Fee simple ownership; Very good condition; Major renovation in 2021 (effective year); Brick construction
- Construction: Brick/mortar foundation; Shingle roof; Above-grade and below-grade structures
- Exterior features: Exterior lighting; Sidewalks; Street lights; Rear yard
Interior
- Kitchen: Refrigerator; Stove
- Bedrooms: One 1-bedroom unit; Two 2-bedroom units
- Flooring: Wood flooring; Tile or brick flooring; Vinyl flooring
- Heating & cooling: Radiator heat; Natural gas heating; Natural gas hot water
- Interior features: Estimated living area; Unfinished basement
Neighborhood map
What this means for you Summary
Snapshot
- This is a 4-bed/?-bath single-family listed at $250k.
Deal economics
- At list price, monthly cash flow is $127 ($2k/yr) — positive.
- The deal already cash-flows at list — no discount required.
- To meet the 1% rule (rent ≥ 1% of price), the offer needs to be $245k (1.8% below list).
- Recommended offer: $245k (1.8% below list) — sets the bar for 1% rule.
Location & tenants
- Location reads 76/100 on livability (#133 in NJ, #3,533 nationally) — a middle-class / working-renter tenant base. Strengths: amenities A+, commute A+, health & safety A+; Watch: crime F, employment F.
- Trenton Public School District (urban): math 2% / reading 16% proficiency, ranked #471 of 472 in NJ (top 100%) — low school quality limits family demand, transient renter base, plan for 1-2y turnover; 80% free/reduced lunch — lower-income household profile, screen leases tightly.
- Zoned schools: Washington Elementary School (math 0% / reading 11%, grade F, #1,291 of 1,303 statewide, top 99%, 289 students, 65% FRL); Dunn Middle School (math 2% / reading 19%, grade F, #424 of 431 statewide, top 98%, 670 students, 60% FRL); Trenton Central High School - Main Campus (math 2% / reading 10%, grade F, #396 of 399 statewide, top 99%, 2,255 students, 56% FRL) — zoned schools average 60% FRL vs 80% district-wide (20 pts lower); this property's tenant base skews higher-income than the district average.
- Market conditions: Rents rising fast (+4.7%/yr); 84 active listings in the ZIP; 23 comparable units currently listed for rent nearby; rentals at typical pace (median 23d on market — plan ~3-4 weeks tenant-placement turnaround); 2,256 units permitted in Mercer County in 2024 (1,303 in 5+ unit buildings).
- At $2,454/mo this rent would consume 52% of the median local household income ($57k/yr) (locally 2147% of renters already pay >50% of income on rent) — very limited rent-growth headroom before tenants either downsize or default.
Forward outlook
- Local home prices are declining (-3.0%/yr); year-one equity from $2k of loan paydown is wiped out by about $8k of value loss. Plan a longer hold.
- Mercer County population projected at +4% by 2050 — modest demand growth; plan on rents tracking national, not racing it.
Negotiation context
- Only 6 days on market — expect competitive offers; lowballing is unlikely to land.
- 3 sale attempts since 27y ago with the ask held roughly flat each time — persistent listings suggest the price (not the market) is what's stuck; bring a comps-based counter.
- Current owner paid $190k; 32% above their basis — modest negotiation headroom, anchor on the comps not their cost.
Risks & watch-outs
- Watch-outs: built in 1901 — expect roof / HVAC / electrical / plumbing capex.
- Climate carrying-cost: major wind risk, 27% chance of damaging wind over 30y; extreme-heat days projected 7→15/yr by 2055 (HVAC capex compounding) — expect insurance premiums to compound above CPI over the hold.
Questions for the listing agent
- Built in 1901 — when were the roof, HVAC, electrical panel, plumbing, and water heater last replaced?
- Is there a deadline driving the sale (1031 exchange, divorce, estate, relocation)? That informs how much negotiation room exists.
- Schools are F-rated, which usually means shorter tenancies and higher turnover. Who's the typical renter profile here, and what's been the actual vacancy rate?
- Crime grade is F in this area — have there been break-ins, vandalism, or insurance claims at this property in the last 3 years? What carrier currently insures it and at what premium?
- What's the average days-on-market for RENTAL listings here right now (not sales)? A rising rental-DOM trend means longer vacancies and softer asking-rent achievability than the comps imply.
- What's the recent tenant-quality profile in this submarket — average credit score on applications, eviction rate, late-payment / NSF rate, and stable-employment percentage? A property-management company in the area should have these aggregated.
- How much new for-sale + rental construction is in the pipeline within 1–3 miles? Heavy new supply typically softens prices + rents 12–24 months out; constrained supply supports both.
Investment metrics
- 1% rule
- 0.98% ✗
- Cap rate
- 6.90%
- Cash-on-cash
- 2.17%
- DSCR
- 1.10
- GRM
- 8.5
CMA / ARV
- ARV (on-the-fly)
- $344,528
- Comps found
- 12
Show comp detail 12 sales within ~0.75 mi
| Address | Dist | Beds/Ba | Sqft | Sold | Price | $/sf | Match |
|---|---|---|---|---|---|---|---|
| 156 Kent St | 0.13mi | 3/1.0 (-1) | 1,470 (+4%) | 0mo | $208,000 | $141 | 78 |
| 825 Lyndale Ave | 0.60mi | 4/1.5 | 1,443 (+2%) | 1mo | $360,000 | $249 | 61 |
| 307 Commonwealth Ave | 0.34mi | 3/1.0 (-1) | 1,480 (+5%) | 8mo | $275,000 | $186 | 61 |
| 326 Tindall Ave | 0.67mi | 3/1.0 (-1) | 1,411 (-0%) | 2mo | $365,000 | $259 | 58 |
| 877 Park Ave | 0.68mi | 3/2.0 (-1) | 1,406 (-0%) | 7mo | $320,000 | $228 | 49 |
| 1521 S Clinton Ave | 0.73mi | 4/1.5 | 1,348 (-4%) | 6mo | $208,000 | $154 | 48 |
| 1040 Melrose Ave | 0.64mi | 3/1.0 (-1) | 1,344 (-5%) | 7mo | $225,000 | $167 | 48 |
| 121 Hutchinson St | 0.62mi | 3/1.0 (-1) | 1,344 (-5%) | 11mo | $376,000 | $280 | 45 |
| 323 Hutchinson St | 0.72mi | 4/2.0 | 1,521 (+8%) | 9mo | $419,500 | $276 | 38 |
| 1027 Chambers St | 0.49mi | 3/1.5 (-1) | 1,246 (-12%) | 11mo | $205,000 | $165 | 38 |
| 872 Revere Ave | 0.48mi | 3/1.0 (-1) | 1,200 (-15%) | 8mo | $293,000 | $244 | 37 |
| 206 E Franklin St | 0.67mi | 3/2.5 (-1) | 1,584 (+12%) | 8mo | $395,000 | $249 | 27 |
Match score weights: distance 35% · size 25% · config 20% · recency 20%. Top-matched comps best support the ARV.
Projected returns pro-forma
-3.0% appreciation · 4.71% rent growth · sell at horizon
- IRR
- -10.8%
- Equity multiple
- 0.60×
- Total profit
- $-28,064
- Equity at exit
- $37,276
- IRR
- 0.9%
- Equity multiple
- 1.07×
- Total profit
- $4,554
- Equity at exit
- $21,615
Cash invested: $70,000 (down + closing). Projections, not guarantees.
Landlord ↔ Tenant lean methodology
- Overall (STATE)
- 21 Tenant-Leaning
- State New Jersey
- 21 Tenant-Leaning · D+6
- County
- — inherits STATE
- City
- — inherits STATE
ZIP-level market 08611
- Rents YoY
- 4.7%
- Active inventory
- 84
- Price-to-rent
- 8.5×
Monthly cashflow live
- Estimated rent
- $2,454 high interval (Pro) →
- Mortgage (P&I)
- −$1,311
- Tax from tax record
- −$397 /mo · $4,765/yr
- Insurance
- −$104
- HOA
- −$0
- Vacancy / Maint / Mgmt
- −$515
- Net cashflow
- $127
Break-even live
Sensitivity live
| Price | -10% $268 | -5% $197 | +0% $127 | +5% $56 | +10% $-15 |
|---|---|---|---|---|---|
| Rent | -10% $-67 | -5% $30 | +0% $127 | +5% $224 | +10% $320 |
| Rate | -1.0pp $252 | -0.5pp $190 | base $127 | +0.5pp $62 | +1.0pp $-4 |
UW: 25.0% down · 7.5% · 30yr · 1.5% tax · 5.0% vac · 8.0% maint · 8.0% mgmt
Financing live
Cash to close
- Down payment
- $62,500
- Closing costs
- $7,500
- Reserves months
- —
- Total cash needed
- —
Loan-product check · same deal, 3 products live
Conventional
25% down · 7.5% · 30yr
- Down + closing
- —
- Monthly P&I
- —
- Monthly cashflow
- —
- DSCR
- —
- Eligible?
- —
Personal DTI + credit; lowest rate.
DSCR
20% down · 8.5% · 30yr
- Down + closing
- —
- Monthly P&I
- —
- Monthly cashflow
- —
- DSCR
- —
- Eligible?
- —
No personal income docs; deal must DSCR.
Hard money
10% down · 12.0% · 12mo
- Down + closing
- —
- Monthly P&I
- —
- Monthly cashflow
- —
- DSCR
- —
- Eligible?
- —
Short-term bridge; refi at stabilization.
Rent comps 23 comps
| Address | Beds | Baths | Sqft | Rent | $/sqft | DOM | Units | Dist |
|---|---|---|---|---|---|---|---|---|
| 635 Chambers St Trenton, NJ | 4.0 | 2.0 | 1312 | $2,500 | $1.91 | 15d | 1 | 0.24mi |
| 121 Columbus Ave Trenton, NJ | 3.0 | 1.0 | 1050 | $1,900 | $1.81 | 23d | 1 | 0.37mi |
| 705 Anderson St Trenton, NJ | 3.0 | 1.0 | 1132 | $1,800 | $1.59 | 15d | 1 | 0.47mi |
| 234 Walnut Ave Trenton, NJ | 4.0 | 1.0 | 1480 | $2,200 | $1.49 | 23d | 1 | 0.58mi |
| 1103 Division St Trenton, NJ | 4.0 | 1.0 | 1296 | $2,000 | $1.54 | 23d | 1 | 0.59mi |
| 239 Ardmore Ave Trenton, NJ | 4.0 | 2.0 | 1665 | $2,750 | $1.65 | 23d | 1 | 0.64mi |
| 417 Walnut Ave Trenton, NJ | 3.0 | 1.0 | 992 | $2,050 | $2.07 | 23d | 1 | 0.72mi |
| 234 Howell St Trenton, NJ | 3.0 | 3.0 | 1656 | $3,600 | $2.17 | 23d | 1 | 0.75mi |
| 313 Home Ave Trenton, NJ | 3.0 | 1.0 | 1112 | $2,100 | $1.89 | 15d | 1 | 0.77mi |
| 1049 Genesee St Trenton, NJ | 3.0 | 1.0 | 1270 | $2,300 | $1.81 | 23d | 1 | 0.87mi |
| 42 Grant St Trenton, NJ | 4.0 | 1.0 | 1000 | $2,000 | $2.00 | 15d | 1 | 0.88mi |
| 1132 Genesee St Unit 1132 Trenton, NJ | 3.0 | 1.0 | 1198 | $2,500 | $2.09 | 23d | 1 | 0.91mi |
| 233 Virginia Ave Trenton, NJ | 3.0 | 1.0 | 1302 | $2,500 | $1.92 | 14d | 1 | 0.91mi |
| 1165 E State St Trenton, NJ | 3.0 | 1.0 | 900 | $1,749 | $1.94 | 15d | 1 | 0.92mi |
| 244 Jersey St Trenton, NJ | 3.0 | 1.5 | 1368 | $2,300 | $1.68 | 15d | 1 | 0.93mi |
| 428 Cleveland Ave Trenton, NJ | 4.0 | 2.0 | 1400 | $2,500 | $1.79 | 23d | 1 | 0.94mi |
| 547 Centre St Trenton, NJ | 3.0 | 1.0 | 1060 | $1,850 | $1.75 | 23d | 1 | 0.94mi |
| 125 Olive St Trenton, NJ | 2.0–3.0 | 1.0–1.5 | 896 | $1,392 | $1.55 | 23d | 1 | 1.02mi |
| 219 Woodlawn Ave Trenton, NJ | 3.0 | 1.0 | 1456 | $2,355 | $1.62 | 15d | 1 | 1.08mi |
| 134 Old Rose St Trenton, NJ | 4.0 | 2.0 | 1212 | $2,300 | $1.90 | 23d | 1 | 1.19mi |
| 340 Connecticut Ave Unit 2 Hamilton Township, NJ | 3.0 | 1.0 | 1400 | $2,850 | $2.04 | 15d | 1 | 1.21mi |
| 21 Bellevue Ave Trenton, NJ | 3.0 | 2.0 | 1740 | $2,400 | $1.38 | 45d | 1 | 1.41mi |
| 117 Park Ave Morrisville, PA | 3.0 | 2.0 | 1396 | $3,200 | $2.29 | 14d | 1 | 1.42mi |
Listing history 7 events
-
2026-06-18status $249,999 Pending 6 DOM
-
2026-06-14status $249,999 Active Under Contract 6 DOM
-
2026-06-10days on market $249,999 Active 6 DOM
-
2026-06-09days on market $249,999 Active 5 DOM
-
2026-06-08days on market $249,999 Active 4 DOM
-
2026-06-07remarks 693-char remark
-
2026-06-07$249,999 Active 3 DOM
ⓘ Source: listings_history table (triggers on properties + properties_extension) + one-shot
backfill from property_details.listing_events for pre-trigger history.
Tax reassessment forecast NJ · Partial reset (capped growth)
- Current annual tax
- $4,765 · $397/mo
- Projected year-2 tax
- $5,495 · $458/mo
- Expected delta
- +$730/yr (+$61/mo · 15.3%)
ⓘ Screening estimate from a state-policy table — verify with the county assessor before closing.
Climate risk First Street
- Flood 1/10 Low FEMA zone X (unshaded) · 0% chance over 30 yrs
- Wildfire 1/10 Low
- Heat 7/10 Severe 7 d/yr ≥102°F today · 15 d/yr by 30 yrs out
- Wind 6/10 Major 27% chance of damaging wind over 30 yrs
- Air quality 5/10 Major 6 unhealthy d/yr today · 8 by 30 yrs out
Nearby sold comps map
Loading sold comps map…
Walkable amenities ~0.75 mi
Loading nearby amenities…
Taxation est. · year 1
- Rental income
- $29,451
- − Mortgage interest
- −$14,004
- − Property taxes
- −$4,765
- − Insurance
- −$1,250
- − Repairs & maintenance
- −$2,356
- − Management
- −$2,356
- − Depreciation
- −$7,273
- Taxable loss
- −$2,553
- Est. tax savings @ 24.0%
- +$613
- After-tax cash flow
- $2,132/yr
For passive investors: Depreciation is non-cash, so a rental often shows a tax loss while cash-flowing — sheltering income. Rental losses are passive: they offset passive income freely, and up to $25,000/yr can offset ordinary (W-2) income if you actively participate and your MAGI is under $100k (phasing out to $0 by $150k); unused losses carry forward. On sale, claimed depreciation is recaptured at up to 25%, and gains may owe capital-gains tax (a 1031 exchange can defer both). Figures are a year-1 estimate at your 24.0% rate — not tax advice; consult a CPA.
Schools (NCES district)
- District
- Trenton Public School District
- NCES district ID
- 3416290
- Math proficiency
- 2% ▼ -8.00%
- Reading proficiency
- 16% ▼ -4.00%
- Median HH income
- $35,078
- Composite
- 7.31/100
- National rank
- #9956
- State rank
- #471 of 472 in NJ
Livability — Trenton
- Score
- 76/100
- State rank
- #133
- US rank
- #3533
Category grades
Schools grade is shown separately in the Schools card above.
Census & demographics
- Census place
- Trenton, NJ
- County
- Mercer County · 327,655 people
- City population
- 177,819
- Metro
- Trenton-Princeton, NJ
- Population (ZIP)
- 31,995
- Household income
- $56,788
- Rent vs Own
- Severe rent burden
- 2147.0
Population outlook (Mercer County) Hauer SSP2
- Today (2025)
- 381,395 people
- By 2030
- 384,640 · +0.9%
- By 2040
- 391,431 · +2.6%
- By 2050
- 397,845 · +4.3%
- By 2075
- 417,281 · +9.4%
- By 2100
- 420,327 · +10.2%
Race, ethnicity, and origin ACS 2023
- Neighborhood character
- Diverse neighborhood (Simpson 0.56)
- Race & ethnicity
- Hispanic / Latino 62% Black 20% Two or more races 18% White 14% Native American 4%
- Hispanic origin (detail)
- Mexican 2% Puerto Rican 12% Dominican 8%
- Common ancestry
- Romanian 2% Swiss 1% Hispanic 1%
- Foreign-born
- 37% · Canada, Jamaica, Guatemala
- Languages at home
- 41% English-only · Spanish 57% French/Haitian/Cajun 2%
Political lean MEDSL · Mercer
- 2024 margin
- Solid D (+33.9) · D 65.9% · R 32.0% · Other 2.1%
- 2008→2024 swing
- -2.2pp toward R · 2008: 36.1pp · 2024: 33.9pp
- All cycles
- 2024: D+33.9 2020: D+40.0 2016: D+36.2 2012: D+36.8 2008: D+36.1
Not yet ingested
- Civics
- —
Market trends
- HPI YoY
- ▼ -267.62%
- Current HPI
- 276.5427
- Rent YoY
- ▲ 4.71%
- Metro
- Trenton-Princeton, NJ
- State GDP YoY
- ▲ 2.05%
- F500 in state
- 34
Industry mix (Fortune 500 HQ in NJ)
| Industry | F500 HQs | Revenue |
|---|---|---|
| Consumer Goods | 3 | $31B |
|
||
| Pharmaceuticals | 2 | $153B |
|
||
| Technology | 2 | $21B |
|
||
| Insurance | 2 | $20B |
|
||
| Healthcare | 2 | $19B |
|
||
| Financial Services | 1 | $70B |
|
||
Price history
+290.6% since first listed12 events — show timeline
- 2026-06-05 Listed $249,999 BRIGHT MLS
- 2026-06-03 Coming Soon $249,999 BRIGHT MLS
- 2023-01-13 Sold (Public Records) $190,000 Public Records
- 2022-12-16 Sold (MLS) $190,000 BRIGHT MLS
- 2022-12-02 Contingent — BRIGHT MLS
- 2022-09-20 Price Changed $195,777 BRIGHT MLS
- 2022-08-30 Listed $205,777 BRIGHT MLS
- 2001-01-06 Sold (Public Records) $65,000 Public Records
- 2000-02-07 Sold (Public Records) $64,000 Public Records
- 2000-01-24 Sold (MLS) $64,000 BRIGHT MLS
- 1999-11-23 Listing Removed — BRIGHT MLS
- 1999-10-21 Listed $64,000 BRIGHT MLS
Property tax history
+2.5%/yrLatest (2025): $4,765 · +1.5% YoY. Source: county tax records.
Cash-flow waterfall
monthlySold comps — $/sqft
last 12 mo · ≤1 miLoading sold comps…