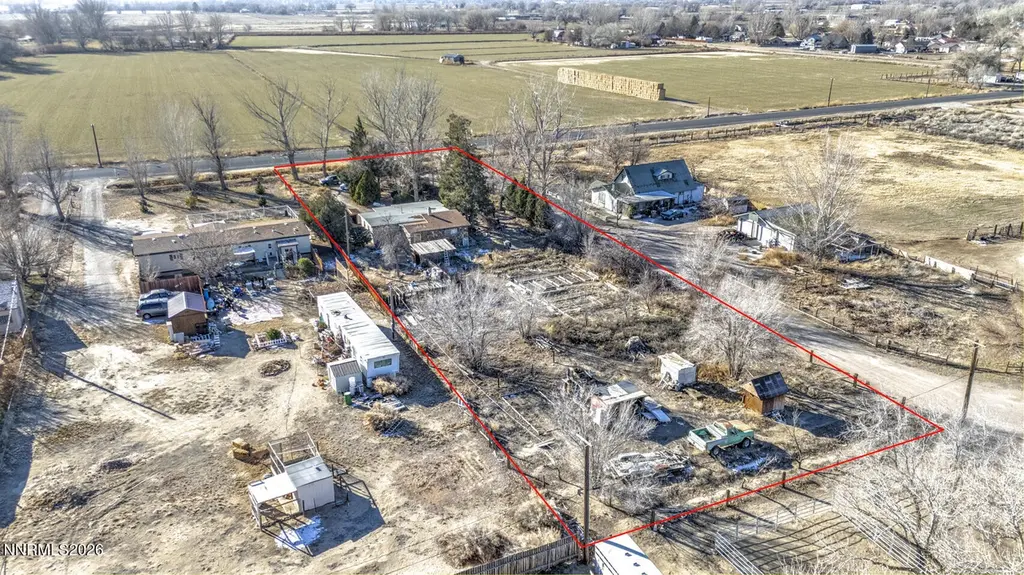
3780 Alcorn Rd · Fallon, NV
Flood risk 1/10 · Minimal
- FEMA flood zone
- X (shaded)
- Chance of flooding over 30 yrs
- 0.0%
- Est. flood insurance / yr
- $507 – $1,088
Fire risk 3/10 · Minor
- Est. fire insurance / yr
- $490 – $910
Heat risk 5/10 · Moderate
- Hot days now (above 95°F)
- 7 days/yr
- Hot days in 30 yrs
- 19 days/yr
Wind risk 1/10 · Minimal
- Chance of severe wind over 30 yrs
- —
Air-quality risk 8/10 · Major
- Unhealthy air days now
- 16 days/yr
- Unhealthy air days in 30 yrs
- 17 days/yr
Risk factors via First Street. Map © Google.
Why this score? — see what drove the D grade
The composite is a weighted blend of 9 inputs, each scored 0–100. Each bar is that input's sub-score; the figure is the points it added to the 100-point composite (weight × sub-score).
- ARV discount +15.0/15.0
- Cash flow +10.1/30.0
- Livability +3.6/5.0
- DSCR +2.9/10.0
- Schools +2.7/10.0
- Rent growth +2.5/5.0
- Condition / age +2.5/5.0
- 1% rule +2.0/10.0
- Appreciation +0.0/10.0
$250,000
🖨 Deal sheet (PDF) 📄 Offer letter ✓ Due diligence
Listing remarks MLS
GREAT WATER RIGHTED PROPERTY WITH POTENTIAL. This property features a 3-bedroom, 1-bathroom, 1480-square-foot stick-built home. Mature trees and lots of room to build a shop/garage. Bring all your ideas and make this fixer-upper your dream home.
Key facts
- Room to build
- Mature trees
- 1.2 acre lot
Tags
Neighborhood map
What this means for you Summary
Snapshot
- This is a 3-bed/1.0-bath single-family listed at $250k.
Deal economics
- At list price, monthly cash flow is $-148 ($-2k/yr) — negative.
- To cash-flow at today's rent, offer at most $224k (10.4% below list).
- To meet the 1% rule (rent ≥ 1% of price), the offer needs to be $174k (30.4% below list).
- Recommended offer: $174k (30.4% below list) — sets the bar for 1% rule.
- Cap rate 5.6% vs local median 3.1% in Fallon — top-decile yield for the area; either an underpriced asset or a hidden risk that comps aren't pricing in. Stress-test before assuming the spread holds.
Location & tenants
- Location reads 71/100 on livability (#24 in NV) — a middle-class / working-renter tenant base. Strengths: cost of living A+, housing A+, crime B+; Watch: employment C-, amenities F, commute F.
- Churchill County School District (town): math 21% / reading 41% proficiency, ranked #10 of 17 in NV (top 59%) — families likely to look elsewhere, expect single-tenant / working-renter base with shorter leases.
- Market conditions: 151 active listings in the ZIP; solid renter incomes; 45 units permitted in Churchill County in 2024 (0 in 5+ unit buildings).
Forward outlook
- Local home prices are declining (-3.0%/yr); year-one equity from $2k of loan paydown is wiped out by about $8k of value loss. Plan a longer hold.
- Churchill County population projected at -27% by 2050 — secular population decline; favor cash flow + early exit over multi-decade hold.
Negotiation context
- It's been on market 150 days — a 12% lower offer ($220k) is reasonable based on typical stale-listing flexibility.
Risks & watch-outs
- Climate carrying-cost: extreme-heat days projected 7→19/yr by 2055 (HVAC capex compounding) — expect insurance premiums to compound above CPI over the hold.
Questions for the listing agent
- What do current leases actually rent for vs. the listed asking? Can we see a recent rent roll and the last 12 months of T-12 income?
- It's been on market 150 days. Have you received any prior offers? Is the seller open to a 30% concession, seller financing, or rate buy-down credit?
- Built in 1960 — when were the roof, HVAC, electrical panel, plumbing, and water heater last replaced?
- Why hasn't it sold? Are there any deal-killer items the seller is aware of (foundation, flood, title, zoning, code violations)?
- Is there a deadline driving the sale (1031 exchange, divorce, estate, relocation)? That informs how much negotiation room exists.
- The area grade is low — what's the realistic commute time and amenity access for the typical tenant pool here? Any planned neighborhood developments (good or bad) we should know about?
- What's the average days-on-market for RENTAL listings here right now (not sales)? A rising rental-DOM trend means longer vacancies and softer asking-rent achievability than the comps imply.
- What's the recent tenant-quality profile in this submarket — average credit score on applications, eviction rate, late-payment / NSF rate, and stable-employment percentage? A property-management company in the area should have these aggregated.
- How much new for-sale + rental construction is in the pipeline within 1–3 miles? Heavy new supply typically softens prices + rents 12–24 months out; constrained supply supports both.
Investment metrics
- 1% rule
- 0.70% ✗
- Cap rate
- 5.58%
- Cash-on-cash
- -2.53%
- DSCR
- 0.89
- GRM
- 12.0
CMA / ARV
- ARV (median comp)
- $439,965
- List price
- $250,000
- Delta
- -43.18%
- Verdict
- UNDERPRICED
- Comps
- 20 within 1.0 mi
Show comp detail 3 sales within ~0.75 mi
| Address | Dist | Beds/Ba | Sqft | Sold | Price | $/sf | Match |
|---|---|---|---|---|---|---|---|
| 4033 Cimarron Rd | 0.35mi | 3/2.0 | 1,560 (+5%) | 3mo | $445,000 | $285 | 68 |
| 4210 Magnolia Rd | 0.39mi | 3/2.0 | 1,655 (+12%) | 10mo | $465,000 | $281 | 50 |
| 4190 Bottom Rd | 0.49mi | 3/2.0 | 1,269 (-14%) | 6mo | $405,000 | $319 | 44 |
Match score weights: distance 35% · size 25% · config 20% · recency 20%. Top-matched comps best support the ARV.
Projected returns pro-forma
-3.0% appreciation · 3.0% rent growth · sell at horizon
- IRR
- -20.6%
- Equity multiple
- 0.29×
- Total profit
- $-50,016
- Equity at exit
- $37,276
- IRR
- -13.9%
- Equity multiple
- 0.20×
- Total profit
- $-56,070
- Equity at exit
- $21,615
Cash invested: $70,000 (down + closing). Projections, not guarantees.
Landlord ↔ Tenant lean methodology
- Overall (STATE)
- 71 Landlord-Friendly
- State Nevada
- 71 Landlord-Friendly · R+1
- County
- — inherits STATE
- City
- — inherits STATE
ZIP-level market 89406
- Active inventory
- 151
- Price-to-rent
- 12.0×
Monthly cashflow live
- Estimated rent
- $1,740 medium interval (Pro) →
- Mortgage (P&I)
- −$1,311
- Tax from tax record
- −$107 /mo · $1,288/yr
- Insurance
- −$104
- HOA
- −$0
- Vacancy / Maint / Mgmt
- −$365
- Net cashflow
- $-148
Break-even live
Sensitivity live
| Price | -10% $-6 | -5% $-77 | +0% $-148 | +5% $-218 | +10% $-289 |
|---|---|---|---|---|---|
| Rent | -10% $-285 | -5% $-216 | +0% $-148 | +5% $-79 | +10% $-10 |
| Rate | -1.0pp $-22 | -0.5pp $-84 | base $-148 | +0.5pp $-212 | +1.0pp $-278 |
UW: 25.0% down · 7.5% · 30yr · 1.5% tax · 5.0% vac · 8.0% maint · 8.0% mgmt
Financing live
Cash to close
- Down payment
- $62,500
- Closing costs
- $7,500
- Reserves months
- —
- Total cash needed
- —
Loan-product check · same deal, 3 products live
Conventional
25% down · 7.5% · 30yr
- Down + closing
- —
- Monthly P&I
- —
- Monthly cashflow
- —
- DSCR
- —
- Eligible?
- —
Personal DTI + credit; lowest rate.
DSCR
20% down · 8.5% · 30yr
- Down + closing
- —
- Monthly P&I
- —
- Monthly cashflow
- —
- DSCR
- —
- Eligible?
- —
No personal income docs; deal must DSCR.
Hard money
10% down · 12.0% · 12mo
- Down + closing
- —
- Monthly P&I
- —
- Monthly cashflow
- —
- DSCR
- —
- Eligible?
- —
Short-term bridge; refi at stabilization.
Listing history 17 events
-
2026-06-19days on market $250,000 Active 150 DOM
-
2026-06-18days on market $250,000 Active 149 DOM
-
2026-06-17days on market $250,000 Active 148 DOM
-
2026-06-16days on market $250,000 Active 147 DOM
-
2026-06-15days on market $250,000 Active 146 DOM
-
2026-06-14days on market $250,000 Active 144 DOM
-
2026-06-12days on market $250,000 Active 143 DOM
-
2026-06-09days on market $250,000 Active 140 DOM
-
2026-06-08days on market $250,000 Active 139 DOM
-
2026-06-07days on market $250,000 Active 138 DOM
-
2026-06-07days on market $250,000 Active 137 DOM
-
2026-06-03days on market $250,000 Active 134 DOM
-
2026-06-02days on market $250,000 Active 133 DOM
-
2026-06-01days on market $250,000 Active 132 DOM
-
2026-05-31days on market $250,000 Active 131 DOM
-
2026-05-30days on market $250,000 Active 130 DOM
-
2026-01-20$250,000 Active 245-char remark
Show marketing remark (245 chars)
GREAT WATER RIGHTED PROPERTY WITH POTENTIAL. This property features a 3-bedroom, 1-bathroom, 1480-square-foot stick-built home. Mature trees and lots of room to build a shop/garage. Bring all your ideas and make this fixer-upper your dream home.
ⓘ Source: listings_history table (triggers on properties + properties_extension) + one-shot
backfill from property_details.listing_events for pre-trigger history.
Tax reassessment forecast NV · Resets to sale price
- Current annual tax
- $1,288 · $107/mo
- Projected year-2 tax
- $1,475 · $123/mo
- Expected delta
- +$187/yr (+$16/mo · 14.5%)
ⓘ Screening estimate from a state-policy table — verify with the county assessor before closing.
Climate risk First Street
- Flood 1/10 Low FEMA zone X (shaded) · 0% chance over 30 yrs
- Wildfire 3/10 Moderate
- Heat 5/10 Major 7 d/yr ≥95°F today · 19 d/yr by 30 yrs out
- Wind 1/10 Low
- Air quality 8/10 Severe 16 unhealthy d/yr today · 17 by 30 yrs out
Nearby sold comps map
Loading sold comps map…
Walkable amenities ~0.75 mi
Loading nearby amenities…
Taxation est. · year 1
- Rental income
- $20,883
- − Mortgage interest
- −$14,004
- − Property taxes
- −$1,288
- − Insurance
- −$1,250
- − Repairs & maintenance
- −$1,671
- − Management
- −$1,671
- − Depreciation
- −$7,273
- Taxable loss
- −$6,272
- Est. tax savings @ 24.0%
- +$1,505
- After-tax cash flow
- $-267/yr
For passive investors: Depreciation is non-cash, so a rental often shows a tax loss while cash-flowing — sheltering income. Rental losses are passive: they offset passive income freely, and up to $25,000/yr can offset ordinary (W-2) income if you actively participate and your MAGI is under $100k (phasing out to $0 by $150k); unused losses carry forward. On sale, claimed depreciation is recaptured at up to 25%, and gains may owe capital-gains tax (a 1031 exchange can defer both). Figures are a year-1 estimate at your 24.0% rate — not tax advice; consult a CPA.
Schools (NCES district)
- District
- Churchill County School District
- NCES district ID
- 3200030
- Math proficiency
- 21% ▼ -7.00%
- Reading proficiency
- 41% ▼ -2.00%
- Median HH income
- $49,462
- Composite
- 26.9/100
- National rank
- #7090
- State rank
- #10 of 17 in NV
Livability — Fallon
- Score
- 71/100
- State rank
- #24
- US rank
- #7219
Category grades
Schools grade is shown separately in the Schools card above.
Census & demographics
- County
- Churchill County · 25,739 people
- City population
- 25,739
- Metro
- Fallon, NV
- Population (ZIP)
- 25,739
- Household income
- $79,163
- Rent vs Own
- Severe rent burden
- 427.0
Population outlook (Churchill County) Hauer SSP2
- Today (2025)
- 22,136 people
- By 2030
- 20,921 · -5.5%
- By 2040
- 18,522 · -16.3%
- By 2050
- 16,175 · -26.9%
- By 2075
- 11,713 · -47.1%
- By 2100
- 7,954 · -64.1%
Race, ethnicity, and origin ACS 2023
- Neighborhood character
- Predominantly White (72%)
- Race & ethnicity
- White 72% Hispanic / Latino 15% Two or more races 11% Native American 4% Asian 2% Black 2%
- Hispanic origin (detail)
- Mexican 11%
- Common ancestry
- Slovak 4% Italian 3% Romanian 2%
- Foreign-born
- 5% · Canada, Jamaica
- Languages at home
- 91% English-only · Spanish 7% Tagalog/Filipino 1% Other Asian/Pacific 1%
Political lean MEDSL · Churchill
- 2024 margin
- Solid R (+50.2) · D 23.5% · R 73.8% · Other 2.7%
- 2008→2024 swing
- -18.4pp toward R · 2008: -31.8pp · 2024: -50.2pp
- All cycles
- 2024: R+50.2 2020: R+49.0 2016: R+51.4 2012: R+39.9 2008: R+31.8
Not yet ingested
- Civics
- —
Market trends
- HPI YoY
- ▼ -198.42%
- Current HPI
- 261.7301
- Rent YoY
- —
- Metro
- Fallon, NV
- State GDP YoY
- ▲ 3.08%
- F500 in state
- 6
Industry mix (Fortune 500 HQ in NV)
| Industry | F500 HQs | Revenue |
|---|---|---|
| Hotels / Casinos | 3 | $36B |
|
||
Price history
1 event — show timeline
- 2026-01-20 Listed $250,000 NNRMLS
Property tax history
+4.8%/yrLatest (2025): $1,288 · +3.4% YoY. Source: county tax records.
Cash-flow waterfall
monthlySold comps — $/sqft
last 12 mo · ≤1 miLoading sold comps…