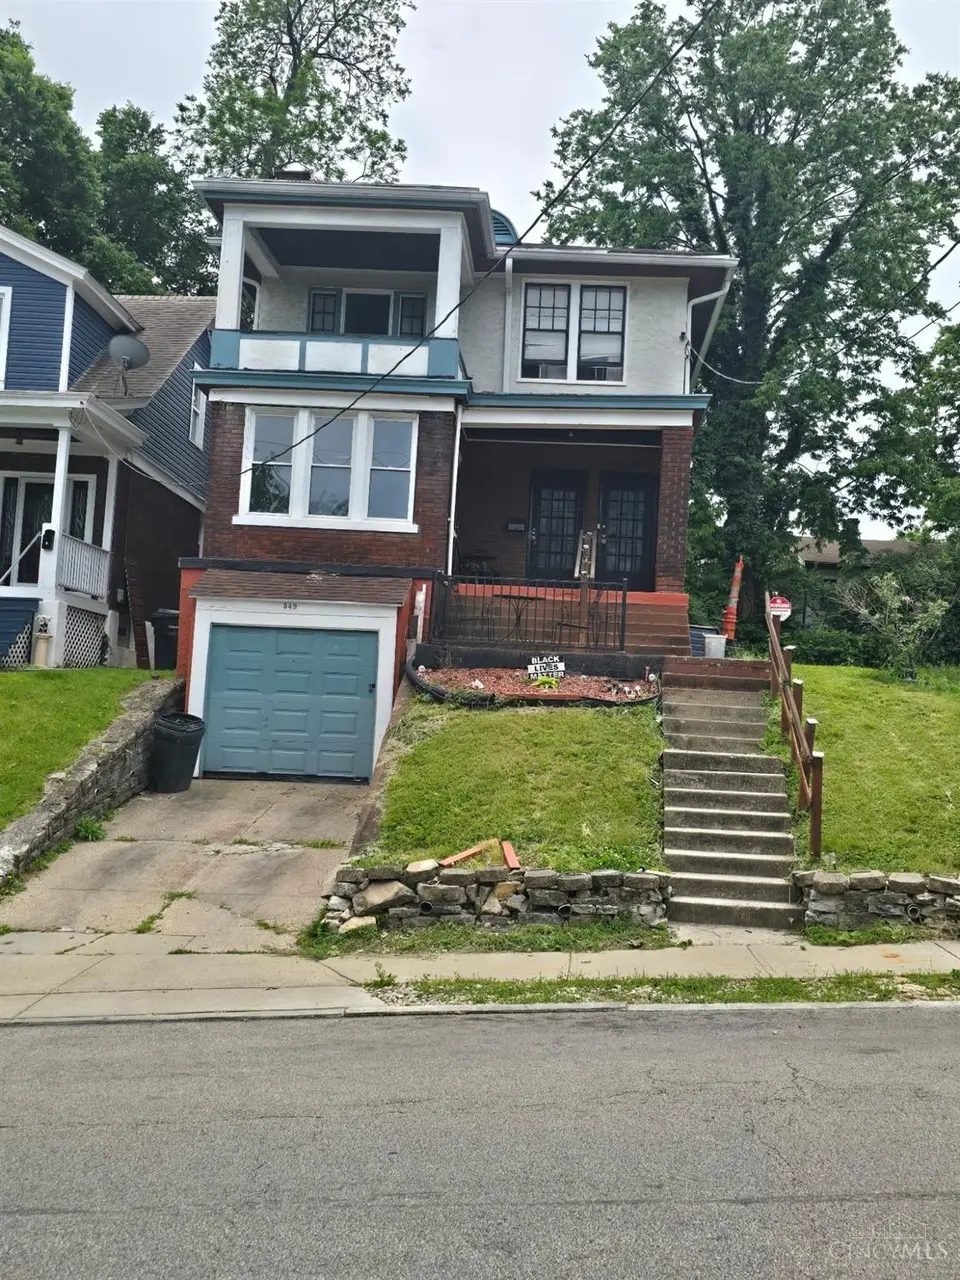
 Duplex
549 Prospect Pl · Cincinnati, OH
Flood risk 1/10 · Minimal
- FEMA flood zone
- X (unshaded)
- Chance of flooding over 30 yrs
- 0.0%
- Est. flood insurance / yr
- $473 – $860
Fire risk 1/10 · Minimal
- Est. fire insurance / yr
- $713 – $1,323
Heat risk 4/10 · Minor
- Hot days now (above 103°F)
- 7 days/yr
- Hot days in 30 yrs
- 19 days/yr
Wind risk 2/10 · Minimal
- Chance of severe wind over 30 yrs
- 1.0%
Air-quality risk 3/10 · Minor
- Unhealthy air days now
- 2 days/yr
- Unhealthy air days in 30 yrs
- 3 days/yr
Risk factors via First Street. Map © Google.
Why this score? — see what drove the B- grade
The composite is a weighted blend of 9 inputs, each scored 0–100. Each bar is that input's sub-score; the figure is the points it added to the 100-point composite (weight × sub-score).
- Cash flow +30.0/30.0
- DSCR +10.0/10.0
- 1% rule +8.4/10.0
- ARV discount +7.5/15.0
- Livability +4.0/5.0
- Rent growth +3.9/5.0
- Schools +2.5/10.0
- Condition / age +2.5/5.0
- Appreciation +0.0/10.0
$199,999
🖨 Deal sheet (PDF) 📄 Offer letter ✓ Due diligence
Multi-family units
County records classify this as Multi-Family (2-4 Unit). Listing-text estimate: 2 units. confirmed
Listing remarks
Investor opportunity! Duplex in a centrally located area offering excellent income and value-add potential with a little TLC. Being sold AS IS, WHERE IS. Cash or conventional financing only. Side A features 3 bedrooms and 1 full bath. Side B offers 1 bedroom and 1 full bath and is currently tenant occupied, providing immediate rental income potential. Property includes both on and off-street parking and is conveniently located within 4 miles of two local universities, shopping, dining, and commuter routes.
Key facts
- Tenant occupied
- Income potential
- Value-add potential
Tags
Property features AI
Finance
- Other: Total of 2 units (one 1-bedroom unit and one 3-bedroom unit); Basement area approximately 1,104 (finished/unfinished details not provided)
Exterior
- Parking: Attached front garage; Driveway; 1 open parking space
- Utilities: Public water; Public sewer; Natural gas available
- Home design: Duplex; Two-story; Entry level information not provided; Facing direction not provided
- Construction: Built with brick construction; Poured foundation
- Exterior features: Brick exterior; Wood-framed windows; Shingle roof; Public water; Public sewer; Lot size about 0.077 acres
Interior
- Bedrooms: Unit 1: 1 bedroom; Unit 2: 3 bedrooms
- Bathrooms: Unit 1: 1 full bathroom; Unit 2: 1 full bathroom
- Heating & cooling: Forced air gas heating; Window-unit cooling
- Interior features: Partial basement; Two levels; Two gas fireplaces
Neighborhood map
What this means for you Summary
Snapshot
- This is a 2 × 2-bed/1.0-bath units multifamily listed at $200k.
Deal economics
- At list price, monthly cash flow is $842 ($10k/yr) — positive. Per door: $421/mo.
- The deal already cash-flows at list — no discount required.
- Meets the 1% rule at list price ($3k rent vs $200k).
- Cap rate 11.3% vs local median 3.9% in Cincinnati — top-decile yield for the area; either an underpriced asset or a hidden risk that comps aren't pricing in. Stress-test before assuming the spread holds.
Location & tenants
- Location reads 80/100 on livability (#130 in OH, #1,856 nationally) — a professional / high-income tenant draw. Strengths: amenities A+, commute A+, cost of living A+; Watch: employment D, crime F.
- Cincinnati Public Schools (urban): math 25% / reading 36% proficiency, ranked #581 of 656 in OH (top 89%) — families likely to look elsewhere, expect single-tenant / working-renter base with shorter leases; 70% free/reduced lunch — lower-income household profile, screen leases tightly.
- Market conditions: Rents rising fast (+5.5%/yr); 49 active listings in the ZIP; 29 comparable units currently listed for rent nearby; rentals at typical pace (median 21d on market — plan ~3-4 weeks tenant-placement turnaround); lower-income renter base — watch delinquency; 801 units permitted in Hamilton County in 2024 (190 in 5+ unit buildings).
- At $2,681/mo this rent would consume 100% of the median local household income ($32k/yr) (locally 1730% of renters already pay >50% of income on rent) — very limited rent-growth headroom before tenants either downsize or default.
Forward outlook
- Local home prices are declining (-3.0%/yr); year-one equity from $1k of loan paydown is wiped out by about $6k of value loss. Plan a longer hold.
- At projected returns (-3.0% appreciation + 5.5% rent growth), your $56k cash investment doubles in ~6 years — after that, you're playing with house money.
Negotiation context
- Only 13 days on market — expect competitive offers; lowballing is unlikely to land.
- 3 sale attempts since 19y ago with the ask held roughly flat each time — persistent listings suggest the price (not the market) is what's stuck; bring a comps-based counter.
- Current owner paid $18k; list at $200k implies a 1011% gain — meaningful room to come down on a strong offer.
Risks & watch-outs
- Watch-outs: built in 1923 — expect roof / HVAC / electrical / plumbing capex.
Questions for the listing agent
- Can we see the unit-by-unit rent roll, current vacancy, and any below-market leases? What's the average tenancy length?
- What capital expenditures (roof, boiler, parking lot, exteriors) have been made in the last 5 years, and what's planned in the next 2?
- Built in 1923 — when were the roof, HVAC, electrical panel, plumbing, and water heater last replaced?
- Is there a deadline driving the sale (1031 exchange, divorce, estate, relocation)? That informs how much negotiation room exists.
- Schools are B-rated — typically a magnet for longer-tenancy family renters. What's the average tenant stay here, and is there a school-zone premium baked into asking?
- Crime grade is F in this area — have there been break-ins, vandalism, or insurance claims at this property in the last 3 years? What carrier currently insures it and at what premium?
- What's the average days-on-market for RENTAL listings here right now (not sales)? A rising rental-DOM trend means longer vacancies and softer asking-rent achievability than the comps imply.
- What's the recent tenant-quality profile in this submarket — average credit score on applications, eviction rate, late-payment / NSF rate, and stable-employment percentage? A property-management company in the area should have these aggregated.
- How much new apartment / multifamily construction is in the pipeline within 1–3 miles? Heavy new supply (>2% of stock underway) typically softens rents 12–24 months out; light construction supports rent growth.
Investment metrics
- 1% rule
- 1.34% ✓
- Cap rate
- 11.35%
- Cash-on-cash
- 18.05%
- DSCR
- 1.80
- GRM
- 6.2
CMA / ARV
No comps found within radius.
Projected returns pro-forma
-3.0% appreciation · 5.55% rent growth · sell at horizon
- IRR
- 12.3%
- Equity multiple
- 1.50×
- Total profit
- $28,256
- Equity at exit
- $29,821
- IRR
- 23.1%
- Equity multiple
- 3.22×
- Total profit
- $124,068
- Equity at exit
- $17,292
Cash invested: $56,000 (down + closing). Projections, not guarantees.
Landlord ↔ Tenant lean methodology
- Overall (STATE)
- 73 Landlord-Friendly
- State Ohio
- 73 Landlord-Friendly · R+6
- County
- — inherits STATE
- City
- — inherits STATE
ZIP-level market 45229
- Home prices YoY
- -24.0%
- Rents YoY
- 5.5%
- Active inventory
- 49
- Price-to-rent
- 12.4×
Monthly cashflow live
- Estimated rent
- $2,681 high interval (Pro) →
- Mortgage (P&I)
- −$1,049
- Tax from tax record
- −$144 /mo · $1,724/yr
- Insurance
- −$83
- HOA
- −$0
- Vacancy / Maint / Mgmt
- −$563
- Net cashflow
- $842
Break-even live
Sensitivity live
| Price | -10% $955 | -5% $899 | +0% $842 | +5% $786 | +10% $729 |
|---|---|---|---|---|---|
| Rent | -10% $630 | -5% $736 | +0% $842 | +5% $948 | +10% $1,054 |
| Rate | -1.0pp $943 | -0.5pp $893 | base $842 | +0.5pp $790 | +1.0pp $738 |
2-unit breakdown (identical units grouped — click to expand)
| Units | Beds | Baths | Est. rent |
|---|---|---|---|
| 2× units | 2 | 1 | $2,680 |
| #1 | 2 | 1 | $1,340 |
| #2 | 2 | 1 | $1,340 |
| Total (2 units) | $2,681 | ||
UW: 25.0% down · 7.5% · 30yr · 1.5% tax · 5.0% vac · 8.0% maint · 8.0% mgmt
Financing live
Cash to close
- Down payment
- $50,000
- Closing costs
- $6,000
- Reserves months
- —
- Total cash needed
- —
Loan-product check · same deal, 3 products live
Conventional
25% down · 7.5% · 30yr
- Down + closing
- —
- Monthly P&I
- —
- Monthly cashflow
- —
- DSCR
- —
- Eligible?
- —
Personal DTI + credit; lowest rate.
DSCR
20% down · 8.5% · 30yr
- Down + closing
- —
- Monthly P&I
- —
- Monthly cashflow
- —
- DSCR
- —
- Eligible?
- —
No personal income docs; deal must DSCR.
Hard money
10% down · 12.0% · 12mo
- Down + closing
- —
- Monthly P&I
- —
- Monthly cashflow
- —
- DSCR
- —
- Eligible?
- —
Short-term bridge; refi at stabilization.
Rent comps 29 comps
| Address | Beds | Baths | Sqft | Rent | $/sqft | DOM | Units | Dist |
|---|---|---|---|---|---|---|---|---|
| 434 Northern Ave Cincinnati, OH | 3.0 | 2.5 | 1518 | $2,700 | $1.78 | 5d | 1 | 0.14mi |
| 3564 Estes Pl Unit 2 Cincinnati, OH | 3.0 | 1.0 | 1662 | $1,500 | $0.90 | 3d | 1 | 0.32mi |
| 870 Rockdale Ave Cincinnati, OH | 4.0 | 2.0 | 1749 | $1,800 | $1.03 | 25d | 1 | 0.51mi |
| 242 Stetson St Unit NA Cincinnati, OH | 3.0 | 2.5 | 2300 | $3,500 | $1.52 | 22d | 1 | 0.71mi |
| 3139 Gaff Ave Cincinnati, OH | 3.0 | 2.0 | 1711 | $1,795 | $1.05 | 17d | 1 | 0.75mi |
| 3028 Gilbert Ave Cincinnati, OH | 5.0 | 1.5 | 1936 | $1,700 | $0.88 | 21d | 1 | 0.79mi |
| 850 Lincoln Ave Unit 2 Cincinnati, OH | 3.0 | 2.5 | 2465 | $2,400 | $0.97 | 25d | 1 | 0.82mi |
| 979 Burton Ave Cincinnati, OH | 3.0 | 1.0 | 1725 | $1,595 | $0.92 | 4d | 1 | 0.83mi |
| 241 E University Ave Cincinnati, OH | 5.0 | 2.0 | 1836 | $4,000 | $2.18 | 25d | 1 | 0.84mi |
| 2813 Gerard St Unit 1540075P Cincinnati, OH | 4.0 | 3.0 | 2152 | $6,281 | $2.92 | 21d | 1 | 0.92mi |
| 3263 Bishop St Cincinnati, OH | 3.0 | 2.0 | 1465 | $2,395 | $1.63 | 25d | 1 | 0.99mi |
| 1524 Ruth Ave Unit 2 Cincinnati, OH | 4.0 | 1.0 | 1971 | $1,595 | $0.81 | 25d | 1 | 0.99mi |
| 3209 Gilbert Ave Unit 2 Cincinnati, OH | 4.0 | 2.0 | 1548 | $1,395 | $0.90 | 4d | 1 | 1.04mi |
| 3141 Bishop St Unit 1 Cincinnati, OH | 3.0 | 1.0 | 1500 | $2,100 | $1.40 | 25d | 1 | 1.04mi |
| 2601 May St Cincinnati, OH | 2.0–3.0 | 2.5–3.5 | 1737 | $3,325 | $1.91 | 3d | 12 | 1.08mi |
| 2800 Jefferson Ave Cincinnati, OH | 4.0 | 2.0 | 2500 | $625 | $0.25 | 21d | 1 | 1.10mi |
| 2517 May St Cincinnati, OH | 3.0 | 3.5 | 2014 | $3,420 | $1.70 | 22d | 1 | 1.11mi |
| 3113 Harvard Ave Cincinnati, OH | 4.0 | 3.0 | 1895 | $2,700 | $1.42 | 15d | 1 | 1.13mi |
| 749 Morgan St Cincinnati, OH | 3.0 | 2.0 | 1488 | $1,745 | $1.17 | 15d | 1 | 1.29mi |
| 1710 Fairfax Ave Unit 1710 Cincinnati, OH | 5.0 | 2.0 | 1500 | $2,000 | $1.33 | 25d | 1 | 1.31mi |
| 3326 Fairfield Ave Cincinnati, OH | 3.0 | 2.0 | 1566 | $1,600 | $1.02 | 11d | 1 | 1.35mi |
| 1718 Dexter Ave Cincinnati, OH | 4.0 | 2.0 | 2539 | $2,100 | $0.83 | 25d | 1 | 1.35mi |
| 923 Rogers Pl Cincinnati, OH | 3.0 | 1.0 | 2061 | $1,600 | $0.78 | 25d | 1 | 1.39mi |
| 358 Shiloh St Cincinnati, OH | 1.0–3.0 | 1.0 | 1400 | $2,100 | $1.50 | 3d | 1 | 1.40mi |
| 918 Windsor St Cincinnati, OH | 3.0 | 1.0 | 2583 | $1,675 | $0.65 | 25d | 1 | 1.43mi |
| 2533 Woodburn Ave Cincinnati, OH | 3.0 | 1.0–3.0 | 912 | $3,320 | $3.64 | 3d | 39 | 1.43mi |
| 2331 Park Ave Unit 1 Cincinnati, OH | 3.0 | 2.5 | 2200 | $2,350 | $1.07 | 3d | 1 | 1.44mi |
| 1607 Asmann Ave Cincinnati, OH | 1.0–4.0 | 1.0–1.5 | 1069 | $1,695 | $1.58 | 13d | 6 | 1.46mi |
| 7 W Hollister St Cincinnati, OH | 5.0 | 2.0 | 1585 | $2,750 | $1.74 | 15d | 1 | 1.47mi |
Listing history 9 events
-
2026-06-21days on market $199,999 Active 13 DOM
-
2026-06-18days on market $199,999 Active 10 DOM
-
2026-06-17days on market $199,999 Active 9 DOM
-
2026-06-16days on market $199,999 Active 8 DOM
-
2026-06-15days on market $199,999 Active 7 DOM
-
2026-06-13days on market $199,999 Active 5 DOM
-
2026-06-13days on market $199,999 Active 4 DOM
-
2026-06-08remarks 511-char remark
-
2026-06-08$199,999 Active 1 DOM
ⓘ Source: listings_history table (triggers on properties + properties_extension) + one-shot
backfill from property_details.listing_events for pre-trigger history.
Tax reassessment forecast OH · Partial reset (capped growth)
- Current annual tax
- $1,724 · $144/mo
- Projected year-2 tax
- $2,422 · $202/mo
- Expected delta
- +$698/yr (+$58/mo · 40.5%)
ⓘ Screening estimate from a state-policy table — verify with the county assessor before closing.
Climate risk First Street
- Flood 1/10 Low FEMA zone X (unshaded) · 0% chance over 30 yrs
- Wildfire 1/10 Low
- Heat 4/10 Moderate 7 d/yr ≥103°F today · 19 d/yr by 30 yrs out
- Wind 2/10 Low 100% chance of damaging wind over 30 yrs
- Air quality 3/10 Moderate 2 unhealthy d/yr today · 3 by 30 yrs out
Nearby sold comps map
Loading sold comps map…
Walkable amenities ~0.75 mi
Loading nearby amenities…
Taxation est. · year 1
- Rental income
- $32,172
- − Mortgage interest
- −$11,203
- − Property taxes
- −$1,724
- − Insurance
- −$1,000
- − Repairs & maintenance
- −$2,574
- − Management
- −$2,574
- − Depreciation
- −$5,818
- Taxable income
- $7,279
- Est. tax owed @ 24.0%
- −$1,747
- After-tax cash flow
- $8,359/yr
For passive investors: Depreciation is non-cash, so a rental often shows a tax loss while cash-flowing — sheltering income. Rental losses are passive: they offset passive income freely, and up to $25,000/yr can offset ordinary (W-2) income if you actively participate and your MAGI is under $100k (phasing out to $0 by $150k); unused losses carry forward. On sale, claimed depreciation is recaptured at up to 25%, and gains may owe capital-gains tax (a 1031 exchange can defer both). Figures are a year-1 estimate at your 24.0% rate — not tax advice; consult a CPA.
Schools (NCES district)
- District
- Cincinnati Public Schools
- NCES district ID
- 3904375
- Math proficiency
- 25% ▼ -19.00%
- Reading proficiency
- 36% ▼ -14.00%
- Median HH income
- $35,743
- Composite
- 25.21/100
- National rank
- #7508
- State rank
- #581 of 656 in OH
Livability — Cincinnati
- Score
- 80/100
- State rank
- #130
- US rank
- #1856
Category grades
Schools grade is shown separately in the Schools card above.
Census & demographics
- Census place
- Cincinnati, OH
- County
- Hamilton County · 701,295 people
- City population
- 505,555
- Metro
- Cincinnati, OH-KY-IN
- Population (ZIP)
- 13,529
- Household income
- $32,263
- Rent vs Own
- Severe rent burden
- 1730.0
Population outlook (Hamilton County) Hauer SSP2
- Today (2025)
- 826,054 people
- By 2030
- 830,947 · +0.6%
- By 2040
- 832,319 · +0.8%
- By 2050
- 822,428 · -0.4%
- By 2075
- 788,688 · -4.5%
- By 2100
- 710,674 · -14.0%
Race, ethnicity, and origin ACS 2023
- Neighborhood character
- Predominantly Black (65%)
- Race & ethnicity
- Black 65% White 24% Two or more races 5% Hispanic / Latino 4% Asian 1%
- Common ancestry
- Italian 2% Iranian 1% Lithuanian 1%
- Foreign-born
- 5% · Canada
- Languages at home
- 93% English-only · Spanish 4% Russian/Polish/Slavic 1% Other Indo-European 1%
Political lean MEDSL · Hamilton
- 2024 margin
- D (+14.9) · D 57.0% · R 42.1%
- 2008→2024 swing
- +7.9pp toward D · 2008: 7.0pp · 2024: 14.9pp
- All cycles
- 2024: D+14.9 2020: D+15.9 2016: D+9.5 2012: D+4.9 2008: D+7.0
Not yet ingested
- Civics
- —
Market trends
- HPI YoY
- ▼ -80.34%
- Current HPI
- 254.492
- Rent YoY
- ▲ 5.55%
- Metro
- Cincinnati, OH-KY-IN
- State GDP YoY
- ▲ 1.98%
- F500 in state
- 48
Industry mix (Fortune 500 HQ in OH)
| Industry | F500 HQs | Revenue |
|---|---|---|
| Insurance | 3 | $145B |
|
||
| Industrial Machinery | 3 | $49B |
|
||
| Financial Services | 3 | $24B |
|
||
| Consumer Goods | 2 | $93B |
|
||
| Aerospace / Defense | 2 | $47B |
|
||
| Utilities | 2 | $33B |
|
||
Price history
+116.2% since first listed7 events — show timeline
- 2026-06-08 Listed $199,999 Cincy MLS
- 2011-09-17 Listing Removed — Cincy MLS
- 2010-01-16 Listed $54,900 Cincy MLS
- 2008-11-17 Sold (Public Records) $18,000 Public Records
- 2007-04-20 Listing Removed — Cincy MLS
- 2007-03-16 Listed $98,900 Cincy MLS
- 2005-11-22 Sold (Public Records) $92,500 Public Records
Property tax history
+13.4%/yrLatest (2025): $1,724 · +0.1% YoY. Source: county tax records.
Cash-flow waterfall
monthlySold comps — $/sqft
last 12 mo · ≤1 miLoading sold comps…