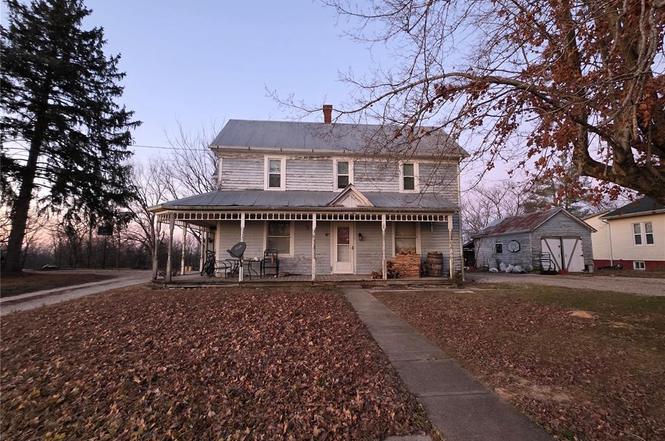
9112 Main St · Altenburg, MO
Flood risk 1/10 · Minimal
- FEMA flood zone
- X (unshaded)
- Chance of flooding over 30 yrs
- 0.0%
- Est. flood insurance / yr
- $507 – $1,088
Fire risk 3/10 · Minor
- Est. fire insurance / yr
- $1,054 – $1,958
Heat risk 4/10 · Minor
- Hot days now (above 107°F)
- 7 days/yr
- Hot days in 30 yrs
- 21 days/yr
Wind risk 2/10 · Minimal
- Chance of severe wind over 30 yrs
- 2.0%
Air-quality risk 1/10 · Minimal
- Unhealthy air days now
- 0 days/yr
- Unhealthy air days in 30 yrs
- 0 days/yr
Risk factors via First Street. Map © Google.
Why this score? — see what drove the B+ grade
The composite is a weighted blend of 9 inputs, each scored 0–100. Each bar is that input's sub-score; the figure is the points it added to the 100-point composite (weight × sub-score).
- Cash flow +30.0/30.0
- 1% rule +10.0/10.0
- DSCR +10.0/10.0
- ARV discount +7.5/15.0
- Appreciation +6.9/10.0
- Schools +3.7/10.0
- Livability +3.0/5.0
- Rent growth +2.5/5.0
- Condition / age +2.5/5.0
$60,000
🖨 Deal sheet 📄 Offer letter ✓ Due diligence
Key facts
- 0.28 acre lot
- Garage
- Built 1910
Property features AI
Finance
- Other: Property listed as residential, single family; Living area reported as 1,564 (assessor)
Exterior
- Parking: Has garage (1 car); Additional parking
- Utilities: Public water; Public sewer; 220 Volt electric service; Cable available; Electricity connected; Natural gas connected
- Home design: Single-family residence; One and one-half story
- Construction: Vinyl siding and other construction materials; Cellar basement
- Exterior features: Wrap-around porch; Few trees on property; Rectangular lot
Interior
- Kitchen: Microwave; Wall oven
- Bedrooms: 3 bedrooms (all on upper level)
- Flooring: Hardwood
- Bathrooms: 2 full bathrooms (one main-level full bath, one upper-level full bath)
- Heating & cooling: Natural gas heating; Ceiling fans; Window air conditioning units
- Interior features: Hardwood flooring; Microwave; Wall oven
Neighborhood map
What this means for you Summary
Snapshot
- This is a 3-bed/2.0-bath other listed at $60k.
Deal economics
- At list price, monthly cash flow is $539 ($6k/yr) — positive.
- The deal already cash-flows at list — no discount required.
- Meets the 1% rule at list price ($1k rent vs $60k).
- Recommended offer: $53k (12.0% below list) — sets the bar for market timing.
Location & tenants
- Location reads 60/100 on livability (#472 in MO) — a middle-class / working-renter tenant base. Strengths: cost of living A+, housing A+; Watch: crime F, amenities F, commute F.
- Altenburg 48 (rural): math 40% / reading 40% proficiency, ranked #274 of 535 in MO (top 51%) — families likely to look elsewhere, expect single-tenant / working-renter base with shorter leases.
- Zoned schools: Altenburg Elem. (math 52% / reading 67%, grade B-, #124 of 1,115 statewide, top 13%, 110 students, 28% FRL) — zoned schools at 28% FRL track the district average.
- Zoned-school proficiency averages 60% at this address vs 40% district-wide (+20 pts) — the actual schools serving this property are materially stronger than the Altenburg 48 average implies; a family-tenant draw the district grade alone would hide.
- Market conditions: 6 active listings in the ZIP; 36 units permitted in Perry County in 2024 (0 in 5+ unit buildings).
Forward outlook
- In year one you build about $3k of equity ($415 loan paydown + $2k appreciation (3.7% local appreciation)).
- At projected returns (3.7% appreciation + 3.0% rent growth), your $17k cash investment doubles in ~2 years — after that, you're playing with house money.
Negotiation context
- It's been on market 131 days — a 12% lower offer ($53k) is reasonable based on typical stale-listing flexibility.
- 4 sale attempts since 2y ago with the ask held roughly flat each time — persistent listings suggest the price (not the market) is what's stuck; bring a comps-based counter.
Risks & watch-outs
- Watch-outs: built in 1910 — expect roof / HVAC / electrical / plumbing capex.
Questions for the listing agent
- It's been on market 131 days. Have you received any prior offers? Is the seller open to a 12% concession, seller financing, or rate buy-down credit?
- Built in 1910 — when were the roof, HVAC, electrical panel, plumbing, and water heater last replaced?
- Why hasn't it sold? Are there any deal-killer items the seller is aware of (foundation, flood, title, zoning, code violations)?
- Is there a deadline driving the sale (1031 exchange, divorce, estate, relocation)? That informs how much negotiation room exists.
- Schools are D-rated, which usually means shorter tenancies and higher turnover. Who's the typical renter profile here, and what's been the actual vacancy rate?
- Crime grade is F in this area — have there been break-ins, vandalism, or insurance claims at this property in the last 3 years? What carrier currently insures it and at what premium?
- What's the average days-on-market for RENTAL listings here right now (not sales)? A rising rental-DOM trend means longer vacancies and softer asking-rent achievability than the comps imply.
- What's the recent tenant-quality profile in this submarket — average credit score on applications, eviction rate, late-payment / NSF rate, and stable-employment percentage? A property-management company in the area should have these aggregated.
- How much new for-sale + rental construction is in the pipeline within 1–3 miles? Heavy new supply typically softens prices + rents 12–24 months out; constrained supply supports both.
Investment metrics
- 1% rule
- 1.96% ✓
- Cap rate
- 17.08%
- Cash-on-cash
- 38.51%
- DSCR
- 2.71
- GRM
- 4.3
CMA / ARV
No comps found within radius.
Projected returns pro-forma
3.74% appreciation · 3.0% rent growth · sell at horizon
- IRR
- 45.1%
- Equity multiple
- 3.62×
- Total profit
- $43,945
- Equity at exit
- $29,505
- IRR
- 44.2%
- Equity multiple
- 7.28×
- Total profit
- $105,480
- Equity at exit
- $47,540
Cash invested: $16,800 (down + closing). Projections, not guarantees.
Landlord ↔ Tenant lean methodology
- Overall (STATE)
- 81 Strongly Landlord-Friendly
- State Missouri
- 81 Strongly Landlord-Friendly · R+10
- County
- — inherits STATE
- City
- — inherits STATE
ZIP-level market 63732
- Home prices YoY
- 1.6%
- Active inventory
- 6
- Price-to-rent
- 4.3×
Monthly cashflow live
- Estimated rent
- $1,176 medium interval (Pro) →
- Mortgage (P&I)
- −$315
- Tax from tax record
- −$51 /mo · $607/yr
- Insurance
- −$25
- HOA
- −$0
- Vacancy / Maint / Mgmt
- −$247
- Net cashflow
- $539
Break-even live
UW: 25.0% down · 7.5% · 30yr · 1.5% tax · 5.0% vac · 8.0% maint · 8.0% mgmt
Financing live
Cash to close
- Down payment
- $15,000
- Closing costs
- $1,800
- Reserves months
- —
- Total cash needed
- —
Loan-product check · same deal, 3 products live
Conventional
25% down · 7.5% · 30yr
- Down + closing
- —
- Monthly P&I
- —
- Monthly cashflow
- —
- DSCR
- —
- Eligible?
- —
Personal DTI + credit; lowest rate.
DSCR
20% down · 8.5% · 30yr
- Down + closing
- —
- Monthly P&I
- —
- Monthly cashflow
- —
- DSCR
- —
- Eligible?
- —
No personal income docs; deal must DSCR.
Hard money
10% down · 12.0% · 12mo
- Down + closing
- —
- Monthly P&I
- —
- Monthly cashflow
- —
- DSCR
- —
- Eligible?
- —
Short-term bridge; refi at stabilization.
Listing history 27 events
-
2026-06-19days on market $60,000 Active 131 DOM
-
2026-06-18days on market $60,000 Active 130 DOM
-
2026-06-17days on market $60,000 Active 129 DOM
-
2026-06-16days on market $60,000 Active 128 DOM
-
2026-06-15days on market $60,000 Active 127 DOM
-
2026-06-14days on market $60,000 Active 125 DOM
-
2026-06-13days on market $60,000 Active 124 DOM
-
2026-06-10days on market $60,000 Active 122 DOM
-
2026-06-09days on market $60,000 Active 121 DOM
-
2026-06-08days on market $60,000 Active 120 DOM
-
2026-06-07days on market $60,000 Active 119 DOM
-
2026-06-05days on market $60,000 Active 116 DOM
-
2026-06-03days on market $60,000 Active 115 DOM
-
2026-06-02days on market $60,000 Active 114 DOM
-
2026-06-01days on market $60,000 Active 113 DOM
-
2026-05-31days on market $60,000 Active 112 DOM
-
2026-05-30days on market $60,000 Active 111 DOM
-
2026-02-09$60,000 Active
-
2026-01-22historical $60,000
-
2025-08-06status Active
-
2025-08-06price $65,000
-
2025-03-27price $70,000
-
2024-12-02status Active
-
2024-12-02price $77,500
-
2024-12-01historical
-
2024-09-04$79,500 Active
-
2007-07-27soldstatus
ⓘ Source: listings_history table (triggers on properties + properties_extension) + one-shot
backfill from property_details.listing_events for pre-trigger history.
Tax reassessment forecast MO · Resets to sale price
- Current annual tax
- $607 · $51/mo
- Projected year-2 tax
- $607 · $51/mo
- Expected delta
- $0/yr ($0/mo · 0.0%)
ⓘ Screening estimate from a state-policy table — verify with the county assessor before closing.
Climate risk First Street
- Flood 1/10 Low FEMA zone X (unshaded) · 0% chance over 30 yrs
- Wildfire 3/10 Moderate
- Heat 4/10 Moderate 7 d/yr ≥107°F today · 21 d/yr by 30 yrs out
- Wind 2/10 Low 2% chance of damaging wind over 30 yrs
- Air quality 1/10 Low 0 unhealthy d/yr today · 0 by 30 yrs out
Nearby sold comps map
Loading sold comps map…
Walkable amenities ~0.75 mi
Loading nearby amenities…
Taxation est. · year 1
- Rental income
- $14,118
- − Mortgage interest
- −$3,361
- − Property taxes
- −$607
- − Insurance
- −$300
- − Repairs & maintenance
- −$1,129
- − Management
- −$1,129
- − Depreciation
- −$1,745
- Taxable income
- $5,845
- Est. tax owed @ 24.0%
- −$1,403
- After-tax cash flow
- $5,067/yr
For passive investors: Depreciation is non-cash, so a rental often shows a tax loss while cash-flowing — sheltering income. Rental losses are passive: they offset passive income freely, and up to $25,000/yr can offset ordinary (W-2) income if you actively participate and your MAGI is under $100k (phasing out to $0 by $150k); unused losses carry forward. On sale, claimed depreciation is recaptured at up to 25%, and gains may owe capital-gains tax (a 1031 exchange can defer both). Figures are a year-1 estimate at your 24.0% rate — not tax advice; consult a CPA.
Schools (NCES district)
- District
- Altenburg 48
- NCES district ID
- 2903040
- Math proficiency
- 40% ▬ 0.00%
- Reading proficiency
- 40% ▼ -10.00%
- Median HH income
- $54,941
- Composite
- 37.39/100
- National rank
- #8921
- State rank
- #274 of 535 in MO
Livability — Altenburg
- Score
- 60/100
- State rank
- #472
- US rank
- #18728
Category grades
Schools grade is shown separately in the Schools card above.
Census & demographics
- Census place
- Altenburg, MO
- Population (ZIP)
- 853
Population outlook (Perry County) Hauer SSP2
- Today (2025)
- 19,583 people
- By 2030
- 19,714 · +0.7%
- By 2040
- 19,695 · +0.6%
- By 2050
- 19,172 · -2.1%
- By 2075
- 17,199 · -12.2%
- By 2100
- 13,661 · -30.2%
Race, ethnicity, and origin ACS 2023
- Neighborhood character
- Predominantly White (94%)
- Race & ethnicity
- White 94% Two or more races 5% Black 2%
- Common ancestry
- Lithuanian 2% Romanian 1% Italian 1%
- Languages at home
- 99% English-only · German/W. Germanic 1%
Political lean MEDSL · Perry
- 2024 margin
- Solid R (+63.4) · D 17.9% · R 81.3%
- 2008→2024 swing
- -34.2pp toward R · 2008: -29.2pp · 2024: -63.4pp
- All cycles
- 2024: R+63.4 2020: R+63.4 2016: R+61.7 2012: R+43.6 2008: R+29.2
Not yet ingested
- Civics
- —
Market trends
- HPI YoY
- ▲ 3.74%
- Current HPI
- 235.6347
- Rent YoY
- —
- Metro
- —
- State GDP YoY
- ▲ 1.84%
- F500 in state
- 20
Industry mix (Fortune 500 HQ in MO)
| Industry | F500 HQs | Revenue |
|---|---|---|
| Healthcare | 1 | $163B |
|
||
| Insurance | 1 | $21B |
|
||
| Industrial Technology | 1 | $17B |
|
||
| Retail | 1 | $16B |
|
||
| Industrial Distribution | 1 | $10B |
|
||
| Utilities | 1 | $9B |
|
||
Price history
-24.5% since first listed10 events — show timeline
- 2026-02-09 Listed $60,000 MARIS as Distributed by MLS Grid
- 2026-01-22 Coming Soon $60,000 MARIS as Distributed by MLS Grid
- 2025-08-06 Relisted — MARIS as Distributed by MLS Grid
- 2025-08-06 Price Changed $65,000 MARIS as Distributed by MLS Grid
- 2025-03-27 Price Changed $70,000 MARIS as Distributed by MLS Grid
- 2024-12-02 Relisted — MARIS as Distributed by MLS Grid
- 2024-12-02 Price Changed $77,500 MARIS as Distributed by MLS Grid
- 2024-12-01 Delisted — MARIS as Distributed by MLS Grid
- 2024-09-04 Listed $79,500 MARIS as Distributed by MLS Grid
- 2007-07-27 Sold (Public Records) — Public Records
Property tax history
+4.3%/yrLatest (2025): $607 · +5.8% YoY. Source: county tax records.
Cash-flow waterfall
monthlySold comps — $/sqft
last 12 mo · ≤1 miLoading sold comps…