107 S Mccaskey Rd · Williamston, NC
Flood risk 1/10 · Minimal
- FEMA flood zone
- X (unshaded)
- Chance of flooding over 30 yrs
- 0.0%
- Est. flood insurance / yr
- $507 – $1,088
Fire risk 4/10 · Minor
- Est. fire insurance / yr
- $906 – $1,684
Heat risk 8/10 · Major
- Hot days now (above 107°F)
- 7 days/yr
- Hot days in 30 yrs
- 16 days/yr
Wind risk 8/10 · Major
- Chance of severe wind over 30 yrs
- 80.0%
Air-quality risk 1/10 · Minimal
- Unhealthy air days now
- 0 days/yr
- Unhealthy air days in 30 yrs
- 0 days/yr
Risk factors via First Street. Map © Google.
Why this score? — see what drove the C- grade
The composite is a weighted blend of 9 inputs, each scored 0–100. Each bar is that input's sub-score; the figure is the points it added to the 100-point composite (weight × sub-score).
- Cash flow +19.7/30.0
- Appreciation +7.6/10.0
- DSCR +6.2/10.0
- ARV discount +4.6/15.0
- 1% rule +4.4/10.0
- Livability +2.9/5.0
- Rent growth +2.5/5.0
- Condition / age +2.5/5.0
- Schools +2.4/10.0
$119,900
🖨 Deal sheet 📄 Offer letter ✓ Due diligence
Listing remarks
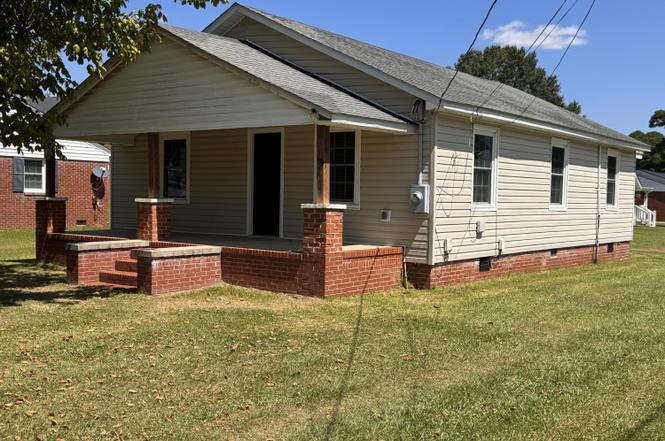
Charming Updated 1930's Bungalow in the Heart of Williamston! This classic home offers a welcoming front porch and plenty of character, blended with modern updates. Inside you'll find a freshly painted interior, new flooring throughout, and a formal dining room perfect for gatherings. An enclosed rear porch provides additional storage space, while an outbuilding with electricity offers extra functionality. Situated on a desirable corner lot, this home is move-in ready and full of charm.
Key facts
- Formal dining room
- Front porch
- Enclosed rear porch
Tags
Property features AI
Finance
- Other: Zoning: R6
Exterior
- Parking: On-site parking
- Utilities: Public water; Sewer connected; Water connected
- Home design: Single-family residence; One story
- Construction: Vinyl siding and frame construction; Metal and shingle roof; Crawl space / no basement
- Exterior features: Covered enclosed porch; Porch; Corner lot; Road frontage on city street and state road
Interior
- Kitchen: Range; Microwave
- Flooring: Carpet; Laminate
- Bathrooms: 1 full bathroom
- Heating & cooling: Heat pump heating; Electric heating; Heat pump cooling
- Interior features: Ceiling fan(s)
- Laundry & utility: Electric water heater
Neighborhood map
What this means for you Summary
Snapshot
- This is a 3-bed/1.0-bath single-family listed at $120k.
Deal economics
- At list price, monthly cash flow is $140 ($2k/yr) — positive.
- The deal already cash-flows at list — no discount required.
- To meet the 1% rule (rent ≥ 1% of price), the offer needs to be $112k (6.4% below list).
- Recommended offer: $106k (12.0% below list) — sets the bar for market timing.
- Cap rate 7.7% vs local median 4.6% in Williamston — top-decile yield for the area; either an underpriced asset or a hidden risk that comps aren't pricing in. Stress-test before assuming the spread holds.
Location & tenants
- Location reads 58/100 on livability (#584 in NC) — a working-class tenant base; expect higher turnover. Strengths: cost of living A+, health & safety A+, housing B+; Watch: crime F, amenities F, commute F.
- Martin County Schools (rural): math 24% / reading 34% proficiency, ranked #150 of 178 in NC (top 84%) — low school quality limits family demand, transient renter base, plan for 1-2y turnover; 62% free/reduced lunch — lower-income household profile, screen leases tightly.
- Zoned schools: E J Hayes Elementary (math 28% / reading 35%, grade F, #945 of 1,410 statewide, top 68%, 273 students, 99% FRL); Riverside Middle (math 18% / reading 33%, grade F, #388 of 475 statewide, top 83%, 364 students, 99% FRL); Riverside High (math 22% / reading 37%, grade F, #459 of 535 statewide, top 87%, 447 students, 99% FRL) — zoned schools average 99% FRL vs 62% district-wide (37 pts higher); higher-poverty schools than district average — tighter screening recommended.
- Market conditions: 72 active listings in the ZIP.
Forward outlook
- In year one you build about $7k of equity ($829 loan paydown + $6k appreciation (5.1% local appreciation)).
- Martin County population projected at -33% by 2050 — secular population decline; favor cash flow + early exit over multi-decade hold.
- At projected returns (5.1% appreciation + 3.0% rent growth), your $34k cash investment doubles in ~4 years — after that, you're playing with house money.
- By year 5, paydown + projected appreciation supports a ~$30k cash-out refi (75% LTV) — recoverable capital for the next deal without selling this one.
Negotiation context
- It's been on market 295 days — a 12% lower offer ($106k) is reasonable based on typical stale-listing flexibility.
- 2 sale attempts; this cycle's ask has dropped $30k (20%) from the opening price — seller is motivated, your offer sets the floor, not the list.
Risks & watch-outs
- Watch-outs: built in 1938 — expect roof / HVAC / electrical / plumbing capex.
- Climate carrying-cost: severe wind risk, 80% chance of damaging wind over 30y; extreme-heat days projected 7→16/yr by 2055 (HVAC capex compounding) — expect insurance premiums to compound above CPI over the hold.
Questions for the listing agent
- It's been on market 295 days. Have you received any prior offers? Is the seller open to a 12% concession, seller financing, or rate buy-down credit?
- Built in 1938 — when were the roof, HVAC, electrical panel, plumbing, and water heater last replaced?
- Why hasn't it sold? Are there any deal-killer items the seller is aware of (foundation, flood, title, zoning, code violations)?
- Is there a deadline driving the sale (1031 exchange, divorce, estate, relocation)? That informs how much negotiation room exists.
- Schools are D-rated, which usually means shorter tenancies and higher turnover. Who's the typical renter profile here, and what's been the actual vacancy rate?
- Crime grade is F in this area — have there been break-ins, vandalism, or insurance claims at this property in the last 3 years? What carrier currently insures it and at what premium?
- What's the average days-on-market for RENTAL listings here right now (not sales)? A rising rental-DOM trend means longer vacancies and softer asking-rent achievability than the comps imply.
- What's the recent tenant-quality profile in this submarket — average credit score on applications, eviction rate, late-payment / NSF rate, and stable-employment percentage? A property-management company in the area should have these aggregated.
- How much new for-sale + rental construction is in the pipeline within 1–3 miles? Heavy new supply typically softens prices + rents 12–24 months out; constrained supply supports both.
Investment metrics
- 1% rule
- 0.94% ✗
- Cap rate
- 7.70%
- Cash-on-cash
- 5.01%
- DSCR
- 1.22
- GRM
- 8.9
CMA / ARV
- ARV (on-the-fly)
- $112,608
- Comps found
- 12
Show comp detail 12 sales within ~0.75 mi
| Address | Dist | Beds/Ba | Sqft | Sold | Price | $/sf | Match |
|---|---|---|---|---|---|---|---|
| 204 Fairview St | 0.22mi | 3/2.0 | 1,189 (-3%) | 1mo | $152,000 | $128 | 80 |
| 108 N Park Ave | 0.19mi | 3/1.0 | 1,350 (+10%) | 5mo | $124,500 | $92 | 70 |
| 1623 W Main St | 0.14mi | 2/1.0 (-1) | 1,281 (+5%) | 15mo | $45,000 | $35 | 68 |
| 1300 W Main St | 0.19mi | 2/1.0 (-1) | 1,104 (-10%) | 11mo | $75,000 | $68 | 61 |
| 100 Brownlow Ave | 0.52mi | 3/1.5 | 1,254 (+2%) | 12mo | $75,000 | $60 | 60 |
| 803 W Church St | 0.75mi | 3/1.0 | 1,248 (+2%) | 4mo | $45,000 | $36 | 58 |
| 212 Morris St | 0.70mi | 3/1.5 | 1,256 (+3%) | 4mo | $102,500 | $82 | 57 |
| 109 Woodside Ave | 0.43mi | 3/2.0 | 1,327 (+8%) | 13mo | $210,000 | $158 | 51 |
| 106 Martin Ave | 0.36mi | 3/2.0 | 1,366 (+12%) | 15mo | $148,000 | $108 | 48 |
| 105 N Park Ave | 0.16mi | 2/2.0 (-1) | 1,053 (-14%) | 20mo | $149,900 | $142 | 44 |
| 110 Price St | 0.61mi | 3/2.0 | 1,330 (+9%) | 13mo | $120,000 | $90 | 42 |
| 210 Faulk St | 0.74mi | 3/2.0 | 1,074 (-12%) | 4mo | $143,000 | $133 | 38 |
Match score weights: distance 35% · size 25% · config 20% · recency 20%. Top-matched comps best support the ARV.
Projected returns pro-forma
5.13% appreciation · 3.0% rent growth · sell at horizon
- IRR
- 17.4%
- Equity multiple
- 2.11×
- Total profit
- $37,391
- Equity at exit
- $68,858
- IRR
- 17.5%
- Equity multiple
- 4.12×
- Total profit
- $104,875
- Equity at exit
- $119,601
Cash invested: $33,572 (down + closing). Projections, not guarantees.
Landlord ↔ Tenant lean methodology
- Overall (STATE)
- 85 Strongly Landlord-Friendly
- State North Carolina
- 85 Strongly Landlord-Friendly · R+3
- County
- — inherits STATE
- City
- — inherits STATE
ZIP-level market 27892
- Home prices YoY
- 3.0%
- Active inventory
- 72
- Price-to-rent
- 8.9×
Monthly cashflow live
- Estimated rent
- $1,123 medium interval (Pro) →
- Mortgage (P&I)
- −$629
- Tax from tax record
- −$68 /mo · $816/yr
- Insurance
- −$50
- HOA
- −$0
- Vacancy / Maint / Mgmt
- −$236
- Net cashflow
- $140
Break-even live
UW: 25.0% down · 7.5% · 30yr · 1.5% tax · 5.0% vac · 8.0% maint · 8.0% mgmt
Financing live
Cash to close
- Down payment
- $29,975
- Closing costs
- $3,597
- Reserves months
- —
- Total cash needed
- —
Loan-product check · same deal, 3 products live
Conventional
25% down · 7.5% · 30yr
- Down + closing
- —
- Monthly P&I
- —
- Monthly cashflow
- —
- DSCR
- —
- Eligible?
- —
Personal DTI + credit; lowest rate.
DSCR
20% down · 8.5% · 30yr
- Down + closing
- —
- Monthly P&I
- —
- Monthly cashflow
- —
- DSCR
- —
- Eligible?
- —
No personal income docs; deal must DSCR.
Hard money
10% down · 12.0% · 12mo
- Down + closing
- —
- Monthly P&I
- —
- Monthly cashflow
- —
- DSCR
- —
- Eligible?
- —
Short-term bridge; refi at stabilization.
Listing history 21 events
-
2026-06-19days on market $119,900 Active 295 DOM
-
2026-06-18days on market $119,900 Active 294 DOM
-
2026-06-17days on market $119,900 Active 293 DOM
-
2026-06-16days on market $119,900 Active 292 DOM
-
2026-06-15days on market $119,900 Active 291 DOM
-
2026-06-14days on market $119,900 Active 289 DOM
-
2026-06-12days on market $119,900 Active 288 DOM
-
2026-06-09days on market $119,900 Active 285 DOM
-
2026-06-08days on market $119,900 Active 284 DOM
-
2026-06-07days on market $119,900 Active 283 DOM
-
2026-06-03days on market $119,900 Active 279 DOM
-
2026-06-02days on market $119,900 Active 278 DOM
-
2026-06-01days on market $119,900 Active 277 DOM
-
2026-05-31days on market $119,900 Active 276 DOM
-
2026-05-30days on market $119,900 Active 275 DOM
-
2026-05-01status Active
-
2026-04-30historical
-
2026-03-18price $119,900
-
2025-10-29price $129,900
-
2025-09-18price $139,900
-
2025-08-27$149,900 Active
ⓘ Source: listings_history table (triggers on properties + properties_extension) + one-shot
backfill from property_details.listing_events for pre-trigger history.
Tax reassessment forecast NC · Resets to sale price
- Current annual tax
- $816 · $68/mo
- Projected year-2 tax
- $983 · $82/mo
- Expected delta
- +$167/yr (+$14/mo · 20.5%)
ⓘ Screening estimate from a state-policy table — verify with the county assessor before closing.
Climate risk First Street
- Flood 1/10 Low FEMA zone X (unshaded) · 0% chance over 30 yrs
- Wildfire 4/10 Moderate
- Heat 8/10 Severe 7 d/yr ≥107°F today · 16 d/yr by 30 yrs out
- Wind 8/10 Severe 80% chance of damaging wind over 30 yrs
- Air quality 1/10 Low 0 unhealthy d/yr today · 0 by 30 yrs out
Nearby sold comps map
Loading sold comps map…
Walkable amenities ~0.75 mi
Loading nearby amenities…
Taxation est. · year 1
- Rental income
- $13,473
- − Mortgage interest
- −$6,716
- − Property taxes
- −$816
- − Insurance
- −$600
- − Repairs & maintenance
- −$1,078
- − Management
- −$1,078
- − Depreciation
- −$3,488
- Taxable loss
- −$303
- Est. tax savings @ 24.0%
- +$73
- After-tax cash flow
- $1,755/yr
For passive investors: Depreciation is non-cash, so a rental often shows a tax loss while cash-flowing — sheltering income. Rental losses are passive: they offset passive income freely, and up to $25,000/yr can offset ordinary (W-2) income if you actively participate and your MAGI is under $100k (phasing out to $0 by $150k); unused losses carry forward. On sale, claimed depreciation is recaptured at up to 25%, and gains may owe capital-gains tax (a 1031 exchange can defer both). Figures are a year-1 estimate at your 24.0% rate — not tax advice; consult a CPA.
Schools (NCES district)
- District
- Martin County Schools
- NCES district ID
- 3702880
- Math proficiency
- 24% ▼ -2.00%
- Reading proficiency
- 34% ▲ 1.00%
- Median HH income
- $35,403
- Composite
- 23.94/100
- National rank
- #7781
- State rank
- #150 of 178 in NC
Livability — Williamston
- Score
- 58/100
- State rank
- #584
- US rank
- #21504
Category grades
Schools grade is shown separately in the Schools card above.
Census & demographics
- Census place
- Williamston, NC
- Population (ZIP)
- 13,387
Population outlook (Martin County) Hauer SSP2
- Today (2025)
- 21,018 people
- By 2030
- 19,693 · -6.3%
- By 2040
- 16,793 · -20.1%
- By 2050
- 14,171 · -32.6%
- By 2075
- 9,804 · -53.4%
- By 2100
- 6,894 · -67.2%
Race, ethnicity, and origin ACS 2023
- Neighborhood character
- Diverse neighborhood (Simpson 0.57)
- Race & ethnicity
- White 53% Black 38% Two or more races 5% Hispanic / Latino 5%
- Hispanic origin (detail)
- Mexican 4%
- Common ancestry
- Slovak 2% Serbian 1% Iranian 1%
- Foreign-born
- 2% · Canada, China
- Languages at home
- 94% English-only · Spanish 5% Chinese 1%
Political lean MEDSL · Martin
- 2024 margin
- R (+10.3) · D 44.6% · R 54.9%
- 2008→2024 swing
- -15.0pp toward R · 2008: 4.6pp · 2024: -10.3pp
- All cycles
- 2024: R+10.3 2020: R+5.0 2016: R+0.5 2012: D+4.4 2008: D+4.6
Not yet ingested
- Civics
- —
Market trends
- HPI YoY
- ▲ 5.13%
- Current HPI
- 178.4817
- Rent YoY
- —
- Metro
- —
- State GDP YoY
- ▲ 3.28%
- F500 in state
- 26
Industry mix (Fortune 500 HQ in NC)
| Industry | F500 HQs | Revenue |
|---|---|---|
| Financial Services | 2 | $213B |
|
||
| Retail | 2 | $95B |
|
||
| Industrial Conglomerate | 1 | $38B |
|
||
| Metals / Steel | 1 | $35B |
|
||
| Utilities | 1 | $30B |
|
||
| Industrial Machinery | 1 | $19B |
|
||
Price history
-20.0% since first listed6 events — show timeline
- 2026-05-01 Relisted — Hive MLS
- 2026-04-30 Listing Removed — Hive MLS
- 2026-03-18 Price Changed $119,900 Hive MLS
- 2025-10-29 Price Changed $129,900 Hive MLS
- 2025-09-18 Price Changed $139,900 Hive MLS
- 2025-08-27 Listed $149,900 Hive MLS
Property tax history
+2.9%/yrLatest (2025): $816 · +70.7% YoY. Source: county tax records.
Cash-flow waterfall
monthlySold comps — $/sqft
last 12 mo · ≤1 miLoading sold comps…