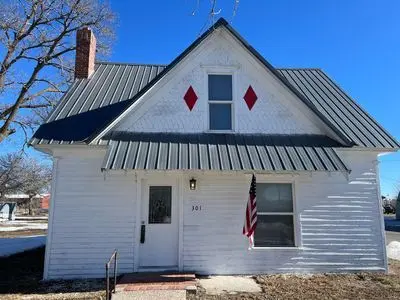
301 Lincoln St · Farnam, NE
Flood risk No data
- FEMA flood zone
- —
- Chance of flooding over 30 yrs
- —
- Est. flood insurance / yr
- —
Fire risk No data
- Est. fire insurance / yr
- —
Heat risk 3/10 · Minor
- Hot days now (above threshold)
- 7 days/yr
- Hot days in 30 yrs
- 17 days/yr
Wind risk No data
- Chance of severe wind over 30 yrs
- —
Air-quality risk 1/10 · Minimal
- Unhealthy air days now
- 0 days/yr
- Unhealthy air days in 30 yrs
- 0 days/yr
Risk factors via First Street. Map © Google.
Why this score? — see what drove the A- grade
The composite is a weighted blend of 9 inputs, each scored 0–100. Each bar is that input's sub-score; the figure is the points it added to the 100-point composite (weight × sub-score).
- Cash flow +30.0/30.0
- ARV discount +15.0/15.0
- DSCR +10.0/10.0
- 1% rule +9.9/10.0
- Appreciation +7.3/10.0
- Schools +4.1/10.0
- Livability +3.2/5.0
- Rent growth +2.5/5.0
- Condition / age +2.5/5.0
$74,900
🖨 Deal sheet 📄 Offer letter ✓ Due diligence
Listing remarks
Nice sized home in a quiet town that helps everyone in need. This is a two story home with two bedrooms upstairs and one on the main floor. It has one bathroom, a large living area with tile and carpet. Galley kitchen and a laundry room. All appliances are included. Has a wood deck and large yard with nice trees. Also has a fireplace and lots of wood in the area that people will beg you to cut and haul off to burn. It has a newer furnace and 1 year old ac unit which provides central heat and central air. A newer gas water heater. Furnace and water heater are in the basement.
Key facts
- Wood deck
- Newer furnace
- Galley kitchen
Tags
Neighborhood map
What this means for you Summary
Snapshot
- This is a 3-bed/1.0-bath single-family listed at $75k.
Deal economics
- At list price, monthly cash flow is $439 ($5k/yr) — positive.
- The deal already cash-flows at list — no discount required.
- Meets the 1% rule at list price ($1k rent vs $75k).
Location & tenants
- Location reads 63/100 on livability (#398 in NE) — a middle-class / working-renter tenant base. Strengths: cost of living A+, housing A; Watch: health & safety C-, schools D+, amenities F.
- Eustis-Farnam Public Schools (rural): math 45% / reading 45% proficiency, ranked #175 of 245 in NE (top 71%) — families likely to look elsewhere, expect single-tenant / working-renter base with shorter leases.
- Market conditions: 8 active listings in the ZIP; 61 units permitted in Dawson County in 2024 (36 in 5+ unit buildings).
Forward outlook
- In year one you build about $4k of equity ($518 loan paydown + $4k appreciation (4.7% local appreciation)).
- Dawson County population projected to shrink 8% by 2050 — rents likely to lag national; underwrite the cash flow, not the appreciation.
- At projected returns (4.7% appreciation + 3.0% rent growth), your $21k cash investment doubles in ~3 years — after that, you're playing with house money.
- By year 8, paydown + projected appreciation supports a ~$30k cash-out refi (75% LTV) — recoverable capital for the next deal without selling this one.
Negotiation context
- Only 1 days on market — expect competitive offers; lowballing is unlikely to land.
- Current owner paid $20k; list at $75k implies a 274% gain — meaningful room to come down on a strong offer.
Risks & watch-outs
- Watch-outs: built in 1900 — expect roof / HVAC / electrical / plumbing capex.
Questions for the listing agent
- Built in 1900 — when were the roof, HVAC, electrical panel, plumbing, and water heater last replaced?
- Is there a deadline driving the sale (1031 exchange, divorce, estate, relocation)? That informs how much negotiation room exists.
- Schools are D-rated, which usually means shorter tenancies and higher turnover. Who's the typical renter profile here, and what's been the actual vacancy rate?
- What's the average days-on-market for RENTAL listings here right now (not sales)? A rising rental-DOM trend means longer vacancies and softer asking-rent achievability than the comps imply.
- What's the recent tenant-quality profile in this submarket — average credit score on applications, eviction rate, late-payment / NSF rate, and stable-employment percentage? A property-management company in the area should have these aggregated.
- How much new for-sale + rental construction is in the pipeline within 1–3 miles? Heavy new supply typically softens prices + rents 12–24 months out; constrained supply supports both.
Investment metrics
- 1% rule
- 1.49% ✓
- Cap rate
- 13.33%
- Cash-on-cash
- 25.12%
- DSCR
- 2.12
- GRM
- 5.6
CMA / ARV
- ARV (on-the-fly)
- $91,580
- Comps found
- 1
Show comp detail 1 sale within ~0.75 mi
| Address | Dist | Beds/Ba | Sqft | Sold | Price | $/sf | Match |
|---|---|---|---|---|---|---|---|
| 511 Carson St | 0.19mi | 3/1.0 | 1,184 (-2%) | 21mo | $90,000 | $76 | 71 |
Match score weights: distance 35% · size 25% · config 20% · recency 20%. Top-matched comps best support the ARV.
Projected returns pro-forma
4.69% appreciation · 3.0% rent growth · sell at horizon
- IRR
- 34.2%
- Equity multiple
- 3.09×
- Total profit
- $43,875
- Equity at exit
- $41,034
- IRR
- 32.9%
- Equity multiple
- 6.20×
- Total profit
- $109,068
- Equity at exit
- $69,680
Cash invested: $20,972 (down + closing). Projections, not guarantees.
Landlord ↔ Tenant lean methodology
- Overall (STATE)
- 83 Strongly Landlord-Friendly
- State Nebraska
- 83 Strongly Landlord-Friendly · R+13
- County
- — inherits STATE
- City
- — inherits STATE
ZIP-level market 69029
- Home prices YoY
- 2.8%
- Active inventory
- 8
- Price-to-rent
- 5.6×
Monthly cashflow live
- Estimated rent
- $1,119 medium interval (Pro) →
- Mortgage (P&I)
- −$393
- Tax from tax record
- −$21 /mo · $251/yr
- Insurance
- −$31
- HOA
- −$0
- Vacancy / Maint / Mgmt
- −$235
- Net cashflow
- $439
Break-even live
UW: 25.0% down · 7.5% · 30yr · 1.5% tax · 5.0% vac · 8.0% maint · 8.0% mgmt
Financing live
Cash to close
- Down payment
- $18,725
- Closing costs
- $2,247
- Reserves months
- —
- Total cash needed
- —
Loan-product check · same deal, 3 products live
Conventional
25% down · 7.5% · 30yr
- Down + closing
- —
- Monthly P&I
- —
- Monthly cashflow
- —
- DSCR
- —
- Eligible?
- —
Personal DTI + credit; lowest rate.
DSCR
20% down · 8.5% · 30yr
- Down + closing
- —
- Monthly P&I
- —
- Monthly cashflow
- —
- DSCR
- —
- Eligible?
- —
No personal income docs; deal must DSCR.
Hard money
10% down · 12.0% · 12mo
- Down + closing
- —
- Monthly P&I
- —
- Monthly cashflow
- —
- DSCR
- —
- Eligible?
- —
Short-term bridge; refi at stabilization.
Listing history 5 events
-
2026-05-26$74,900 Active
-
2020-03-16soldstatus $20,000
-
2005-04-03soldstatus $39,900
-
2003-05-28soldstatus $39,900
-
2001-04-19soldstatus $8,000
ⓘ Source: listings_history table (triggers on properties + properties_extension) + one-shot
backfill from property_details.listing_events for pre-trigger history.
Tax reassessment forecast NE · Resets to sale price
- Current annual tax
- $251 · $21/mo
- Projected year-2 tax
- $1,296 · $108/mo
- Expected delta
- +$1,045/yr (+$87/mo · 416.7%)
ⓘ Screening estimate from a state-policy table — verify with the county assessor before closing.
Climate risk First Street
- Heat 3/10 Moderate
- Air quality 1/10 Low 0 unhealthy d/yr today · 0 by 30 yrs out
Nearby sold comps map
Loading sold comps map…
Walkable amenities ~0.75 mi
Loading nearby amenities…
Taxation est. · year 1
- Rental income
- $13,428
- − Mortgage interest
- −$4,196
- − Property taxes
- −$251
- − Insurance
- −$374
- − Repairs & maintenance
- −$1,074
- − Management
- −$1,074
- − Depreciation
- −$2,179
- Taxable income
- $4,279
- Est. tax owed @ 24.0%
- −$1,027
- After-tax cash flow
- $4,242/yr
For passive investors: Depreciation is non-cash, so a rental often shows a tax loss while cash-flowing — sheltering income. Rental losses are passive: they offset passive income freely, and up to $25,000/yr can offset ordinary (W-2) income if you actively participate and your MAGI is under $100k (phasing out to $0 by $150k); unused losses carry forward. On sale, claimed depreciation is recaptured at up to 25%, and gains may owe capital-gains tax (a 1031 exchange can defer both). Figures are a year-1 estimate at your 24.0% rate — not tax advice; consult a CPA.
Schools (NCES district)
- District
- Eustis-Farnam Public Schools
- NCES district ID
- 3100111
- Math proficiency
- 45% ▬ 0.00%
- Reading proficiency
- 45% ▬ 0.00%
- Median HH income
- $53,125
- Composite
- 41.16/100
- National rank
- #7417
- State rank
- #175 of 245 in NE
Livability — Farnam
- Score
- 63/100
- State rank
- #398
- US rank
- #15134
Category grades
Schools grade is shown separately in the Schools card above.
Census & demographics
- Census place
- Farnam, NE
- Population (ZIP)
- 293
Population outlook (Dawson County) Hauer SSP2
- Today (2025)
- 23,318 people
- By 2030
- 22,912 · -1.7%
- By 2040
- 22,097 · -5.2%
- By 2050
- 21,358 · -8.4%
- By 2075
- 19,801 · -15.1%
- By 2100
- 17,647 · -24.3%
Race, ethnicity, and origin ACS 2023
- Neighborhood character
- Predominantly White (98%)
- Race & ethnicity
- White 98% Two or more races 2%
- Common ancestry
- Romanian 5% Portuguese 2% Lithuanian 1%
- Languages at home
- 99% English-only · Spanish 1%
Political lean MEDSL · Dawson
- 2024 margin
- Solid R (+49.6) · D 24.7% · R 74.3%
- 2008→2024 swing
- -11.3pp toward R · 2008: -38.3pp · 2024: -49.6pp
- All cycles
- 2024: R+49.6 2020: R+43.8 2016: R+45.0 2012: R+41.8 2008: R+38.3
Not yet ingested
- Civics
- —
Market trends
- HPI YoY
- ▲ 4.69%
- Current HPI
- 174.1236
- Rent YoY
- —
- Metro
- —
- State GDP YoY
- ▲ 0.68%
- F500 in state
- 2
Industry mix (Fortune 500 HQ in NE)
| Industry | F500 HQs | Revenue |
|---|---|---|
| Conglomerate | 1 | $371B |
|
||
Price history
+836.3% since first listed5 events — show timeline
- 2026-05-26 Listed $74,900 FSBO.com
- 2020-03-16 Sold (Public Records) $20,000 Public Records
- 2005-04-03 Sold (Public Records) $39,900 Public Records
- 2003-05-28 Sold (Public Records) $39,900 Public Records
- 2001-04-19 Sold (Public Records) $8,000 Public Records
Property tax history
-0.2%/yrLatest (2025): $251 · +38.2% YoY. Source: county tax records.
Cash-flow waterfall
monthlySold comps — $/sqft
last 12 mo · ≤1 miLoading sold comps…