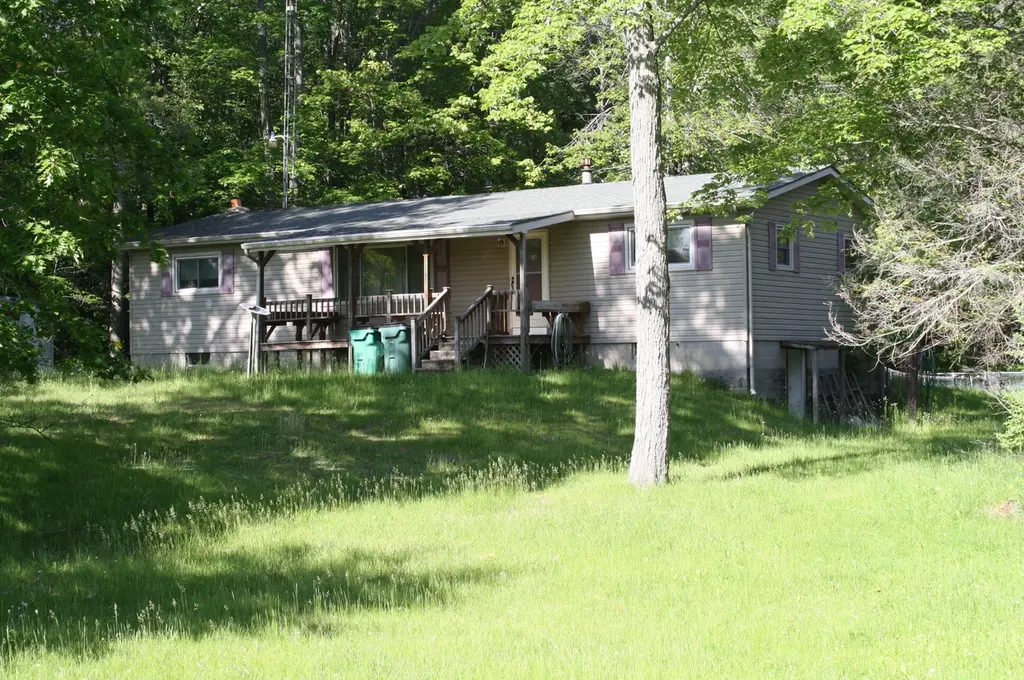
2975 Coville Rd · Greenbush, MI
Flood risk 1/10 · Minimal
- FEMA flood zone
- X (unshaded)
- Chance of flooding over 30 yrs
- 0.0%
- Est. flood insurance / yr
- $507 – $1,088
Fire risk 4/10 · Minor
- Est. fire insurance / yr
- $784 – $1,456
Heat risk 1/10 · Minimal
- Hot days now (above 94°F)
- 7 days/yr
- Hot days in 30 yrs
- 13 days/yr
Wind risk 1/10 · Minimal
- Chance of severe wind over 30 yrs
- —
Air-quality risk 2/10 · Minimal
- Unhealthy air days now
- 0 days/yr
- Unhealthy air days in 30 yrs
- 1 days/yr
Risk factors via First Street. Map © Google.
Why this score? — see what drove the D+ grade
The composite is a weighted blend of 9 inputs, each scored 0–100. Each bar is that input's sub-score; the figure is the points it added to the 100-point composite (weight × sub-score).
- Cash flow +20.2/30.0
- ARV discount +7.5/15.0
- DSCR +6.4/10.0
- 1% rule +5.2/10.0
- Schools +2.9/10.0
- Rent growth +2.5/5.0
- Livability +2.5/5.0
- Condition / age +2.5/5.0
- Appreciation +0.0/10.0
$140,000
🖨 Deal sheet (PDF) 📄 Offer letter ✓ Due diligence
Listing remarks
Welcome to 2975 Coville Road, Mikado where opportunity awaits on this expansive 4.9-acre corner parcel, offering space, privacy, and flexibility for your vision. The property features a detached garage and two additional outbuildings. For those dreaming of a hobby farm, this property is already set up with a barn featuring two stalls, and a fenced corral. The large fenced in back yard is ideal for animals, gardening, or outdoor enjoyment. The home itself is a fixer upper in need of significant repairs and updates to restore it to its full potential. While a furnace, well and septic system are present, none have been operational for several years, and their current condition is unknown. Brin
Key facts
- Fenced corral
- Detached garage
- 4.9 acre lot
Tags
Property features AI
Finance
- Other: Horses allowed with boarding facilities
Exterior
- Parking: Detached heated garage with garage door opener; 2 garage spaces
- Utilities: Well water; Septic system
- Home design: Single-family residence; Residential acreage setting (approximately 4.9 acres)
- Construction: Has full basement with walk-out access
- Exterior features: Deck; Barn(s); Second detached garage; Paved road access
Interior
- Kitchen: Dishwasher; Oven; Range; Refrigerator
- Bedrooms: Master on main level
- Bathrooms: 2 full bathrooms
- Heating & cooling: Baseboard heating; Hot water heating; Propane heating
- Interior features: Master bedroom located on the main level; Full walk-out basement
- Laundry & utility: Washer; Dryer; Laundry room in basement
Neighborhood map
What this means for you Summary
Snapshot
- This is a 3-bed/2.0-bath single-family listed at $140k.
Deal economics
- At list price, monthly cash flow is $176 ($2k/yr) — positive.
- The deal already cash-flows at list — no discount required.
- Meets the 1% rule at list price ($1k rent vs $140k).
Location & tenants
- Location reads: area grade D — affects rentability + tenant quality, not the cash-flow math above.
- Oscoda Area Schools (rural): math 31% / reading 38% proficiency, ranked #313 of 540 in MI (top 58%) — families likely to look elsewhere, expect single-tenant / working-renter base with shorter leases.
- Zoned schools: Richardson Elementary School (math 37% / reading 35%, grade F, #725 of 1,397 statewide, top 52%, 672 students, 68% FRL); Oscoda Area High School (math 22% / reading 42%, grade F, #405 of 713 statewide, top 59%, 477 students, 64% FRL).
- Market conditions: 8 active listings in the ZIP; 38 units permitted in Alcona County in 2024 (0 in 5+ unit buildings).
Forward outlook
- Local home prices are declining (-3.0%/yr); year-one equity from $968 of loan paydown is wiped out by about $4k of value loss. Plan a longer hold.
- Alcona County population projected at -37% by 2050 — secular population decline; favor cash flow + early exit over multi-decade hold.
Negotiation context
- Only 11 days on market — expect competitive offers; lowballing is unlikely to land.
- Current owner paid $97k; 44% above their basis — modest negotiation headroom, anchor on the comps not their cost.
Questions for the listing agent
- Is there a deadline driving the sale (1031 exchange, divorce, estate, relocation)? That informs how much negotiation room exists.
- The area grade is low — what's the realistic commute time and amenity access for the typical tenant pool here? Any planned neighborhood developments (good or bad) we should know about?
- What's the average days-on-market for RENTAL listings here right now (not sales)? A rising rental-DOM trend means longer vacancies and softer asking-rent achievability than the comps imply.
- What's the recent tenant-quality profile in this submarket — average credit score on applications, eviction rate, late-payment / NSF rate, and stable-employment percentage? A property-management company in the area should have these aggregated.
- How much new for-sale + rental construction is in the pipeline within 1–3 miles? Heavy new supply typically softens prices + rents 12–24 months out; constrained supply supports both.
Investment metrics
- 1% rule
- 1.02% ✓
- Cap rate
- 7.80%
- Cash-on-cash
- 5.40%
- DSCR
- 1.24
- GRM
- 8.2
CMA / ARV
No comps found within radius.
Projected returns pro-forma
-3.0% appreciation · 3.0% rent growth · sell at horizon
- IRR
- -7.9%
- Equity multiple
- 0.71×
- Total profit
- $-11,448
- Equity at exit
- $20,874
- IRR
- 1.6%
- Equity multiple
- 1.12×
- Total profit
- $4,538
- Equity at exit
- $12,105
Cash invested: $39,200 (down + closing). Projections, not guarantees.
Landlord ↔ Tenant lean methodology
- Overall (STATE)
- 62 Landlord-Friendly
- State Michigan
- 62 Landlord-Friendly · EVEN
- County
- — inherits STATE
- City
- — inherits STATE
ZIP-level market 48745
- Home prices YoY
- -9.2%
- Active inventory
- 8
- Price-to-rent
- 8.2×
Monthly cashflow live
- Estimated rent
- $1,430 medium interval (Pro) →
- Mortgage (P&I)
- −$734
- Tax from tax record
- −$161 /mo · $1,929/yr
- Insurance
- −$58
- HOA
- −$0
- Vacancy / Maint / Mgmt
- −$300
- Net cashflow
- $176
Break-even live
Sensitivity live
| Price | -10% $255 | -5% $216 | +0% $176 | +5% $137 | +10% $97 |
|---|---|---|---|---|---|
| Rent | -10% $63 | -5% $120 | +0% $176 | +5% $233 | +10% $289 |
| Rate | -1.0pp $247 | -0.5pp $212 | base $176 | +0.5pp $140 | +1.0pp $103 |
UW: 25.0% down · 7.5% · 30yr · 1.5% tax · 5.0% vac · 8.0% maint · 8.0% mgmt
Financing live
Cash to close
- Down payment
- $35,000
- Closing costs
- $4,200
- Reserves months
- —
- Total cash needed
- —
Loan-product check · same deal, 3 products live
Conventional
25% down · 7.5% · 30yr
- Down + closing
- —
- Monthly P&I
- —
- Monthly cashflow
- —
- DSCR
- —
- Eligible?
- —
Personal DTI + credit; lowest rate.
DSCR
20% down · 8.5% · 30yr
- Down + closing
- —
- Monthly P&I
- —
- Monthly cashflow
- —
- DSCR
- —
- Eligible?
- —
No personal income docs; deal must DSCR.
Hard money
10% down · 12.0% · 12mo
- Down + closing
- —
- Monthly P&I
- —
- Monthly cashflow
- —
- DSCR
- —
- Eligible?
- —
Short-term bridge; refi at stabilization.
Listing history 10 events
-
2026-06-22days on market $140,000 Active 11 DOM
-
2026-06-21days on market $140,000 Active 10 DOM
-
2026-06-21days on market $140,000 Active 9 DOM
-
2026-06-18days on market $140,000 Active 7 DOM
-
2026-06-17days on market $140,000 Active 6 DOM
-
2026-06-16days on market $140,000 Active 5 DOM
-
2026-06-15days on market $140,000 Active 4 DOM
-
2026-06-13days on market $140,000 Active 2 DOM
-
2026-06-12remarks 699-char remark
-
2026-06-12$140,000 Active 1 DOM
ⓘ Source: listings_history table (triggers on properties + properties_extension) + one-shot
backfill from property_details.listing_events for pre-trigger history.
Tax reassessment forecast MI · Partial reset (capped growth)
- Current annual tax
- $1,929 · $161/mo
- Projected year-2 tax
- $2,043 · $170/mo
- Expected delta
- +$113/yr (+$9/mo · 5.9%)
ⓘ Screening estimate from a state-policy table — verify with the county assessor before closing.
Climate risk First Street
- Flood 1/10 Low FEMA zone X (unshaded) · 0% chance over 30 yrs
- Wildfire 4/10 Moderate
- Heat 1/10 Low 7 d/yr ≥94°F today · 13 d/yr by 30 yrs out
- Wind 1/10 Low
- Air quality 2/10 Low 0 unhealthy d/yr today · 1 by 30 yrs out
Nearby sold comps map
Loading sold comps map…
Walkable amenities ~0.75 mi
Loading nearby amenities…
Taxation est. · year 1
- Rental income
- $17,157
- − Mortgage interest
- −$7,842
- − Property taxes
- −$1,929
- − Insurance
- −$700
- − Repairs & maintenance
- −$1,373
- − Management
- −$1,373
- − Depreciation
- −$4,073
- Taxable loss
- −$132
- Est. tax savings @ 24.0%
- +$32
- After-tax cash flow
- $2,147/yr
For passive investors: Depreciation is non-cash, so a rental often shows a tax loss while cash-flowing — sheltering income. Rental losses are passive: they offset passive income freely, and up to $25,000/yr can offset ordinary (W-2) income if you actively participate and your MAGI is under $100k (phasing out to $0 by $150k); unused losses carry forward. On sale, claimed depreciation is recaptured at up to 25%, and gains may owe capital-gains tax (a 1031 exchange can defer both). Figures are a year-1 estimate at your 24.0% rate — not tax advice; consult a CPA.
Schools (NCES district)
- District
- Oscoda Area Schools
- NCES district ID
- 2626970
- Math proficiency
- 31% ▼ -7.00%
- Reading proficiency
- 38% ▼ -9.00%
- Median HH income
- $36,275
- Composite
- 28.6/100
- National rank
- #6714
- State rank
- #313 of 540 in MI
Livability — Greenbush
No livability data for this city. (Only ~50 U.S. cities are tracked.)
Census & demographics
- Population (ZIP)
- 1,189
Population outlook (Alcona County) Hauer SSP2
- Today (2025)
- 9,071 people
- By 2030
- 8,331 · -8.2%
- By 2040
- 6,852 · -24.5%
- By 2050
- 5,691 · -37.3%
- By 2075
- 4,229 · -53.4%
- By 2100
- 3,149 · -65.3%
Race, ethnicity, and origin ACS 2023
- Neighborhood character
- Predominantly White (94%)
- Race & ethnicity
- White 94% Two or more races 3% Native American 1%
- Common ancestry
- Romanian 8% Lithuanian 6% Slovak 5%
- Foreign-born
- 1%
- Languages at home
- 98% English-only · Russian/Polish/Slavic 1% Arabic 1%
Political lean MEDSL · Alcona
- 2024 margin
- Solid R (+41.7) · D 28.6% · R 70.3% · Other 1.1%
- 2008→2024 swing
- -33.8pp toward R · 2008: -7.9pp · 2024: -41.7pp
- All cycles
- 2024: R+41.7 2020: R+38.3 2016: R+40.0 2012: R+18.2 2008: R+7.9
Not yet ingested
- Civics
- —
Market trends
- HPI YoY
- ▼ -17.07%
- Current HPI
- 167.8881
- Rent YoY
- —
- Metro
- —
- State GDP YoY
- ▲ 1.37%
- F500 in state
- 28
Industry mix (Fortune 500 HQ in MI)
| Industry | F500 HQs | Revenue |
|---|---|---|
| Automotive Parts | 3 | $48B |
|
||
| Automotive | 2 | $372B |
|
||
| Chemicals | 1 | $45B |
|
||
| Automotive Retail | 1 | $29B |
|
||
| Healthcare / Medical Devices | 1 | $23B |
|
||
| Automotive Technology | 1 | $20B |
|
||
Price history
+44.3% since first listed2 events — show timeline
- 2026-06-09 Listed $140,000 WWMLS
- 2006-09-14 Sold (Public Records) $97,000 Public Records
Property tax history
+8.8%/yrLatest (2025): $1,929 · +107.8% YoY. Source: county tax records.
Cash-flow waterfall
monthlySold comps — $/sqft
last 12 mo · ≤1 miLoading sold comps…