310 S Prospect St · Amarillo, TX
Flood risk 1/10 · Minimal
- FEMA flood zone
- X (unshaded)
- Chance of flooding over 30 yrs
- 0.0%
- Est. flood insurance / yr
- $507 – $1,088
Fire risk 9/10 · Severe
- Est. fire insurance / yr
- $1,222 – $2,270
Heat risk 4/10 · Minor
- Hot days now (above 97°F)
- 6 days/yr
- Hot days in 30 yrs
- 17 days/yr
Wind risk 2/10 · Minimal
- Chance of severe wind over 30 yrs
- —
Air-quality risk 2/10 · Minimal
- Unhealthy air days now
- 1 days/yr
- Unhealthy air days in 30 yrs
- 1 days/yr
Risk factors via First Street. Map © Google.
Why this score? — see what drove the C grade
The composite is a weighted blend of 9 inputs, each scored 0–100. Each bar is that input's sub-score; the figure is the points it added to the 100-point composite (weight × sub-score).
- Cash flow +22.9/30.0
- ARV discount +7.5/15.0
- DSCR +7.4/10.0
- 1% rule +5.9/10.0
- Rent growth +3.7/5.0
- Schools +3.6/10.0
- Livability +3.3/5.0
- Condition / age +2.5/5.0
- Appreciation +0.0/10.0
$120,000
🖨 Deal sheet (PDF) 📄 Offer letter ✓ Due diligence
Listing remarks MLS
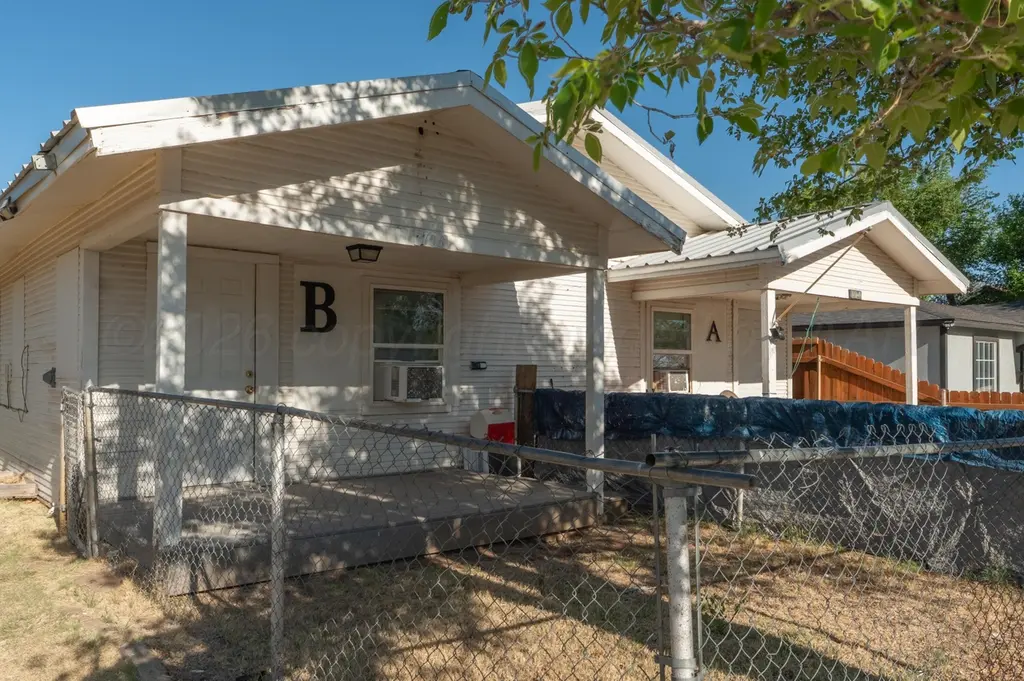
Looking to jump into real estate investing or add more doors to your portfolio? This cash-flowing duplex is your opportunity! With two 1 bed, 1 bath units (each 612 sq ft), this property is already leased and bringing in rental income from day one. Easy-to-manage layout with separate entrances and classic traditional style. Sitting on a spacious lot, this is a solid addition for any investor seeking steady occupancy and long-term potential. Snag this investment opportunity before it's gone!
Key facts
- 6,969 sq ft lot
- Built 1927
- Listed 62 days
Neighborhood map
What this means for you Summary
Snapshot
- This is a 4-bed/2.0-bath other listed at $120k.
Deal economics
- At list price, monthly cash flow is $211 ($3k/yr) — positive.
- The deal already cash-flows at list — no discount required.
- Meets the 1% rule at list price ($1k rent vs $120k).
- Recommended offer: $113k (6.0% below list) — sets the bar for market timing.
Location & tenants
- Location reads 66/100 on livability (#624 in TX) — a middle-class / working-renter tenant base. Strengths: cost of living A+, housing A+; Watch: amenities C-, schools D, crime F.
- Amarillo ISD (urban): math 44% / reading 41% proficiency, ranked #336 of 826 in TX (top 41%) — families likely to look elsewhere, expect single-tenant / working-renter base with shorter leases.
- Market conditions: Rents rising fast (+4.7%/yr); 132 active listings in the ZIP; 8 comparable units currently listed for rent nearby; rentals at typical pace (median 22d on market — plan ~3-4 weeks tenant-placement turnaround); 1,214 units permitted in Potter County in 2024 (650 in 5+ unit buildings).
Forward outlook
- Local home prices are declining (-3.0%/yr); year-one equity from $830 of loan paydown is wiped out by about $4k of value loss. Plan a longer hold.
Negotiation context
- It's been on market 62 days — a 6% lower offer ($113k) is reasonable based on typical stale-listing flexibility.
- 6 sale attempts since 6y ago with the ask held roughly flat each time — persistent listings suggest the price (not the market) is what's stuck; bring a comps-based counter.
Risks & watch-outs
- Watch-outs: built in 1927 — expect roof / HVAC / electrical / plumbing capex.
- Climate carrying-cost: severe wildfire risk — expect insurance premiums to compound above CPI over the hold.
Questions for the listing agent
- It's been on market 62 days. Have you received any prior offers? Is the seller open to a 6% concession, seller financing, or rate buy-down credit?
- Built in 1927 — when were the roof, HVAC, electrical panel, plumbing, and water heater last replaced?
- Why hasn't it sold? Are there any deal-killer items the seller is aware of (foundation, flood, title, zoning, code violations)?
- Is there a deadline driving the sale (1031 exchange, divorce, estate, relocation)? That informs how much negotiation room exists.
- Schools are D-rated, which usually means shorter tenancies and higher turnover. Who's the typical renter profile here, and what's been the actual vacancy rate?
- Crime grade is F in this area — have there been break-ins, vandalism, or insurance claims at this property in the last 3 years? What carrier currently insures it and at what premium?
- What's the average days-on-market for RENTAL listings here right now (not sales)? A rising rental-DOM trend means longer vacancies and softer asking-rent achievability than the comps imply.
- What's the recent tenant-quality profile in this submarket — average credit score on applications, eviction rate, late-payment / NSF rate, and stable-employment percentage? A property-management company in the area should have these aggregated.
- How much new for-sale + rental construction is in the pipeline within 1–3 miles? Heavy new supply typically softens prices + rents 12–24 months out; constrained supply supports both.
Investment metrics
- 1% rule
- 1.09% ✓
- Cap rate
- 8.41%
- Cash-on-cash
- 7.55%
- DSCR
- 1.34
- GRM
- 7.7
CMA / ARV
No comps found within radius.
Projected returns pro-forma
-3.0% appreciation · 4.69% rent growth · sell at horizon
- IRR
- -2.9%
- Equity multiple
- 0.89×
- Total profit
- $-3,703
- Equity at exit
- $17,892
- IRR
- 8.6%
- Equity multiple
- 1.71×
- Total profit
- $23,775
- Equity at exit
- $10,375
Cash invested: $33,600 (down + closing). Projections, not guarantees.
Landlord ↔ Tenant lean methodology
- Overall (STATE)
- 87 Strongly Landlord-Friendly
- State Texas
- 87 Strongly Landlord-Friendly · R+5
- County
- — inherits STATE
- City
- — inherits STATE
ZIP-level market 79106
- Rents YoY
- 4.7%
- Active inventory
- 132
- Price-to-rent
- 7.7×
Monthly cashflow live
- Estimated rent
- $1,307 high interval (Pro) →
- Mortgage (P&I)
- −$629
- Tax from tax record
- −$142 /mo · $1,701/yr
- Insurance
- −$50
- HOA
- −$0
- Vacancy / Maint / Mgmt
- −$274
- Net cashflow
- $211
Break-even live
Sensitivity live
| Price | -10% $279 | -5% $245 | +0% $211 | +5% $177 | +10% $144 |
|---|---|---|---|---|---|
| Rent | -10% $108 | -5% $160 | +0% $211 | +5% $263 | +10% $315 |
| Rate | -1.0pp $272 | -0.5pp $242 | base $211 | +0.5pp $180 | +1.0pp $149 |
UW: 25.0% down · 7.5% · 30yr · 1.5% tax · 5.0% vac · 8.0% maint · 8.0% mgmt
Financing live
Cash to close
- Down payment
- $30,000
- Closing costs
- $3,600
- Reserves months
- —
- Total cash needed
- —
Loan-product check · same deal, 3 products live
Conventional
25% down · 7.5% · 30yr
- Down + closing
- —
- Monthly P&I
- —
- Monthly cashflow
- —
- DSCR
- —
- Eligible?
- —
Personal DTI + credit; lowest rate.
DSCR
20% down · 8.5% · 30yr
- Down + closing
- —
- Monthly P&I
- —
- Monthly cashflow
- —
- DSCR
- —
- Eligible?
- —
No personal income docs; deal must DSCR.
Hard money
10% down · 12.0% · 12mo
- Down + closing
- —
- Monthly P&I
- —
- Monthly cashflow
- —
- DSCR
- —
- Eligible?
- —
Short-term bridge; refi at stabilization.
Rent comps 8 comps
| Address | Beds | Baths | Sqft | Rent | $/sqft | DOM | Units | Dist |
|---|---|---|---|---|---|---|---|---|
| 89 N Fairmont St Amarillo, TX | 3.0 | 1.0 | 780 | $1,000 | $1.28 | 44d | 1 | 0.23mi |
| 701 Sunset Ter Amarillo, TX | 3.0 | 1.0 | 1444 | $1,350 | $0.93 | 22d | 1 | 0.64mi |
| 701 Sunset Ter Amarillo, TX | 3.0 | 1.0 | 1444 | $1,350 | $0.93 | 44d | 1 | 0.64mi |
| 1008 S Mississippi St Amarillo, TX | 3.0 | 2.0 | 1061 | $1,275 | $1.20 | 22d | 1 | 0.74mi |
| 3118 SW 15th Ave Amarillo, TX | 2.0–3.0 | 1.0–2.0 | 1015 | $900 | $0.89 | 14d | 17 | 1.05mi |
| 913 S Rusk St Amarillo, TX | 3.0 | 2.0 | 1450 | $1,450 | $1.00 | 14d | 1 | 1.05mi |
| 1326 Hillcrest St Amarillo, TX | 3.0 | 1.0 | 958 | $1,295 | $1.35 | 22d | 1 | 1.12mi |
| 1809 Chama St Amarillo, TX | 3.0 | 1.0 | 1396 | $1,600 | $1.15 | 44d | 1 | 1.27mi |
Listing history 29 events
-
2026-06-18days on market $120,000 Active 62 DOM
-
2026-06-17days on market $120,000 Active 61 DOM
-
2026-06-16days on market $120,000 Active 60 DOM
-
2026-06-15days on market $120,000 Active 59 DOM
-
2026-06-14days on market $120,000 Active 57 DOM
-
2026-06-13days on market $120,000 Active 56 DOM
-
2026-06-10days on market $120,000 Active 54 DOM
-
2026-06-09days on market $120,000 Active 53 DOM
-
2026-06-08days on market $120,000 Active 52 DOM
-
2026-06-07days on market $120,000 Active 51 DOM
-
2026-06-03days on market $120,000 Active 47 DOM
-
2026-06-02days on market $120,000 Active 46 DOM
-
2026-06-01days on market $120,000 Active 45 DOM
-
2026-05-31days on market $120,000 Active 44 DOM
-
2026-05-30days on market $120,000 Active 43 DOM
-
2026-04-17$120,000 Active 495-char remark
Show marketing remark (495 chars)
Looking to jump into real estate investing or add more doors to your portfolio? This cash-flowing duplex is your opportunity! With two 1 bed, 1 bath units (each 612 sq ft), this property is already leased and bringing in rental income from day one. Easy-to-manage layout with separate entrances and classic traditional style. Sitting on a spacious lot, this is a solid addition for any investor seeking steady occupancy and long-term potential. Snag this investment opportunity before it's gone!
-
2026-01-01historical $750
-
2025-06-04price $750
-
2025-03-11$875
-
2024-08-05historical $875
-
2024-07-19$875
-
2024-06-12historical $875
-
2024-05-08$875
-
2023-02-22$139,000 Active
-
2022-02-03price $575
-
2020-08-03soldstatus
-
2020-07-31soldstatus
-
2020-06-24$58,000
-
2001-04-05soldstatus
ⓘ Source: listings_history table (triggers on properties + properties_extension) + one-shot
backfill from property_details.listing_events for pre-trigger history.
Tax reassessment forecast TX · Resets to sale price
- Current annual tax
- $1,701 · $142/mo
- Projected year-2 tax
- $2,196 · $183/mo
- Expected delta
- +$495/yr (+$41/mo · 29.1%)
ⓘ Screening estimate from a state-policy table — verify with the county assessor before closing.
Climate risk First Street
- Flood 1/10 Low FEMA zone X (unshaded) · 0% chance over 30 yrs
- Wildfire 9/10 Extreme
- Heat 4/10 Moderate 6 d/yr ≥97°F today · 17 d/yr by 30 yrs out
- Wind 2/10 Low
- Air quality 2/10 Low 1 unhealthy d/yr today · 1 by 30 yrs out
Nearby sold comps map
Loading sold comps map…
Walkable amenities ~0.75 mi
Loading nearby amenities…
Taxation est. · year 1
- Rental income
- $15,683
- − Mortgage interest
- −$6,722
- − Property taxes
- −$1,701
- − Insurance
- −$600
- − Repairs & maintenance
- −$1,255
- − Management
- −$1,255
- − Depreciation
- −$3,491
- Taxable income
- $660
- Est. tax owed @ 24.0%
- −$158
- After-tax cash flow
- $2,379/yr
For passive investors: Depreciation is non-cash, so a rental often shows a tax loss while cash-flowing — sheltering income. Rental losses are passive: they offset passive income freely, and up to $25,000/yr can offset ordinary (W-2) income if you actively participate and your MAGI is under $100k (phasing out to $0 by $150k); unused losses carry forward. On sale, claimed depreciation is recaptured at up to 25%, and gains may owe capital-gains tax (a 1031 exchange can defer both). Figures are a year-1 estimate at your 24.0% rate — not tax advice; consult a CPA.
Schools (NCES district)
- District
- Amarillo ISD
- NCES district ID
- 4808130
- Math proficiency
- 44% ▼ -9.00%
- Reading proficiency
- 41% ▼ -3.00%
- Median HH income
- $43,478
- Composite
- 35.96/100
- National rank
- #4798
- State rank
- #336 of 826 in TX
Livability — Amarillo
- Score
- 66/100
- State rank
- #624
- US rank
- #11876
Category grades
Schools grade is shown separately in the Schools card above.
Census & demographics
- Census place
- Amarillo, TX
- County
- Potter County · 72,216 people
- City population
- 185,802
- Metro
- Amarillo, TX
- Population (ZIP)
- 26,161
- Household income
- $59,493
- Rent vs Own
- Severe rent burden
- 994.0
Population outlook (Potter County) Hauer SSP2
- Today (2025)
- 121,296 people
- By 2030
- 120,883 · -0.3%
- By 2040
- 119,668 · -1.3%
- By 2050
- 117,788 · -2.9%
- By 2075
- 110,250 · -9.1%
- By 2100
- 92,923 · -23.4%
Race, ethnicity, and origin ACS 2023
- Neighborhood character
- Diverse neighborhood (Simpson 0.58)
- Race & ethnicity
- White 56% Hispanic / Latino 33% Two or more races 16% Black 5% Asian 4%
- Hispanic origin (detail)
- Mexican 29%
- Common ancestry
- Italian 3% Slovak 2% Iranian 2%
- Foreign-born
- 9% · Canada, Philippines, Vietnam
- Languages at home
- 80% English-only · Spanish 16% Other Asian/Pacific 2% Vietnamese 1%
Political lean MEDSL · Potter
- 2024 margin
- Solid R (+44.4) · D 27.3% · R 71.7% · Other 1.1%
- 2008→2024 swing
- -5.0pp toward R · 2008: -39.4pp · 2024: -44.4pp
- All cycles
- 2024: R+44.4 2020: R+38.7 2016: R+41.9 2012: R+44.6 2008: R+39.4
Not yet ingested
- Civics
- —
Market trends
- HPI YoY
- ▼ -179.04%
- Current HPI
- 178.2153
- Rent YoY
- ▲ 4.69%
- Metro
- Amarillo, TX
- State GDP YoY
- ▲ 3.95%
- F500 in state
- 110
Industry mix (Fortune 500 HQ in TX)
| Industry | F500 HQs | Revenue |
|---|---|---|
| Energy | 16 | $1,198B |
|
||
| Technology | 5 | $198B |
|
||
| Engineering / Construction | 4 | $72B |
|
||
| Energy Services | 3 | $60B |
|
||
| Utilities | 3 | $41B |
|
||
| Healthcare | 2 | $330B |
|
||
Price history
+106.9% since first listed14 events — show timeline
- 2026-04-17 Listed $120,000 AARMLS
- 2026-01-01 Rental Removed $750 AARMLS
- 2025-06-04 Price Changed $750 AARMLS
- 2025-03-11 Listed for Rent $875 AARMLS
- 2024-08-05 Rental Removed $875 AARMLS
- 2024-07-19 Listed for Rent $875 AARMLS
- 2024-06-12 Rental Removed $875 AARMLS
- 2024-05-08 Listed for Rent $875 AARMLS
- 2023-02-22 Listed $139,000 AARMLS
- 2022-02-03 Price Changed $575 RENT.
- 2020-08-03 Sold (Public Records) — Public Records
- 2020-07-31 Sold (MLS) — AARMLS
- 2020-06-24 Listed $58,000 AARMLS
- 2001-04-05 Sold (MLS) — AARMLS
Property tax history
+9.5%/yrLatest (2025): $1,701 · +22.4% YoY. Source: county tax records.
Cash-flow waterfall
monthlySold comps — $/sqft
last 12 mo · ≤1 miLoading sold comps…