21533 Shady Black Oak · Decatur, AR
Flood risk 1/10 · Minimal
- FEMA flood zone
- X (unshaded)
- Chance of flooding over 30 yrs
- 0.0%
- Est. flood insurance / yr
- $507 – $1,088
Fire risk 6/10 · Moderate
- Est. fire insurance / yr
- $1,499 – $2,785
Heat risk 5/10 · Moderate
- Hot days now (above 107°F)
- 7 days/yr
- Hot days in 30 yrs
- 20 days/yr
Wind risk 2/10 · Minimal
- Chance of severe wind over 30 yrs
- 1.0%
Air-quality risk 2/10 · Minimal
- Unhealthy air days now
- 0 days/yr
- Unhealthy air days in 30 yrs
- 1 days/yr
Risk factors via First Street. Map © Google.
Why this score? — see what drove the D+ grade
The composite is a weighted blend of 9 inputs, each scored 0–100. Each bar is that input's sub-score; the figure is the points it added to the 100-point composite (weight × sub-score).
- Cash flow +13.4/30.0
- Appreciation +10.0/10.0
- ARV discount +7.5/15.0
- DSCR +4.0/10.0
- Livability +2.8/5.0
- Rent growth +2.5/5.0
- Condition / age +2.5/5.0
- 1% rule +2.4/10.0
- Schools +2.4/10.0
$200,000
🖨 Deal sheet 📄 Offer letter ✓ Due diligence
Listing remarks MLS
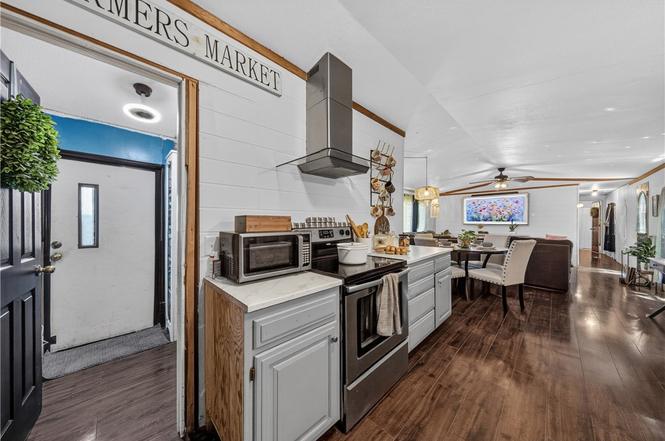
Welcome to country living while still not too far away from the city. This property has a septic system, electricity, city water on site along with a single wide mobile home. There is room to build as well. Come see this today!
Key facts
- Room to build
- Several upgrades
- City water
Tags
Property features AI
Finance
- Other: Approximately 11.85 acres total; About 3.51 acres pasture; About 8.24 acres wooded
- HOA & community: Association fees billed monthly
Exterior
- Parking: Shared road frontage (dirt road)
- Utilities: Electricity available; Propane available; Public water available; Septic available (septic tank)
- Home design: Single-story home; Resale property (less than 25 years old)
- Construction: Wood siding; Metal roof; Skirt foundation
- Exterior features: Unpaved driveway; Outbuilding; Property is outside city limits; Rural setting with wooded areas
Interior
- Flooring: Wood flooring
- Bathrooms: 2 full bathrooms
- Heating & cooling: Ductless heating; Ductless cooling; Window cooling units
- Interior features: Pantry; No additional interior features listed
Neighborhood map
What this means for you Summary
Snapshot
- This is a 3-bed/2.0-bath manufactured listed at $200k.
Deal economics
- At list price, monthly cash flow is $3 ($34/yr) — positive.
- The deal already cash-flows at list — no discount required.
- To meet the 1% rule (rent ≥ 1% of price), the offer needs to be $148k (25.9% below list).
- Recommended offer: $148k (25.9% below list) — sets the bar for 1% rule.
Location & tenants
- Location reads 56/100 on livability (#379 in AR) — a working-class tenant base; expect higher turnover. Strengths: cost of living A+, housing A+; Watch: schools F, crime F, amenities F.
- Decatur School District (rural): math 26% / reading 30% proficiency, ranked #163 of 238 in AR (top 68%) — low school quality limits family demand, transient renter base, plan for 1-2y turnover; 68% free/reduced lunch — lower-income household profile, screen leases tightly.
- Market conditions: 39 active listings in the ZIP; 4,359 units permitted in Benton County in 2024 (402 in 5+ unit buildings).
Forward outlook
- In year one you build about $21k of equity ($1k loan paydown + $20k appreciation (10.0% local appreciation)).
- Benton County population projected at +56% by 2050 — long-run rental-demand tailwind backs the buy-and-hold thesis.
- At projected returns (10.0% appreciation + 3.0% rent growth), your $56k cash investment doubles in ~3 years — after that, you're playing with house money.
- By year 2, paydown + projected appreciation supports a ~$34k cash-out refi (75% LTV) — recoverable capital for the next deal without selling this one.
Negotiation context
- Only 2 days on market — expect competitive offers; lowballing is unlikely to land.
- 2 sale attempts with the ask held roughly flat each time — persistent listings suggest the price (not the market) is what's stuck; bring a comps-based counter.
- Current owner paid $24k; list at $200k implies a 716% gain — meaningful room to come down on a strong offer.
Risks & watch-outs
- Climate carrying-cost: major wildfire risk; extreme-heat days projected 7→20/yr by 2055 (HVAC capex compounding) — expect insurance premiums to compound above CPI over the hold.
Questions for the listing agent
- Is there a deadline driving the sale (1031 exchange, divorce, estate, relocation)? That informs how much negotiation room exists.
- Schools are F-rated, which usually means shorter tenancies and higher turnover. Who's the typical renter profile here, and what's been the actual vacancy rate?
- Crime grade is F in this area — have there been break-ins, vandalism, or insurance claims at this property in the last 3 years? What carrier currently insures it and at what premium?
- The area grade is low — what's the realistic commute time and amenity access for the typical tenant pool here? Any planned neighborhood developments (good or bad) we should know about?
- What's the average days-on-market for RENTAL listings here right now (not sales)? A rising rental-DOM trend means longer vacancies and softer asking-rent achievability than the comps imply.
- What's the recent tenant-quality profile in this submarket — average credit score on applications, eviction rate, late-payment / NSF rate, and stable-employment percentage? A property-management company in the area should have these aggregated.
- How much new for-sale + rental construction is in the pipeline within 1–3 miles? Heavy new supply typically softens prices + rents 12–24 months out; constrained supply supports both.
Investment metrics
- 1% rule
- 0.74% ✗
- Cap rate
- 6.31%
- Cash-on-cash
- 0.06%
- DSCR
- 1.00
- GRM
- 11.2
CMA / ARV
No comps found within radius.
Projected returns pro-forma
10.0% appreciation · 3.0% rent growth · sell at horizon
- IRR
- 24.3%
- Equity multiple
- 2.95×
- Total profit
- $108,994
- Equity at exit
- $180,176
- IRR
- 21.5%
- Equity multiple
- 6.73×
- Total profit
- $320,611
- Equity at exit
- $388,556
Cash invested: $56,000 (down + closing). Projections, not guarantees.
Landlord ↔ Tenant lean methodology
- Overall (STATE)
- 92 Strongly Landlord-Friendly
- State Arkansas
- 92 Strongly Landlord-Friendly · R+14
- County
- — inherits STATE
- City
- — inherits STATE
ZIP-level market 72722
- Home prices YoY
- 15.4%
- Active inventory
- 39
- Price-to-rent
- 11.2×
Monthly cashflow live
- Estimated rent
- $1,482 medium interval (Pro) →
- Mortgage (P&I)
- −$1,049
- Tax from tax record
- −$36 /mo · $428/yr
- Insurance
- −$83
- HOA
- −$0
- Vacancy / Maint / Mgmt
- −$311
- Net cashflow
- $3
Break-even live
UW: 25.0% down · 7.5% · 30yr · 1.5% tax · 5.0% vac · 8.0% maint · 8.0% mgmt
Financing live
Cash to close
- Down payment
- $50,000
- Closing costs
- $6,000
- Reserves months
- —
- Total cash needed
- —
Loan-product check · same deal, 3 products live
Conventional
25% down · 7.5% · 30yr
- Down + closing
- —
- Monthly P&I
- —
- Monthly cashflow
- —
- DSCR
- —
- Eligible?
- —
Personal DTI + credit; lowest rate.
DSCR
20% down · 8.5% · 30yr
- Down + closing
- —
- Monthly P&I
- —
- Monthly cashflow
- —
- DSCR
- —
- Eligible?
- —
No personal income docs; deal must DSCR.
Hard money
10% down · 12.0% · 12mo
- Down + closing
- —
- Monthly P&I
- —
- Monthly cashflow
- —
- DSCR
- —
- Eligible?
- —
Short-term bridge; refi at stabilization.
Listing history 3 events
-
2026-06-18days on market $200,000 Active 2 DOM
-
2026-06-17remarks 279-char remark
-
2026-06-17$200,000 Active 1 DOM
ⓘ Source: listings_history table (triggers on properties + properties_extension) + one-shot
backfill from property_details.listing_events for pre-trigger history.
Tax reassessment forecast AR · Resets to sale price
- Current annual tax
- $428 · $36/mo
- Projected year-2 tax
- $1,280 · $107/mo
- Expected delta
- +$852/yr (+$71/mo · 199.3%)
ⓘ Screening estimate from a state-policy table — verify with the county assessor before closing.
Climate risk First Street
- Flood 1/10 Low FEMA zone X (unshaded) · 0% chance over 30 yrs
- Wildfire 6/10 Major
- Heat 5/10 Major 7 d/yr ≥107°F today · 20 d/yr by 30 yrs out
- Wind 2/10 Low 100% chance of damaging wind over 30 yrs
- Air quality 2/10 Low 0 unhealthy d/yr today · 1 by 30 yrs out
Nearby sold comps map
Loading sold comps map…
Walkable amenities ~0.75 mi
Loading nearby amenities…
Taxation est. · year 1
- Rental income
- $17,781
- − Mortgage interest
- −$11,203
- − Property taxes
- −$428
- − Insurance
- −$1,000
- − Repairs & maintenance
- −$1,422
- − Management
- −$1,422
- − Depreciation
- −$5,818
- Taxable loss
- −$3,513
- Est. tax savings @ 24.0%
- +$843
- After-tax cash flow
- $877/yr
For passive investors: Depreciation is non-cash, so a rental often shows a tax loss while cash-flowing — sheltering income. Rental losses are passive: they offset passive income freely, and up to $25,000/yr can offset ordinary (W-2) income if you actively participate and your MAGI is under $100k (phasing out to $0 by $150k); unused losses carry forward. On sale, claimed depreciation is recaptured at up to 25%, and gains may owe capital-gains tax (a 1031 exchange can defer both). Figures are a year-1 estimate at your 24.0% rate — not tax advice; consult a CPA.
Schools (NCES district)
- District
- Decatur School District
- NCES district ID
- 0504980
- Math proficiency
- 26% ▼ -6.00%
- Reading proficiency
- 30% ▬ 0.00%
- Median HH income
- $41,201
- Composite
- 23.69/100
- National rank
- #7833
- State rank
- #163 of 238 in AR
Livability — Decatur
- Score
- 56/100
- State rank
- #379
- US rank
- #22548
Category grades
Schools grade is shown separately in the Schools card above.
Census & demographics
- City population
- 2,920
- Population (ZIP)
- 2,920
Population outlook (Benton County) Hauer SSP2
- Today (2025)
- 318,683 people
- By 2030
- 353,481 · +10.9%
- By 2040
- 425,280 · +33.4%
- By 2050
- 497,239 · +56.0%
- By 2075
- 662,114 · +107.8%
- By 2100
- 776,431 · +143.6%
Race, ethnicity, and origin ACS 2023
- Neighborhood character
- Diverse neighborhood (Simpson 0.66)
- Race & ethnicity
- White 56% Two or more races 29% Hispanic / Latino 14% Asian 5% Black 3% Native American 3%
- Hispanic origin (detail)
- Mexican 7% Puerto Rican 2%
- Common ancestry
- Italian 1% Iranian 1% Slovak 1%
- Foreign-born
- 13% · Canada, Vietnam
- Languages at home
- 82% English-only · Spanish 11% Other Asian/Pacific 3% French/Haitian/Cajun 2%
Political lean MEDSL · Benton
- 2024 margin
- Strong R (+27.0) · D 35.2% · R 62.1% · Other 2.7%
- 2008→2024 swing
- +9.6pp toward D · 2008: -36.5pp · 2024: -27.0pp
- All cycles
- 2024: R+27.0 2020: R+26.4 2016: R+34.9 2012: R+40.4 2008: R+36.5
Not yet ingested
- Civics
- —
Market trends
- HPI YoY
- ▲ 57.29%
- Current HPI
- 428.7914
- Rent YoY
- —
- Metro
- —
- State GDP YoY
- ▲ 3.80%
- F500 in state
- 10
Industry mix (Fortune 500 HQ in AR)
| Industry | F500 HQs | Revenue |
|---|---|---|
| Retail | 1 | $681B |
|
||
| Food / Agriculture | 1 | $53B |
|
||
| Retail / Energy | 1 | $22B |
|
||
| Transportation / Logistics | 1 | $12B |
|
||
| Energy | 1 | $4B |
|
||
Price history
+1566.7% since first listed4 events — show timeline
- 2026-06-16 Listed $200,000 NWARMLS
- 2026-06-16 Listed $200,000 NWARMLS
- 2020-04-24 Sold (Public Records) $24,500 Public Records
- 1997-12-05 Sold (Public Records) $12,000 Public Records
Property tax history
+2.1%/yrLatest (2025): $428 · +0.6% YoY. Source: county tax records.
Cash-flow waterfall
monthlySold comps — $/sqft
last 12 mo · ≤1 miLoading sold comps…