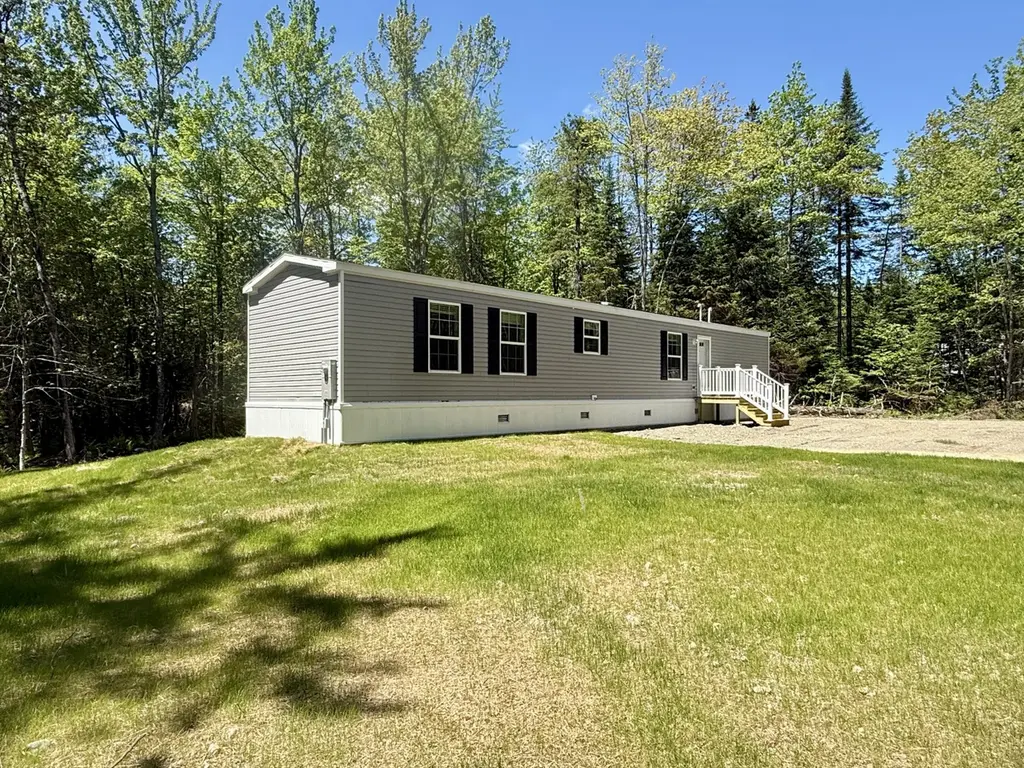
60 Alton Tannery Rd · Old Town, ME
Flood risk No data
- FEMA flood zone
- —
- Chance of flooding over 30 yrs
- —
- Est. flood insurance / yr
- —
Fire risk No data
- Est. fire insurance / yr
- —
Heat risk No data
- Hot days now (above threshold)
- —
- Hot days in 30 yrs
- —
Wind risk No data
- Chance of severe wind over 30 yrs
- —
Air-quality risk No data
- Unhealthy air days now
- —
- Unhealthy air days in 30 yrs
- —
Risk factors via First Street. Map © Google.
Why this score? — see what drove the D- grade
The composite is a weighted blend of 9 inputs, each scored 0–100. Each bar is that input's sub-score; the figure is the points it added to the 100-point composite (weight × sub-score).
- ARV discount +7.5/15.0
- Cash flow +6.8/30.0
- Schools +6.8/10.0
- Appreciation +6.3/10.0
- Livability +3.8/5.0
- Rent growth +2.5/5.0
- Condition / age +2.5/5.0
- 1% rule +1.8/10.0
- DSCR +1.0/10.0
$189,000
🖨 Deal sheet (PDF) 📄 Offer letter ✓ Due diligence
Listing remarks
Affordable New Construction on 1.25 Private Acres in Hudson! Welcome home to affordable new construction in a beautiful rural setting. Situated on 1.25 private acres, this brand-new Redman manufactured home offers the opportunity to enjoy country living without sacrificing convenience. Just 10 minutes from Orono, 20 minutes from Bangor, and with easy access to I-95, you'll enjoy the perfect blend of privacy, comfort, and accessibility. Everything is brand new and has never been lived in, allowing you to enjoy the peace of mind that comes with new construction. For added confidence, the home includes the manufacturer's warranty, providing valuable protection and peace of mind for years to
Key facts
- Private acres
- Large windows
- Easy access to i-95
Tags
Property features AI
Finance
- Other: Property subtype: Mobile Home; Zoning: Residential; Lot size about 1.25 acres
Exterior
- Parking: Gravel parking; Space for 5–10 vehicles
- Utilities: Electric on site with circuit breakers; Private well water; Private sewer (septic tank); Electric water heater; Utilities available via pole
- Home design: Mobile home (single wide); Redman model 46627 Patio Door; 2025 construction; Facing direction not specified; One story; Entry level: first floor
- Construction: Wood frame construction; Vinyl siding; Shingle roof; Slab foundation
- Exterior features: Deck; Rural setting; Level lot; Wooded; Near turnpike/interstate
Interior
- Kitchen: Dishwasher; Microwave; Gas range; Refrigerator; Pantry
- Bedrooms: Primary bedroom — first floor; Bedroom 2 — first floor
- Flooring: Vinyl
- Bathrooms: 2 full bathrooms
- Heating & cooling: Forced air heating; Hot water heating; Ceiling fans
- Interior features: One-floor living; First-floor bedroom; First-floor primary bedroom with bath; Primary bedroom with bath; Bathtub; Shower; Pantry; Walk-in closet(s)
- Laundry & utility: Main level laundry; Washer hookup
Neighborhood map
What this means for you Summary
Snapshot
- This is a 2-bed/2.0-bath manufactured listed at $189k.
Deal economics
- At list price, monthly cash flow is $-296 ($-4k/yr) — negative.
- To cash-flow at today's rent, offer at most $146k (22.7% below list).
- To meet the 1% rule (rent ≥ 1% of price), the offer needs to be $128k (32.3% below list).
- Recommended offer: $128k (32.3% below list) — sets the bar for 1% rule.
- Cap rate 4.4% vs local median 6.0% in Old Town — below-typical yield; the buyer is paying a premium for something (appreciation thesis, condition, location) that the cap rate doesn't capture.
Location & tenants
- Location reads 75/100 on livability (#38 in ME, #3,905 nationally) — a middle-class / working-renter tenant base. Strengths: crime A+, cost of living A+, housing A+; Watch: schools D+, employment D, amenities F.
- RSU 34 (suburban): math 81% / reading 83% proficiency, ranked #80 of 112 in ME (top 71%) — strong family-tenant draw, lease renewals of 3-5y typical.
- Market conditions: 1 active listings in the ZIP; 440 units permitted in Penobscot County in 2024 (40 in 5+ unit buildings).
Forward outlook
- In year one you build about $6k of equity ($1k loan paydown + $5k appreciation (2.7% local appreciation)).
- Penobscot County population projected at -17% by 2050 — secular population decline; favor cash flow + early exit over multi-decade hold.
- By year 6, paydown + projected appreciation supports a ~$34k cash-out refi (75% LTV) — recoverable capital for the next deal without selling this one.
Negotiation context
- Only 2 days on market — expect competitive offers; lowballing is unlikely to land.
Questions for the listing agent
- What do current leases actually rent for vs. the listed asking? Can we see a recent rent roll and the last 12 months of T-12 income?
- Is there a deadline driving the sale (1031 exchange, divorce, estate, relocation)? That informs how much negotiation room exists.
- Schools are D-rated, which usually means shorter tenancies and higher turnover. Who's the typical renter profile here, and what's been the actual vacancy rate?
- The area grade is low — what's the realistic commute time and amenity access for the typical tenant pool here? Any planned neighborhood developments (good or bad) we should know about?
- What's the average days-on-market for RENTAL listings here right now (not sales)? A rising rental-DOM trend means longer vacancies and softer asking-rent achievability than the comps imply.
- What's the recent tenant-quality profile in this submarket — average credit score on applications, eviction rate, late-payment / NSF rate, and stable-employment percentage? A property-management company in the area should have these aggregated.
- How much new for-sale + rental construction is in the pipeline within 1–3 miles? Heavy new supply typically softens prices + rents 12–24 months out; constrained supply supports both.
Investment metrics
- 1% rule
- 0.68% ✗
- Cap rate
- 4.41%
- Cash-on-cash
- -6.71%
- DSCR
- 0.70
- GRM
- 12.3
CMA / ARV
No comps found within radius.
Projected returns pro-forma
2.68% appreciation · 3.0% rent growth · sell at horizon
- IRR
- 0.2%
- Equity multiple
- 1.01×
- Total profit
- $734
- Equity at exit
- $81,569
- IRR
- 4.2%
- Equity multiple
- 1.63×
- Total profit
- $33,121
- Equity at exit
- $123,115
Cash invested: $52,920 (down + closing). Projections, not guarantees.
Landlord ↔ Tenant lean methodology
- Overall (STATE)
- 41 Moderately Tenant-Leaning
- State Maine
- 41 Moderately Tenant-Leaning · D+2
- County
- — inherits STATE
- City
- — inherits STATE
ZIP-level market 04449
- Home prices YoY
- 1.2%
- Active inventory
- 1
- Price-to-rent
- 12.3×
Monthly cashflow live
- Estimated rent
- $1,279 medium interval (Pro) →
- Mortgage (P&I)
- −$991
- Tax est. 1.5%
- −$236 /mo · $2,835/yr
- Insurance
- −$79
- HOA
- −$0
- Vacancy / Maint / Mgmt
- −$269
- Net cashflow
- $-296
Break-even live
Sensitivity live
| Price | -10% $-165 | -5% $-231 | +0% $-296 | +5% $-361 | +10% $-426 |
|---|---|---|---|---|---|
| Rent | -10% $-397 | -5% $-346 | +0% $-296 | +5% $-245 | +10% $-195 |
| Rate | -1.0pp $-201 | -0.5pp $-248 | base $-296 | +0.5pp $-345 | +1.0pp $-395 |
UW: 25.0% down · 7.5% · 30yr · 1.5% tax · 5.0% vac · 8.0% maint · 8.0% mgmt
Financing live
Cash to close
- Down payment
- $47,250
- Closing costs
- $5,670
- Reserves months
- —
- Total cash needed
- —
Loan-product check · same deal, 3 products live
Conventional
25% down · 7.5% · 30yr
- Down + closing
- —
- Monthly P&I
- —
- Monthly cashflow
- —
- DSCR
- —
- Eligible?
- —
Personal DTI + credit; lowest rate.
DSCR
20% down · 8.5% · 30yr
- Down + closing
- —
- Monthly P&I
- —
- Monthly cashflow
- —
- DSCR
- —
- Eligible?
- —
No personal income docs; deal must DSCR.
Hard money
10% down · 12.0% · 12mo
- Down + closing
- —
- Monthly P&I
- —
- Monthly cashflow
- —
- DSCR
- —
- Eligible?
- —
Short-term bridge; refi at stabilization.
Listing history 2 events
-
2026-06-07remarks 699-char remark
-
2026-06-07$189,000 Pending 2 DOM
ⓘ Source: listings_history table (triggers on properties + properties_extension) + one-shot
backfill from property_details.listing_events for pre-trigger history.
Nearby sold comps map
Loading sold comps map…
Walkable amenities ~0.75 mi
Loading nearby amenities…
Taxation est. · year 1
- Rental income
- $15,346
- − Mortgage interest
- −$10,587
- − Property taxes
- −$2,835
- − Insurance
- −$945
- − Repairs & maintenance
- −$1,228
- − Management
- −$1,228
- − Depreciation
- −$5,498
- Taxable loss
- −$6,975
- Est. tax savings @ 24.0%
- +$1,674
- After-tax cash flow
- $-1,876/yr
For passive investors: Depreciation is non-cash, so a rental often shows a tax loss while cash-flowing — sheltering income. Rental losses are passive: they offset passive income freely, and up to $25,000/yr can offset ordinary (W-2) income if you actively participate and your MAGI is under $100k (phasing out to $0 by $150k); unused losses carry forward. On sale, claimed depreciation is recaptured at up to 25%, and gains may owe capital-gains tax (a 1031 exchange can defer both). Figures are a year-1 estimate at your 24.0% rate — not tax advice; consult a CPA.
Schools (NCES district)
- District
- RSU 34
- NCES district ID
- 2314782
- Math proficiency
- 81% ▲ 48.00%
- Reading proficiency
- 83% ▲ 31.00%
- Median HH income
- $39,466
- Composite
- 68.31/100
- National rank
- #351
- State rank
- #80 of 112 in ME
Livability — Old Town
- Score
- 75/100
- State rank
- #38
- US rank
- #3905
Category grades
Schools grade is shown separately in the Schools card above.
Census & demographics
- City population
- 9,291
- Population (ZIP)
- 1,144
Population outlook (Penobscot County) Hauer SSP2
- Today (2025)
- 149,928 people
- By 2030
- 146,386 · -2.4%
- By 2040
- 135,952 · -9.3%
- By 2050
- 123,864 · -17.4%
- By 2075
- 97,825 · -34.8%
- By 2100
- 77,196 · -48.5%
Race, ethnicity, and origin ACS 2023
- Neighborhood character
- Predominantly White (97%)
- Race & ethnicity
- White 97% Two or more races 2%
- Common ancestry
- Lithuanian 21% Slovak 4% Romanian 3%
- Foreign-born
- 1%
- Languages at home
- 97% English-only · Russian/Polish/Slavic 1% French/Haitian/Cajun 1%
Political lean MEDSL · Penobscot
- 2024 margin
- R (+10.9) · D 43.6% · R 54.5% · Other 1.9%
- 2008→2024 swing
- -15.9pp toward R · 2008: 5.0pp · 2024: -10.9pp
- All cycles
- 2024: R+10.9 2020: R+8.3 2016: R+10.9 2012: D+2.9 2008: D+5.0
Not yet ingested
- Civics
- —
Market trends
- HPI YoY
- ▲ 2.68%
- Current HPI
- 221.4268
- Rent YoY
- —
- Metro
- —
- State GDP YoY
- —
- F500 in state
- 0
Price history
2 events — show timeline
- 2026-06-07 Pending — MREIS
- 2026-06-05 Listed $189,000 MREIS
Cash-flow waterfall
monthlySold comps — $/sqft
last 12 mo · ≤1 miLoading sold comps…